
Abstract
Macrophage infiltration is a prominent feature of abdominal aortic aneurysm (AAA) progression. We used a combined imaging approach with bioluminescence (BLI) and magnetic resonance imaging (MRI) to study macrophage homing and accumulation in experimental AAA disease. Murine AAAs were created via intra-aortic infusion of porcine pancreatic elastase. Mice were imaged over 14 days after injection of prepared peritoneal macrophages. For BLI, macrophages were from transgenic mice expressing luciferase. For MRI, macrophages were labeled with iron oxide particles. Macrophage accumulation during aneurysm progression was observed by in situ BLI and by in vivo 7T MRI. Mice were sacrificed after imaging for histologic analysis. In situ BLI (n = 32) demonstrated high signal in the AAA by days 7 and 14, which correlated significantly with macrophage number and aortic diameter. In vivo 7T MRI (n = 13) at day 14 demonstrated T2* signal loss in the AAA and not in sham mice. Immunohistochemistry and Prussian blue staining confirmed the presence of injected macrophages in the AAA. BLI and MRI provide complementary approaches to track macrophage homing and accumulation in experimental AAAs. Similar dual imaging strategies may aid the study of AAA biology and the evaluation of novel therapies.
MACROPHAGE INFILTRATION plays a central role in the progression of abdominal aortic aneurysm (AAA) disease, given its capacity to secrete inflammatory cytokines and proteolytic enzymes that degrade the extracellular matrix (ECM).1,2 Improved noninvasive detection of macrophage burden and the dynamics of macrophage homing to the aneurysm could contribute important information regarding AAA biology, risk stratification, and evaluating therapies aimed at inhibiting macrophage accumulation. 3
In vivo bioluminescence imaging (BLI) is a sensitive optical imaging technique that has been used extensively to monitor cellular dynamics in tumor models and bone marrow transplantation4–6 Magnetic resonance imaging (MRI) provides excellent structural imaging of vascular diseases, including atherosclerosis 7 and AAA. 8 In addition, iron- or gadolinium-based MRI contrast agents have been used to image vascular macrophages.9,10
In the present study, we investigated a combined imaging approach (BLI and MRI) to provide complementary information about macrophage homing and accumulation in experimental AAA disease.
Materials and Methods
Experimental AAA
All animal care and experimental procedures were conducted in compliance with the Stanford University Administrative Panel on Laboratory Animal Care Guidelines (<http://labanimals.stanford.edu/.). Animal protocols were approved by the Institutional Animal Care and Use Committee at Stanford University. FVB or C57BL/6J male mice (20–30 g, Jackson Laboratories, Bar Harbor, ME), aged 10 to 12 weeks, were used for BLI and MRI experiments, respectively. AAAs were created via intra-aortic infusion of porcine pancreatic elastase (PPE), as previously described. 11 Briefly, laparotomy was performed after appropriate anesthesia with inhaled isoflurane, and PPE (E-1250, Lot 102K7685, Sigma, St. Louis, MO) was infused into the infrarenal aorta (0.03 mL of 15 U/mL of PPE) over 5 minutes. Sham mice underwent the identical procedure but received infusion of saline. At sacrifice, mice were euthanized via intentional overdose of intraperitoneal sodium pentothal.
Measurement of Aortic Diameter
Serial external aortic diameter measurements on all mice were obtained via transabdominal ultrasonography at 40 MHz (Vevo770, VisualSonics, Toronto, ON). Mice were imaged following AAA induction, in a blinded fashion, on postoperative days (PODs) 3, 7, and 14. The sensitivity and reproducibility of similar murine AAA high-frequency ultrasound measurement protocols have been demonstrated previously.3,12
Preparation of Peritoneal Macrophages
Peritoneal macrophages for the BLI experiments were collected in L2G85 transgenic mice. 13 The L2G85 mice are on the FVB background and constitutively express (via CAG promoter) both firefly luciferase and green fluorescence protein (GFP). To collect peritoneal macrophages, 1.5 mL of 4% aged thioglycollate (Becton Dickinson, Sparks, MD) was injected into the abdominal cavity of each mouse. 14 Four days later, peritoneal lavage was performed with Hanks' Balanced Salt Solution (HBSS; Invitrogen, Grand Island, NY). Lavage solution was centrifuged at 1,500 rpm for 5 minutes and resuspended in 2 mL of 0.18% saline for 60 seconds to hemolyze contaminating erythrocytes, followed by 2 mL of 1.62% saline to restore isotonicity. Cells were then centrifuged again for final resuspension in 1 mL of HBSS. Individual macrophage cells were counted using a Fuchs-Rosenthal Chamber (Hausser Scientific, Horsham, PA).
Bioluminescence Imaging
BLI was performed using the IVIS 200 system (Xenogen, Alameda, CA) and analyzed using Living Image software (Caliper Life Sciences, Hopkintown, MA). For in vitro imaging, peritoneal macrophages obtained from L2G85 mice were placed in a 96-well culture plate at an initial concentration of 100,000 cells per well and serially diluted to 195 cells per well. Cells were imaged for 1 minute following incubation with D-luciferin (15 mg/mL, Caliper Life Sciences).
In situ BLI was performed on PODs 3, 7, and 14. Tail vein injection of 3 × 10⁶ peritoneal macrophages from L25G8 transgenic mice was delivered to AAA (n = 17) and sham (n = 15) wild-type FVB mice on POD 1 (Figure 1). A separate cohort of AAA mice (n = 9) were injected with normal saline via the tail vein to assess background BLI signal in the absence of luc+/GFP+ cells. In brief, mice were anesthetized in an induction chamber with 2% isoflurane in 100% oxygen and given an intraperitoneal injection of 225 mg/kg D-luciferin. Subsequent laparotomy and exposure of the abdominal aorta were performed 5 minutes after luciferin injection. Mice were placed inside a light impermissible box of the IVIS 200 system and imaged with an ultrasensitive charge-coupled device camera for 5 minutes. For each acquisition, the signal intensity (SI) of the aorta was measured as the total photon flux (photon/s/cm2/sr) from a standardized region of interest around the infrarenal aorta. This was followed by ex vivo BLI, whereby the aorta was harvested after euthanasia, placed in a culture plate immersed with luciferin solution, and then imaged for 10 minutes.
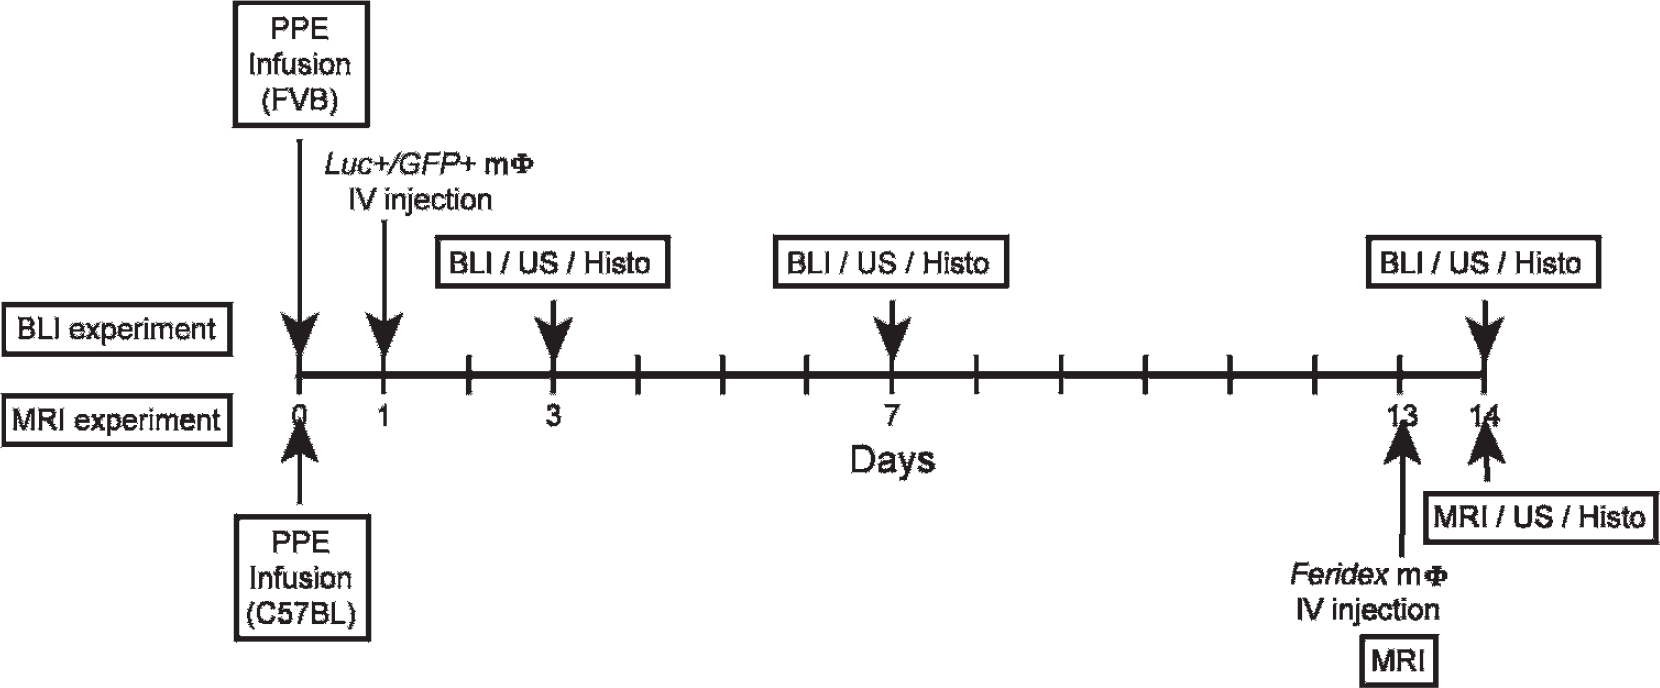
Experimental protocol for the bioluminescence imaging (BLI) (n = 32) and magnetic resonance imaging (MRI) (n = 13) cohorts over a 14-day period. Histo = histology; Luc+/GFP+ = luciferase+/green fluorescent protein+; mΦ = macrophage; PPE = porcine pancreatic elastase; US = ultrasonography.
In Vitro Labeling of Macrophages with Superparamagnetic Iron Oxide
Peritoneal macrophages were collected from C57BL/6J mice for MRI by the same procedure as for BLI, described above. They were then cultured and resuspended within Chamber slides (Lab-Tek Chamber slide system, Thermo Fisher Scientific Inc., Rochester, NY) in Dulbecco's Modified Eagle's Medium (DMEM), 1% fetal calf serum, and 10% penicillin for 24 hours at 37°C in a standard culture incubator to allow macrophage adherence (3 × 10⁶cells/Chamber slide). To assess optimal macrophage labeling, macrophages were incubated with iron oxide particles for the next 24 hours (Feridex IV, Advanced Magnetics, Cambridge, MA) in concentrations of 0, 25, 50, 75, 100, 125, 150, and 200 µg of iron (Fe)/mL. The degree of cell labeling was then estimated by Prussian blue staining. Cells were counted at high-power field (400×) to determine the percentage of cells loaded with iron oxide particles in the cytoplasm of macrophages.
Based on the labeling assessment, all MRI experiments were performed using peritoneal macrophages incubated with 150 µg Fe/mL for 24 hours after initial adherence. The adherent labeled macrophages were lifted off the plate by incubation with 10 mmol/L ethylenediaminetetraacetic acid (EDTA) in phosphate-buffered saline for 10 minutes at 37°C. Macrophages were washed free of EDTA and resuspended in HBSS before injection. Macrophage labeling was also verified in vitro by T2-weighted fast spin echo MRI (echo time [TE]/repetition time [TR] = 41.2 ms/4,000 ms, echo train length = 8, 128 × 128 matrix, 6 cm field of view [FOV], 1 mm thick slices, number of excitations [NEX] = 5) performed on a 7T magnet (Varian, Inc., Palo Alto, CA) with an RRI gradient insert (Model BFG-150/90-S, Resonance Research Inc., Billerica, MA) and the 12.0 Excite clinical interface (GE Healthcare, Waukesha, WI).
Magnetic Resonance Imaging
In vivo T2*-weighted MRI was performed on the same 7T MRI system, first before injection (“pre” scan, POD 13) and then 24 hours after injection of labeled macrophages or control (“post” scan, POD 14; see Figure 1). A total of 8 × 10⁶ iron oxide–labeled peritoneal macrophages (in 400 µL of HBSS) were administered to AAA (n = 5) and sham (n = 5) mice via tail vein injection. As an additional control, AAA mice (n = 3) were injected with free iron oxide particles (150 µg Fe/mL in 400 µL) instead of labeled macrophages. The aortas were imaged using a T2*-weighted two-dimensional gradient echo (GRE) sequence 15 (TE 4.2 ms/TR 50 ms, flip angle 20°, FOV 3 cm, matrix 256 × 256, slice thickness 0.5 mm, NEX 10). Pre- and postimages were coregistered based on the location of the left renal vein. The relative SI of the infrarenal aorta was measured by averaging the SI of the aorta for 12 consecutive axial slices inferior to the level of the left renal vein crossover and dividing by the average SI of the normal suprarenal aorta for five consecutive axial slices superior to the renal crossover. 16
Histopathology and Immunohistochemistry
Mice were euthanized and pressure perfused with 4% paraformaldehyde (PFA) solution injected into the left ventricle. The aorta was harvested for histologic analysis after exsanguination. Further fixation was achieved by overnight immersion in 4% PFA solution at 4°C followed by 30% sucrose. After OCT embedding, blocks were sectioned with a cryostat at 5 µm for immunohistochemical (IHC) staining or Prussian blue iron staining. Primary antibodies for IHC staining included rabbit polyclonal antimouse GFP (Invitrogen, Carlsbad, CA) and rat antimouse MAC-2 for macrophages (Cedarlane Laboratories, Burlington, ON). After primary incubation, sections were incubated with a biotinylated secondary antibody (Biocare Medical, Concord, CA) and an avidin-biotin complex (Vectastain ABC kits, Vector Laboratories, Burlingame, CA) according to the manufacturer's protocol. Color development was performed using the DAB color development system (Dako Corporation, Carpinteria, CA). Tissue sections were then counterstained with hematoxylin. Negative control experiments were performed by replacing the primary antibody with nonspecific IgG.
Statistical Analysis
All statistical analysis was performed using the StatView J-5.0 software program (SAS Institute Inc., Cary, NC). Data are represented as mean ± standard error (SEM). Statistical analysis between two groups was performed using the Student t-test. Multiple comparisons were analyzed using one-way analysis of variance (ANOVA) for continuous variables followed by the Scheffé post hoc test. Statistical significance was defined as p < .05.
Results
In Vitro Bioluminescence Sensitivity
In vitro BLI of peritoneal macrophages in dilution from 100,000 to 195 cells demonstrated bioluminescent signal apparent with as few as roughly 1,500 macrophages per well (Figure 2A). SI and cell number were positively correlated (r = .996, p < .01; Figure 2B).
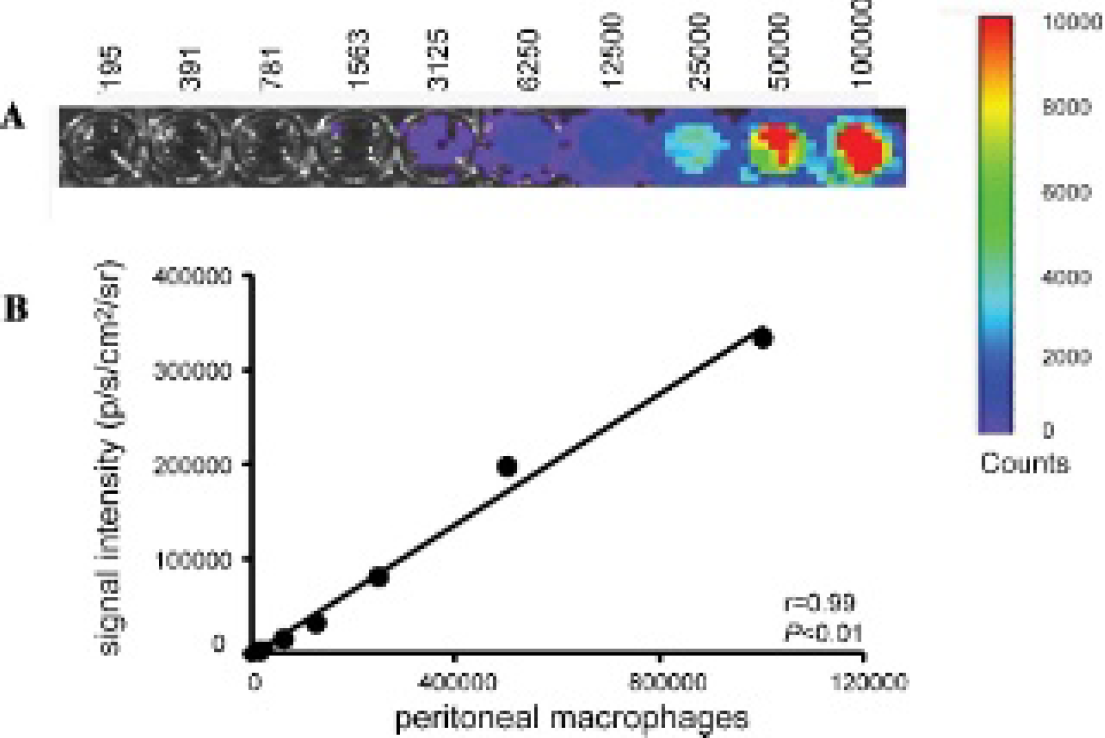
A, In vitro bioluminescence imaging (BLI) of peritoneal macrophages in dilution from 100,000 to 195 cells. B, Significant positive correlation between BLI signal intensity and macrophage number.
In Situ and Ex Vivo BLI
In situ BLI demonstrated high SI in the AAA compared to sham mice (Figure 3, A and B). Similar findings were demonstrated with ex vivo BLI (Figure 3, C and D). Preinfusion aortic diameters were similar between the two groups (AAA: 0.72 ± 0.01 vs sham: 0.73 ± 0.01 mm). The mean aortic diameter in AAA mice gradually increased over the 2-week period and became significantly larger in AAA mice compared to sham mice at POD 3 (AAA: 0.91 ± 0.01 vs sham: 0.80 ± 0.01 mm), POD 7 (AAA: 0.99 ± 0.02 vs sham: 0.81 ± 0.01 mm), and POD 14 (AAA: 1.10 ± 0.03 vs sham: 0.78 ± 0.02 mm; p < .01). Quantification of in situ SI showed that, by day 7, AAA signal became significantly higher than sham controls (AAA: 6,251 ± 852 vs sham: 3,669 ± 281 photon/s/cm2/sr; p < .05; Figure 4A). SI from AAA mice was positively correlated with maximum aortic diameter (n = 17, r = .68, p < .01; Figure 4B). AAA mice injected with saline instead of macrophages (n = 9) did demonstrate a background SI of 2,380 ± 486 photon/s/cm2/sr.
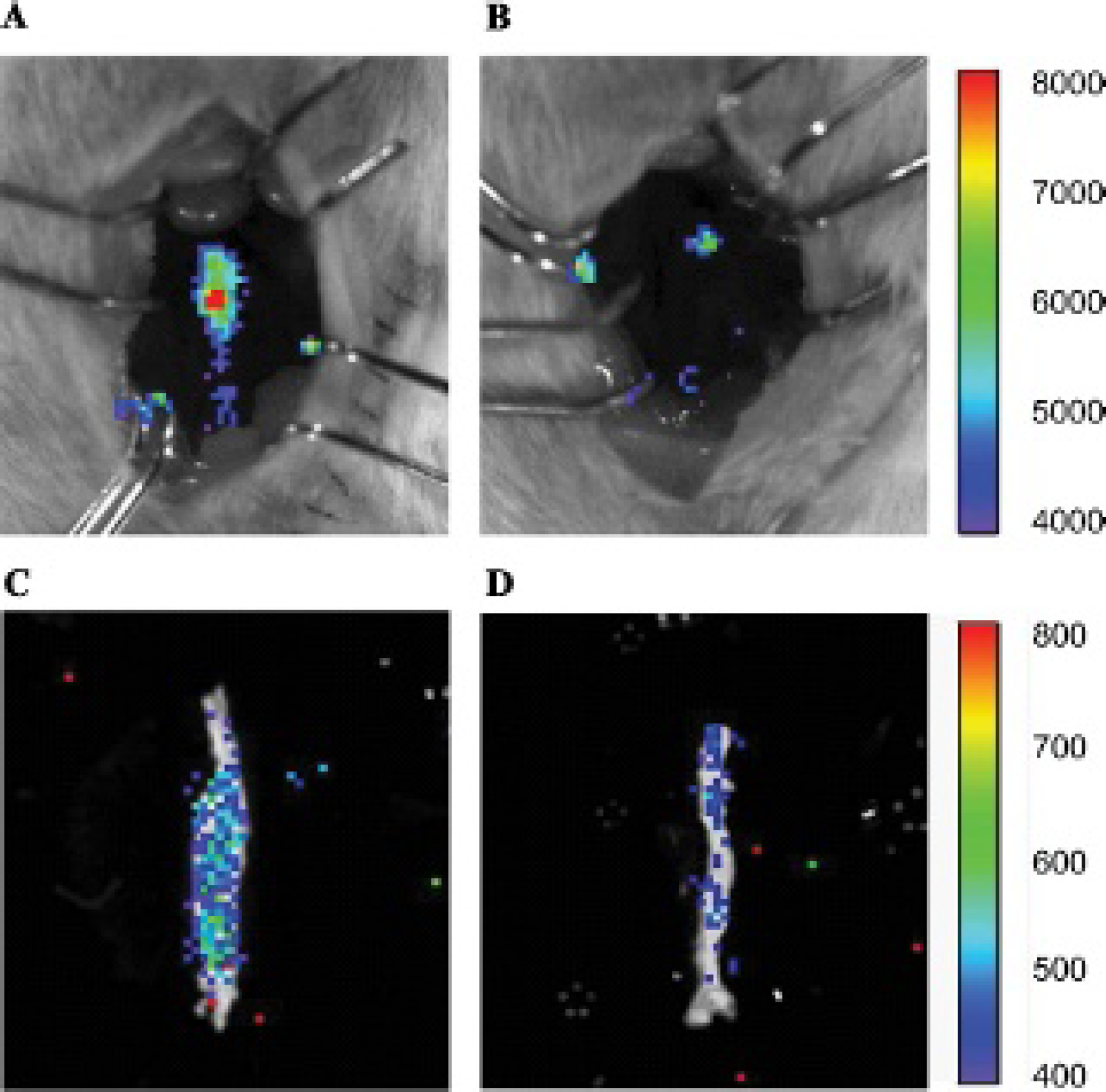
Representative in situ (top) and ex vivo (bottom) bioluminescent images at day 14 of abdominal aortic aneurysm (A, C) and sham (B, D) mice. Scale is photon/s/cm2/sr.

A, Signal intensity of abdominal aortic aneurysm (AAA) mice (n = 17 total; n = 5/6/6 for days 3/7/14, respectively) compared to sham mice (n = 15 total; n = 5/5/5 for days 3/7/14, respectively). AAA signal was significantly increased at 7 and 14 days; *p < .05 AAA versus sham. B, Significant positive correlation between bioluminescent imaging (BLI) signal intensity and aortic diameter in AAA mice from A (n = 17). Note that the x-axis was placed at the level of background BLI signal for reference (see text).
The total number of macrophages stained with MAC-2 antibody, which includes host macrophages and injected peritoneal macrophages, was positively correlated with the SI measured with BLI (n = 12, r = .62, p < .05; Figure 5A). IHC staining with GFP antibody revealed GFP-positive injected peritoneal macrophages within the aneurysm wall that colocalized to areas of macrophage accumulation by MAC-2 antibody (Figure 5B).

A, Significant positive correlation between bioluminescent imaging signal intensity and the number of MAC-2-stained cells (including host and transplanted macrophages) in abdominal aortic aneurysm (AAA) mice (n = 12 total; n = 2/4/6 for days 3/7/14, respectively). B, Immunohistochemistry with anti-GFP antibody (left) for injected peritoneal macrophages (arrows) and anti-MAC-2 antibody (right) for total (host and peritoneal) macrophages (× 400 original magnification). CSA = cross-sectional area.
In Vitro Iron Oxide Labeling of Macrophages
In vitro labeling data showed a positive correlation between iron oxide concentration and positive Prussian blue staining of peritoneal macrophages (n = 8, r = .93, p < .01; Figure 6, A and B). The percentage of iron-positive macrophages at an incubation concentration of 150 µg Fe/mL did not substantially differ compared to 200 µg Fe/mL (90.3% vs 90.2%). Therefore, the 150 µg Fe/mL incubation concentration was used for all in vivo MRI experiments. In vitro MRI of labeled peritoneal macrophages in serial 1:2 dilutions demonstrated the expected cell number–dependent decrease in SI with T2-weighted imaging (Figure 6C).
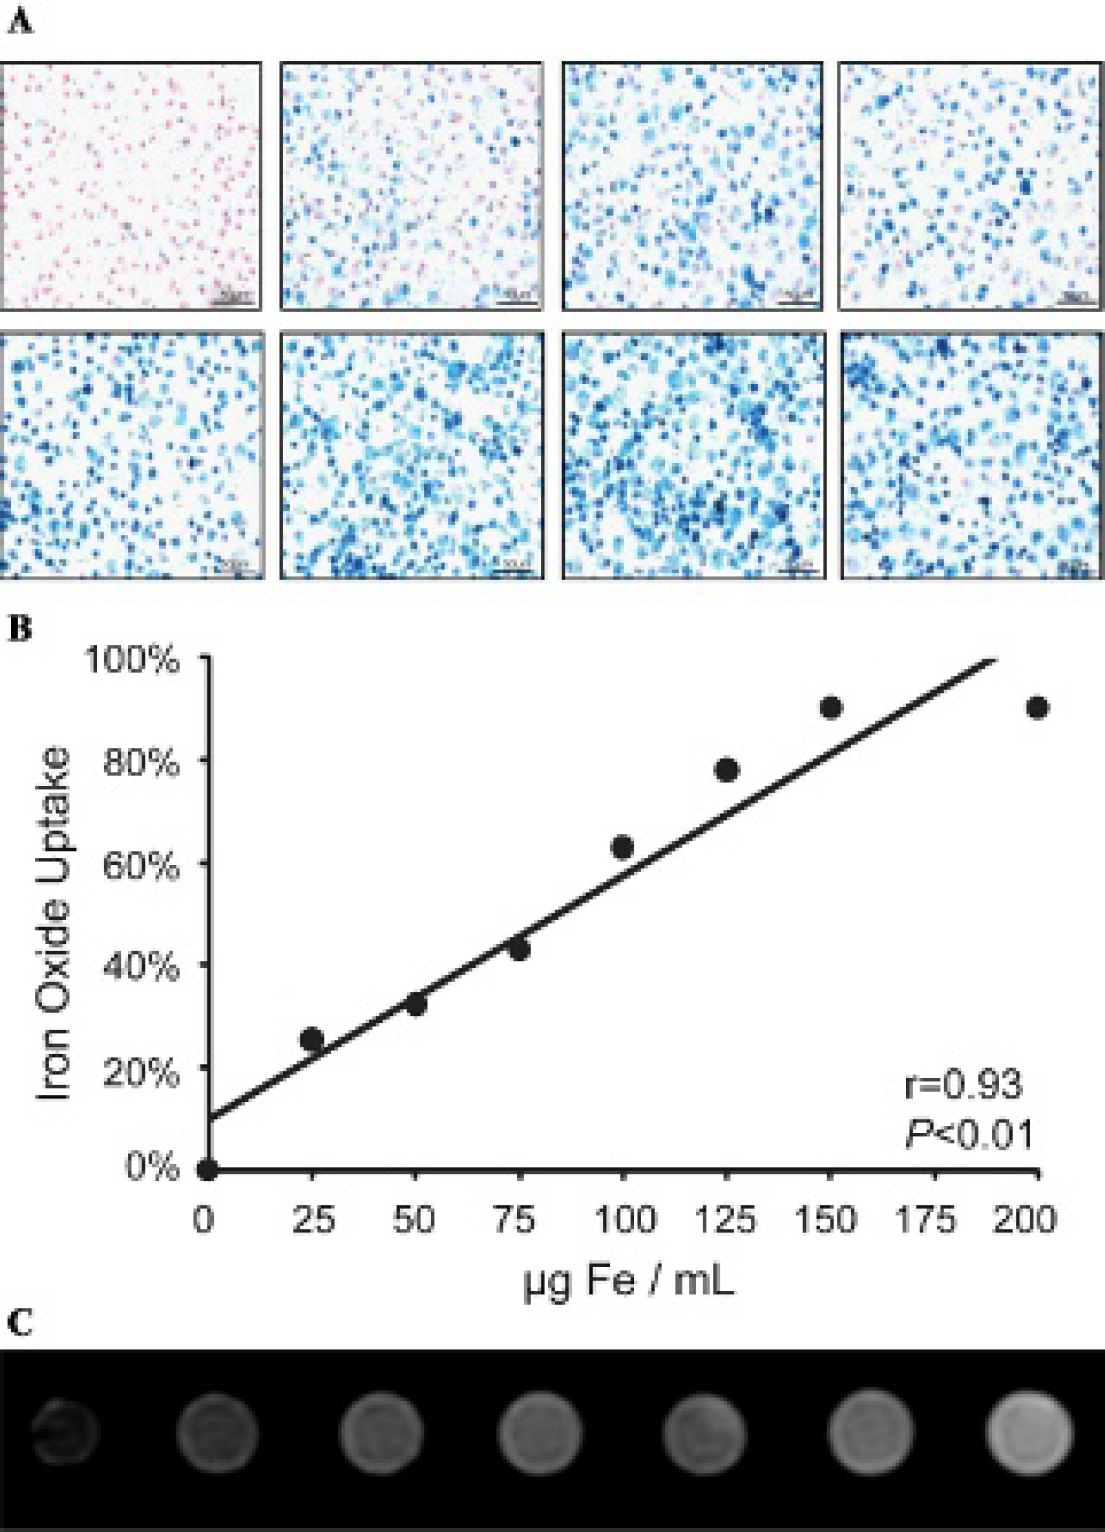
A, Prussian blue staining of in vitro peritoneal macrophages after incubation with increasing concentrations of iron oxide particles (×400 original magnification). Top row (left to right): 0, 25, 50, 75 µg Fe/mL; bottom row (left to right): 100, 125, 150, and 200 µg Fe/mL. B, Positive correlation between incubation concentration of iron oxide particles and the percentage of Prussian blue–stained peritoneal macrophages. C, In vitro T2-weighted magnetic resonance imaging of macrophage cell dilutions labeled with 150 µg Fe/mL showing signal loss from (left to right) 3 × 10⁶ cells, 1.5 × 10⁶ cells, 7.5 × 10⁵ cells, 3.75 × 10⁵, 18.75 × 10⁴, to 9.4 × 10⁴ cells compared to vehicle (phosphate-buffered saline only, far right).
In Vivo MRI
At 24 hours postinjection of iron oxide–labeled peritoneal macrophages, AAA mice injected with labeled macrophages (AAA + MΦ, n = 5) demonstrated areas of SI decrease on T2*-weighted GRE images (Figure 7) compared to both sham mice (sham + MΦ, n = 5) and AAA mice injected with free iron oxide solution (AAA + control, n = 3). The mean aortic diameter in AAA mice (n = 8) was significantly larger compared to that in sham mice (n = 5) at POD 14 (AAA: 1.26 ± 0.01 vs sham: 0.79 ± 0.01 mm; p < .01). Quantitative analysis (see Figure 7E) showed that the relative SI of the infrarenal aorta in the AAA + MΦ mice decreased by 43% after macrophage injection (preinjection: 1.51 ± 0.04 vs postinjection: 0.87 ± 0.05, p < .01). In comparison, there was no significant change in the relative SI of the infrarenal aorta postinjection in either the sham + MΦ mice or the AAA + control mice. The percentage of signal loss postinjection was significantly greater for AAA + MΦ compared to sham + MΦ and AAA + control (p < .01 for both). Iron oxide–labeled injected peritoneal macrophages within the AAA wall were confirmed by Prussian blue and MAC-2 staining (Figure 8).

Comparison of axial magnetic resonance images pre- (A, B) and postadministration (C, D) of iron oxide–labeled macrophages in an abdominal aortic aneurysm (AAA) mouse. Susceptibility effects are noted at 24 hours postinjection within the AAA wall with decreased signal intensity (arrows). E, Comparison of T2* signal loss for the three cohorts. *p < .01 AAA + mΦ versus other groups. MΦ = iron oxide–labeled macrophages; control = free iron oxide particles.

Immunohistochemistry (400× original magnification) for (A) Prussian blue stain of injected labeled macrophages (arrows) in spleen (positive control), (B) Prussian blue stain of injected labeled macrophages (arrows) in the adventitia of abdominal aortic aneurysm (AAA) mice, and (C) MAC-2 staining of same section in AAA for total macrophages (host and injected).
Discussion
Our study demonstrated macrophage homing to experimental AAAs by cellular imaging, with BLI and MRI providing complementary imaging approaches. BLI tracked macrophage accumulation in AAAs, with a significant increase in signal intensity after 7 days, which correlated with macrophage number and aortic diameter. MRI noninvasively detected macrophage homing to AAAs 1 day after injecting labeled macrophages, not seen in sham controls or with free iron particle injection.
Inflammation is a critical factor in AAA development and progression.17–19 In vivo imaging of macrophage trafficking to AAA may help study this biology. We believe this is the first study to image macrophage homing to experimental aortic aneurysm disease, with BLI showing a multiday delay in accumulation and MRI showing active homing (within 24 hours) still present at 14 days.
We used the well-established PPE-infusion experimental model of AAA disease.20,21 It results in an initial aortic enlargement owing to pressure perfusion and elastin degradation, followed by a delayed onset of inflammation with further expansion up to 14 days. Our data showed the initial enlargement by ultrasonography at day 3, with macrophage trafficking to the AAA by BLI not significantly increased until day 7 and persisting at day 14. FVB mice were required for BLI experiments, but we did not see any systematic strain differences in AAA development with this model. In both the BLI and MRI experiments, histologic evidence of injected peritoneal macrophages was identified in the adventitia. We have previously demonstrated in the PPE model that macrophage accumulation increases over the 2-week course of aneurysm growth and is most pronounced in the adventitia.3,22,23 This appears to be the primary site of inflammation in AAA disease, in both humans and animal models.24,25 AAA development involves smooth muscle cell apoptosis and proteolytic degradation of the ECM of the media, resulting in outward localization of inflammation, edema, and neoangiogenesis in the adventitia. Macrophage recruitment is a complex process involving margination, upregulation of vascular adhesion, extravasation, and local activation of circulating leukocytes into the vessel wall through secretion of inflammatory cytokines and chemokines such as macrophage chemoattractant protein 1 (MCP-1), interleukin-6 (IL-6), and tumor necrosis factor (TNF)-α.3,22,26,27 As this study focused on imaging macrophage migration to AAAs, we do not have information about macrophage function. We have previously demonstrated that increased macrophage accumulation within the PPE aneurysm model is associated with ECM-degrading matrix metalloproteinases (MMPs), production of vascular endothelial growth factor (VEGF), and adventitial neovessel formation, contributing to aortic remodeling and dilatation. 23
BLI relies on continued gene expression (eg, luciferase), so it is advantageous in that it detects viable macrophages. 28 BLI has high sensitivity near the surface of small animals but is limited by tissue depth. 29 The retro-peritoneal location of the abdominal aorta made noninvasive BLI challenging, so laparotomy was performed to allow in situ exposure. In addition, there was background BLI signal present even with no luc+/GFP+ peritoneal macrophages delivered.
MRI has advantages in being fully noninvasive and providing both structural and cellular imaging of vascular disease, 30 including AAA.31,32 The use of superparamagnetic iron oxide (SPIO) or ultrasmall superparamagnetic iron oxide (USPIO) particles is a well-studied MRI approach to cellular imaging.16,33,34 The larger SPIO particles have typically shown greater T2* effect with in vitro cell labeling and so are commonly used in cell delivery studies, 35 including bone marrow cell trafficking to murine atherosclerosis. 34 USPIO particles, on the other hand, typically have a longer circulation time and so have been used to study in vivo uptake by vascular macrophages. 36 Both SPIO and USPIO particles are extensively taken up by the reticuloendothelial system (RES). Turner and colleagues recently used intravenous delivery of USPIO particless to assess AAA inflammation in the apolipoprotein E–deficient mouse infused with angiotensin II, a model characterized by dissection followed by subsequent pseudoaneurysm and thrombus formation. 32 They found T2* signal loss near the region of dissection but acknowledged that susceptibility artifacts from USPIO accumulation in the RES contaminated the images, which we have observed using USPIO particles in the elastase AAA model (data not shown). In this study, we employed direct macrophage labeling with SPIO particles to track macrophage homing to AAA and minimize RES-related artifacts.
A limitation to the study is that we used macrophages from peritoneal lavage as collecting circulating monocytes or macrophages is challenging. In addition, the cell number injected was supraphysiologic to enable imaging of accumulation in small vessel walls. The in vitro SPIO labeling studies reported with peritoneal macrophages were also performed using the murine macrophage cell line RAW264.7 for comparison and demonstrated similar labeling efficiencies (data not shown). Although we did not measure the cell viability of SPIO-labeled peritoneal macrophages in our experiments, previous studies at our institution have assessed the in vitro cytotoxicity of Feridex in RAW264.7 cells and found that cell viability was maintained across incubation concentrations of 0.4 to 250 µg Fe/mL. 37 A limitation to the MRI approach of using iron oxide particles is that the T2* effect does not depend on cell viability and USPIO and SPIO particles can become diluted or redistributed as cells divide or die. Thus, over time, the T2* signal loss becomes a less reliable indicator of current macrophage burden. This is why we used MRI to study short-term (24 hour) homing of macrophages to AAA. The control animals injected with free iron oxide particles also helped confirm that the MRI signal change was from labeled macrophages, not from iron oxide particles that had escaped into the circulation. A recent clinical study did use intravenous infusion of Feridex in 15 AAA patients and detected uptake after 1 hour by MRI in the luminal thrombus, which correlated with inflammatory cells and MMP levels in the thrombus. They did not detect signal changes in the AAA wall but acknowledged that iron oxide contrast agents with different pharmacokinetics may be needed to allow AAA wall inflammation detection in the clinical setting. 38
Conclusion
We used BLI and MRI to examine macrophage infiltration during experimental AAA development. In these complementary modalities, exogenous macrophages were imaged homing to the aortic wall following aneurysm induction. A combined imaging approach may provide a comprehensive biologic and anatomic assessment of AAA progression, with the potential to assess rupture risk and guide future therapy for AAA disease.
Footnotes
Acknowledgments
We acknowledge Drs. Eiketsu Sho and Mien Sho for their assistance with histologic analysis.
Financial disclosure of authors: This work was supported in part by National Institutes of Health grants R01 HL064338 and R01 HL078678 and a research fellowship from the Sumitomo Welfare Foundation. Dr. McConnell's laboratory receives MRI research support from GE Healthcare, and he is on a Kowa, Inc. scientific advisory board. Dr. Terashima has received honoraria from FujiFilm and Philips Japan. Dr. Dalman's laboratory receives AAA research support from Medtronic AVE and Carolus Pharmaceuticals. The Division of Vascular Surgery receives research and/or educational support from Medtronic, W. L. Gore and Associates, Cook Medical, and Endologix Inc.
Financial disclosure of reviewers: None reported.