
Abstract
The cell response to proteotoxic cell stresses is mediated primarily through activation of heat shock factor 1 (HSF1). This transcription factor plays a major role in the regulation of the heat shock proteins (HSPs), including HSP70. We demonstrate that an [124I]iodide-pQHNIG70 positron emission tomography (PET) reporter system that includes an inducible HSP70 promoter can be used to image and monitor the activation of the HSF1/HSP70 transcription factor in response to drug treatment (17-allylamino-demethoxygeldanamycin [17-AAG]). We developed a dual imaging reporter (pQHNIG70) for noninvasive imaging of the heat shock response in cell culture and living animals previously and now study HSF1/HSP70 reporter activation in both cell culture and tumor-bearing animals following exposure to 17-AAG. 17-AAG (10–1,000 nM) induced reporter expression; a 23-fold increase was observed by 60 hours. Good correspondence between reporter expression and HSP70 protein levels were observed. MicroPET imaging based on [124I]iodide accumulation in pQHNIG70-transduced RG2 xenografts showed a significant 6.2-fold reporter response to 17-AAG, with a corresponding increase in tumor HSP70 and in tumor human sodium iodide symporter and green fluorescent protein reporter proteins. The HSF1 reporter system can be used to screen anticancer drugs for induction of cytotoxic stress and HSF1 activation both in vitro and in vivo.
HSPs are required for many basic cell functions, including appropriate protein folding during polypeptide-chain synthesis, translocation of proteins across membranes, and normal protein turnover. The importance of HSPs to cell maintenance is reflected in their abundance. For example, HSP90 accounts for ≈1 to 2% of total cellular protein in normal cells under nonstressed conditions. 7 In the presence of biochemical and physical stress, the amount of HSP90 in the cell has been shown to increase proportionate to the severity of the stress and prevent cell death by inhibiting cell protein aggregation and directly antagonizing multiple cell death pathways. 8
However, the heat shock response has a detrimental as well as a beneficial effect on living organisms. The detrimental effects include stabilization of mutated, damaged, and misfolded proteins (eg, cancer and neurodegenerative diseases) and chaperone support for aberrant cell growth (eg, cancer). High levels of HSPs are a hallmark of the cancer cell. HSP90 is expressed at 2- to 10-fold higher levels in tumor cells compared to their normal counterparts, suggesting that it could be crucially important for the growth and/or survival of tumor cells. 9 For example, in cervical cancer, basal levels of HSP70 are 8- to 12-fold higher in high-grade (T3–T4) disease compared to normal cervix tissue. 10 HSP70 and the heat shock factor 1 (HSF1) transcription factor have been shown to be closely associated with tumorigenesis, the transition to a more malignant phenotype, resistance to apoptosis, and a poor clinical prognosis.11–22 Overexpression of HSP70 and HSP90 correlates with poor prognosis in breast cancer,23,24 and overexpression of HSP70 and HSP27 may contribute to drug resistance.25–27
In this report, we focus on the ability of our inducible HSF1/HSP70 reporter system to monitor the response (activation) of the HSF1 transcription factor following treatment with the geldanamycin analogue 17-allylamino-demethoxygeldanamycin (17-AAG). 17-AAG inhibits the association of HSP90 with HSF1, thereby releasing and activating the transcription factor for binding to HSF1-sensitive promoter elements of target genes. We show that this robust
Materials and Methods
pQHNIG70 Retroviral Vector and Establishment of RG2-pQHNIG70 Cell Lines
The previously described self-inactivating retroviral vector termed pQHNIG70 contained a
17-AAG Effects In Vitro
To assess the effect of 17-AAG on the growth of RG2-pQHNIG70 cells in culture, the number of cells in the culture plates was assayed over time by direct cell counting. RG2-pQHNIG70 cells were seeded at a density of 1 × 10⁵ cells/cm2 in six-well plates and cultured for 24 hours in Minimum Essential Medium (MEM) supplemented with 10% calf serum, 100 U/mL penicillin, and 100 U/mL streptomycin. The cells were then treated with 17-AAG at 10, 30, 100, 300, and 1,000 nM. After incubation for 6, 12, 24, 36, 48, 60, and 72 hours, they were washed with phosphate-buffered saline (PBS), harvested by mild trypsinization, and counted with a hematocytometer. Experiments were performed in triplicate, and three different experiments were performed for each experimental condition. The resultant cell growth profiles were subject to Gompertz analysis.
50% Effective Concentration Comparison for 17-AAG
Fifty percent effective concentration (EC50) cell viability studies of 17-AAG were performed using a WST-1 proliferation assay as previously described.
29
Briefly, cells were seeded on 96-well microplates (4,000 cells/well; eight wells/treatment dose) and incubated with 17-AAG over a wide dose range for 72 hours. WST-1 (a cell viability reagent) was added to each well, and optical absorbance was determined after a 4-hour reaction period at a wavelength of 562 nm with an enzyme-linked immunosorbent assay (ELISA) reader. Absorbance of control (untreated) cells was taken as the 100% value; EC50 values were calculated using
eGFP Assays
For FACS analysis, 2 × 10⁴ cells were resuspended in PBS supplemented with 10% fetal bovine serum. Cells were analyzed with a FACScan cytometer equipped with a 15 mW, air-cooled, 488 nm argon-ion laser (FACSCalibur, Becton Dickinson). In each measurement, 10,000 cells were analyzed. The level of eGFP fluorescence, percentage of fluorescent cells, in the histograms was determined from [M3/(M1 + M2 + M3)] × 100. Subcellular localization of the eGFP protein in transduced tumor cells was visualized by fluorescence microscopy using a Nikon Eclipse T-100 (Morrel, CT) microscope and similar excitation and emission parameters as described above for FACS.
Immunostaining and Western Blotting
Localization of hNIS protein in RG2-pQHNIG70 cells was determined by in situ immunocytochemical analysis of cell cultures grown on chamber slides (Lab-Tek II Chamber, Nalge Nune International, IL) as previously described. 30 For immunostaining of RG2-pQHNIG70 and wild-type mouse xenografts, tissue was fixed in 10% formaldehyde and cut into 8 μm paraffin sections. Briefly, tissue sections were deparaffinized in xylene and rehydrated through graded alcohols to water. Endogenous peroxidase activity was quenched with 3% H2O2 in methanol. Slides were then incubated for 12 hours at 4°C with mouse monoclonal hNIS (MAB 3562, Millipore, Temecula, CA), eGFP (Chemicon, Temecula, CA) or rabbit polyclonal hHSP70 antibodies (Stressgen Biotechnologies Corporation, Victoria, BC) reacting with human, mouse, rat, bovine, monkey, and pig protein, which were conjugated with horseradish peroxidase (DakoCytomation, Carpinteria, CA). Staining was developed with diaminobenzidine (DakoCytomation). Tissue sections were dehydrated through graded alcohols to xylene before mounting. Western blotting was performed as previously described. 28
Radiotracer Experiments
[131I]iodide and [99mTc]pertechnetate uptake in RG2-pQHNIG70 and RG2 wild-type cells was measured using a modification of methods previously described. 28 Briefly, RG2-pQCNIG70 and RG2 cells ≈5–10 × 105 cells/mL, 20 mL volume were seeded onto 15 cm dishes. Following a 24-hour period of incubation at 37°C with 5% CO2, the cells were exposed to different concentrations of 17-AAG for 24 hours. In preparation for the radiotracer uptake study, the culture medium was aspirated and the cells were washed with PBS (pH 7.4). The iodide and pertechnetate uptake studies were initiated by adding 15 mL of MEM containing 0.01 μCi/mL (0.37 kBq/mL) Na131I (NEN-Perkin Elmer, Shelton, CT; specific activity > 5 Ci/mg, 185 GBq/mg) and 0.1 μCi/mL (3.7 kBq/mL) 99mTcO4− (Nuclear Diagnostic Products, Rockaway, NJ; specific activity ≈1 Ci/mg, 37 Gbq/mg). The cells were incubated with Na131I and 99mTcO4− for 10 minutes (37°C, 5% CO2), which was previously shown to be the time when tracer uptake reaches a maximum level. 30 Cells were harvested and centrifuged. Radioactivity measurements of both cells and medium were made using a gamma counter (Auto-gamma 5000 Series Gamma Counter, Packard Instrument Company, IL) set up for dual 99mTc and 131I counting. All experiments were done in triplicate and repeated at least twice. Cell-to-medium radioactivity concentration ratios (cpm/g cells ÷ cpm/mL medium) were calculated.
In Vivo Imaging
MicroPET imaging experiments were performed in two groups (17-AAG treatment and saline-treated control) of six mice, each bearing three xenografts: a test RG2-pQCNIG70 xenograft (left shoulder), a positive control RG2-pQCNIG xenograft 30 (right shoulder), and a negative control, wild-type RG2 tumor (right thigh). Twenty-four hours following intraperitoneal administration of 17-AAG (150 mg/kg in 200 μL of lecetin solvent 21 ) to the animals in the treatment group and after an equal volume of normal saline to the control group, 0.1 mCi of no-carrier-added [124I]iodide was injected intravenously. Image acquisition was performed on an R4 microPET II (Concorde Microsystems, Knoxville, TN); a single 10-minute frame was acquired 120 minutes after radiotracer injection. The images were reconstructed using the filtered backprojection algorithm provided by Concorde Microsystems. Standard orthogonal projections were used to analyze the images, obtain the level of radioactivity in the xenografts, and select the optimal slices for presentation. The accumulation of the radiotracer (124I) in RG2-pQCNIG70, RG2-pQCNIG, and RG2 xenografts of the 17-AAG treatment group was compared to the corresponding signals in saline-treated control xenografts.
Statistics
Values are the mean ± SD of these experiments where noted. Significance between experimental values was determined by
Results
17-AAG Effects on RG2-pQHNIG70 Cells in Culture
RG2 glioma cells stably transduced with the inducible HSF1 reporter (RG2-pQHNIG70) were treated with increasing concentrations of 17-AAG, and the growth profile was determined over 72 hours. The profiles show a time and concentration dependence of growth arrest (Figure 1A). The data fitted to the Gompertz equation 31 indicate that 17-AAG growth inhibition occurred in the later phase of treatment, which is reflected in the Gompertz coefficients (Table 1).

Growth profile of RG2-pQHNIG70 cells (A). A 17-AAG concentration-dependent inhibition of RG2-pQHNIG70 cell growth is shown. The growth profiles were fitted to the Gompertz equation.
31
Induction kinetics of green fluorescent protein (GFP) expression (B and C). RG2-pQHNIG70 cells were exposed to 17-AAG for 24 hours at the indicated concentrations, and GFP intensity was assessed by FACS analysis and fluorescence microscopy at the indicated times (B). The percentage of GFP(+) cells in the M3 region of the FACS profiles shown in B was determined (C). Values represent the mean ± SD (
Gompertz Coefficients of 17-AAG-Induced Growth Inhibition of In Vitro Tumor Cell Line Tissue Cultures

Cell number = 105*exp((M1/M2)*(1–exp(–M2*t))).
Expression of eGFP in RG2-pQHNIG70 Cells
To assess the induction of the human HSP70 promoter in response to 17-AAG treatment, RG2-pQHNIG70 cells were exposed to different concentrations of 17-AAG in the medium over different periods of time. Cells expressing eGFP reporter protein were identified by FACS analysis and fluorescence microscopy (Figure 1B). Background levels of reporter cells in stably transduced cells were slightly higher compared to the wild-type cells, which likely reflected transfection-related cell stress. 17-AAG induced a dose- and time-dependent expression of eGFP (Figure 1C). A slight increase in eGFP was observed at 6 hours in the cells exposed to 300 and 1,000 nM 17-AAG. Following 24- to 72-hour exposure, all 17-AAG concentrations induced reporter expression. The maximum eGFP expression was observed after 60 hours' exposure to 17-AAG. This level of expression was 23-fold above control levels (nontreated).
Induction of hNIS Reporter Expression and Endogenous HSP70 in RG2-pQHNIG70 Cells
To examine whether 17-AAG treatment induces the hNIS transporter in RG2-pQHNIG70 cells, immunocytochemical analysis for hNIS protein was performed. Figure 1D shows a strong plasma membrane–associated hNIS-specific immunoreactivity following 24-hour exposure to 100 and 1,000 nM of 17-AAG. A weak immunoreactivity was observed in RG2-pQHNIG70 cells exposed to 10 nM 17-AAG. Nontreated RG2-pQHNIG70 cells stained with hNIS antibody showed low (background) levels of staining in all cells. To examine whether the increases in hNIS immunoreactivity and eGFP fluorescence in 17-AAG-treated RG2-pQHNIG70 cells reflect inducible HSP70 protein expression, immunoblotting was also performed. Immunoblot analysis showed increases in the amount of a 70 kDa protein after 24 hours of 17-AAG treatment in a dose-dependent manner (Figure 1E).
Radiotracer Uptake in RG2-pQHNIG70 Cells after 17-AAG Treatment
To examine whether 17-AAG treatment induces the expression of a functional hNIS transporter in RG2-pQHNIG70 cells, radiotracer (99mTcO4− and 131I-iodide) uptake experiments were performed (Figure 1F). In these studies, uptake was assessed at 10 minutes, based on the results of previous experiments. 28 A dose-dependent increase in tracer uptake was observed from 30 to 1,000 nM of 17-AAG (see Figure 1F). These results also show a threefold higher uptake (cell/medium ratio) of 99mTcO4-pertechnetate compared to that obtained with 131I-iodide, confirming our previous observations. 28 It was also noted that tracer uptake was slightly higher in pQHNIG70-transduced cells compared to nontransduced RG2 cells in the absence of 17-AAG; this difference was approximately twofold for 131I-iodide and fourfold for 99mTcO4−.
Correspondence of Radiotracer Uptake, eGFP Fluorescence, and HSP70
A linear correlation was observed between radiotracer accumulation and fluorescence in RG2-pQHNIG70 cells exposed to different levels of 17-AAG for 24 hours, indicating a comparable readout of the dual reporter system in the presence of 17-AAG (Figure 2A). Both radiotracer accumulation and eGFP fluorescence correlated with HSP70 induction following 24 hours' exposure to different levels of 17-AAG (Figure 2, B and C, respectively).

Relationship between iodide and pertechnetate uptake with respect to HSP70 and eGFP fluorescence of RG2-pQHNIG70 cells (A and B). The results shown in A compare the data presented in Figure 1, B and F; the regression equation for iodide (solid squares) was y = 0.83 + 0.12×,
Imaging the Response of RG2-pQHNIG70 Xenografts to 17-AAG
To assess the HSF1-mediated induction of the HSP70 promoter in response to 17-AAG treatment in animals, two sets of animals bearing RG2-pQHNIG70, RG2-pQCNIG, 30 and RG2 xenografts were studied. One set of animals was treated with 17-AAG (150 mg/kg IP), and the other set was treated with normal saline. MicroPET images of [124I]-iodide uptake were obtained 24 hours later. The images of representative animals from 17-AAG-treated and normal saline control groups are shown in Figure 3A; a corresponding photograph outlining the locations of the xenographs is also shown. A comparison of the images shows upregulation of reporter expression in the RG2-pQHNIG70 xenograft in response to 17-AAG treatment. The positive and negative control xenografts were unaffected by 17-AAG treatment. The postimaging radioactivity measurements in the xenographs and in selected tissues are shown in Table 2. More than a sixfold difference was measured between 17-AAG-and saline-treated RG2-pQHNIG70 xenografts, respectively. For the RG2-pQCNIG positive control and the RG2 wild-type xenografts or other selected organs, no differences in tracer iodide uptake between the treatment and nontreatment groups were induced by 17-AAG treatment.
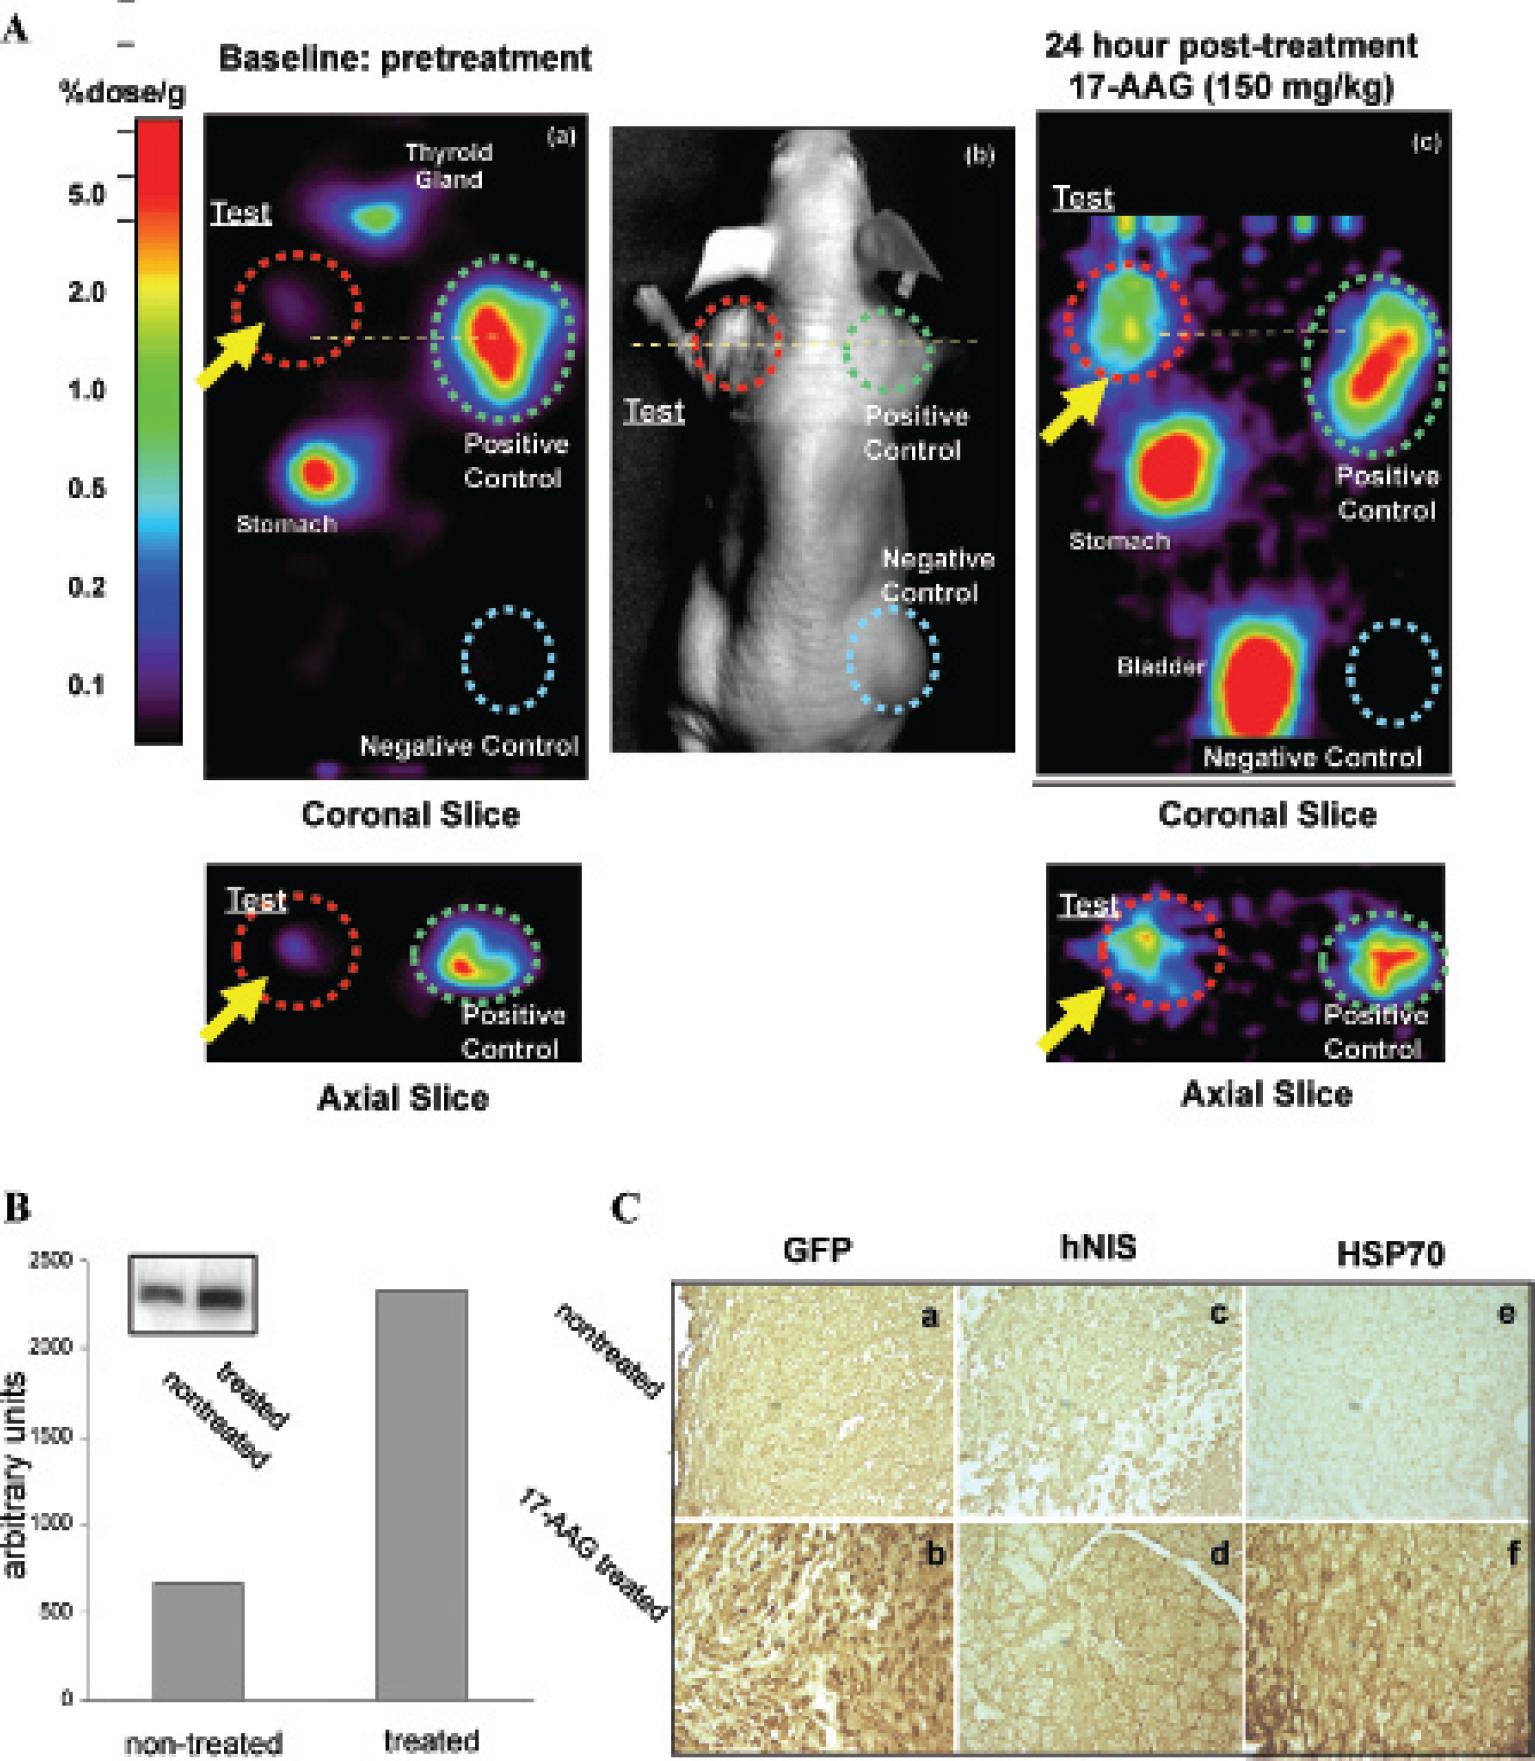
([124I]-iodide microPET imaging of pQHNIS70 xenografts (A). The coronal and axial microPET images of [124I]-iodide uptake in a representative nontreated (a) and 17-AAG-treated (c) animal are shown; a photograph (b) is also shown. The
Postimaging Radioactivity Measurements (% dose/g)
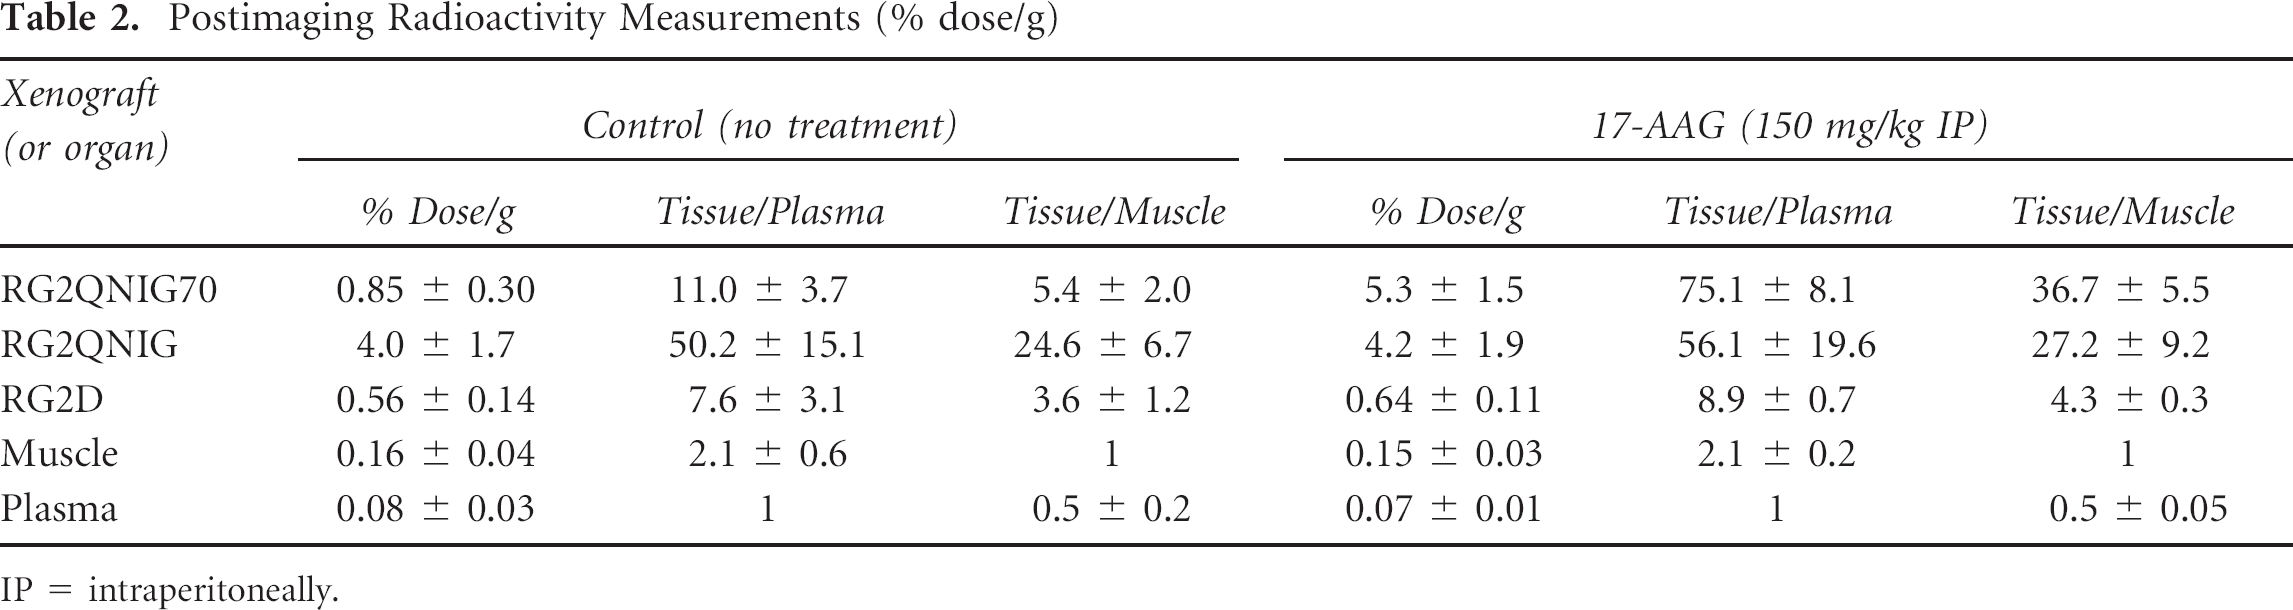
IP = intraperitoneally.
HSP70, hNIS, and eGFP Expression in RG2-pQHNIG70 Xenografts
Tissue was obtained for analysis 24 hours after IP administration of saline or 150 mg/kg 17-AAG. Inducible HSP70 protein expression following saline and 17-AAG treatment of animals bearing RG2-pQHNIG70 xenografts was also assessed by Western blotting (Figure 3B) and immunohistochemical analysis (Figure 3C). HSP70 protein in RG2-pQHNIG70 xenografts was expressed at low levels in nontreated animals. The level of HSP70 protein increased approximately fourfold following 17-AAG treatment. We also assessed hNIS and eGFP reporter protein by immunohistochemistry (see Figure 3C). Weak pancellular reactivity of HSP70 and eGFP was observed in the nontreated xenografts, whereas strong reactivity in the cytoplasm was detected in the xenografts 24 hours following 17-AAG administration. The predominantly cell membrane–associated hNIS-specific immunoreactivity was detected in RG2-pQHNIG70 xenografts of treated animals. In contrast, xenografts of nontreated animals showed only weak hNIS immunoreactivity.
Discussion
It is well established that transcription serves as a major regulatory mechanism for the heat shock response system. 2 HSF1 is activated through phosphorylation and trimerization in response to a variety of proteotoxic cell stresses, including heavy metal poisoning, 3 hypoxia, 4 cell differentiation, 5 carcinogenesis, 6 anticancer therapy, 11 and heat shock. 5 There is also emerging evidence for the HSP chaperone system contributing to tumorigenesis32,33 and that inhibition of HSP90 in combination with other drugs has synergistic antitumor effects.
The expression of
It should also be noted that transcriptional activation of the reporter system in this study provides only an indirect assessment of HSP90 status. The signal increase induced by 17-AAG is directly dependent on HSF1 activation (dissociation from HSP90) and the presence of a functional HSF1 transcription factor complex in the nucleus. By using a HSF1 response element (HSF1-RE) as an inducible promoter in our reporter system, we are able to detect regulation of HSF1dependent systems in cancer cells. The human HSF1-RE (promoter) and the human
In the current study, we were able to visualize HSF1 activation-specific accumulation of the radiotracer following treatment with 17-AAG in both reporter-transduced cells and xenografts. A sixfold difference was measured between 17-AAG- and saline-treated animals bearing RG2-pQHNIG70 xenografts. These results demonstrated that the HSF1/HSP70 reporter system can provide high levels of hNIS and eGFP expression in RG2-pQHNIG70 cells after exposure to 17-AAG. Despite a previously reported observation that 17-AAG can nonspecifically induce uptake of the radioiodide, 35 we did not observe any increase in radiotracer uptake in wild-type cells or in wild-type xenografts or specific organs between control and 17-AAG treatment groups.
There are recognized pharmacologic deficiencies associated with 17-AAG. The off-target hepatotoxicity, poor solubility making formulation difficult, and limited oral bioavailability have generated significant interest in the development of new small-molecule HSP90 inhibitors with improved pharmacologic properties and oral bioavailability.35,36 In phase I studies, 17-dimethylaminoethylamino-17-demethoxygeldanamycin (17-DMAG) appeared to be more toxic than 17-AAG. 37 Other newly developed HSP90 inhibitors, such as CNF-1010 and KOS-953, and the purine scaffold agents CNF-2024, PU-H71, and PU-D28, do not share the same toxicity profile. 38 An HSF1 reporter system could be applied in screening a broad spectrum of anticancer drugs, not only those whose targeted pathways are dependent on HSP chaperone systems, such as the response to inhibition of HSP90 by 17-AAG that was imaged in the current study, but also others that activate proteotoxic stress-inducing systems.
Understanding the molecular mechanisms of HSP and signaling pathway regulation establishes the rationale for use of HSP inhibitors in combination therapy. For example, it has been shown that combinations of HSP90 inhibitors and specific drugs induce synergistic growth arrest and cell death.39–42 However, testing the regulatory mechanisms responsible for the synergy of cisplatin and geldanamycin revealed that cisplatin suppresses upregulation of HSF1 transcription, causing decreased levels of stress-inducible proteins such as HSP27 and HSP70, as well as inhibiting DNA binding of HSF1. 43 Alternatively, 17-AAG-mediated induction of HSP70 and HSP27 expression can result in chemoresistance, but this effect could be attenuated by actinomycin D. 44
An alternative approach would be to combine HSP90 inhibitors with HSF1-targeted treatment. So far, quercetin and triptolide are the only specific inhibitors of HSF1 that have been reported.45,46 In cell culture systems, quercetin has been shown to inhibit downstream signaling following HSF1 activation. 45 The potential benefits from combining a HSP90 inhibitor with a HSF1 inhibitor have yet to be explored. However, there is also another important consideration limiting potential systemic use of HSF1 inhibitors in the clinic. Although HSF1 downregulation does not have a direct cytotoxic effect on normal cells in vitro, 6 its protective role in ischemic disease and neurodegenerative disorders has been clearly demonstrated.47,48 Specific preclinical toxicity studies, incorporating animal models of ischemic and neurodegenerative disease, will be required before HSF1 inhibitors can be administered in phase 1 studies to patients with cancer.
An HSF1 responsive reporter system could facilitate the development of HSP90 and HSF1-targeted treatment approaches in preclinical animal studies. With the increasing clinical role and indications for HSP system inhibitors, noninvasive imaging tools to monitor the heat shock response system have become important at the preclinical stage of drug development and testing in animal models and in clinical monitoring and follow-up.
Footnotes
Acknowledgments
We thank Drs. Steven Larson and Pat Zanzonico (Memorial Sloan-Kettering Cancer Center) for their help and support.
Financial disclosure of authors: This work was supported by National Institutes of Health grants P50 CA86438, R24 CA83084, and PO1 CA59350 and Department of Energy grant FG03-86ER60407.
Financial disclosure of reviewers: None reported.