
Abstract
The introduction of neural stem cells into the brain has promising therapeutic potential for the treatment of neurodegenerative diseases. To monitor the cellular replacement therapy, that is, to determine stem cell migration, survival, and differentiation, in vivo tracking methods are needed. Ideally, these tracking methods are noninvasive. Noninvasive tracking methods that have been successfully used for the visualization of blood-derived progenitor cells include magnetic resonance imaging and radionuclide imaging using single-photon emission computed tomography (SPECT) and positron emission tomography (PET). The SPECT tracer In-111-oxine is suitable for stem cell labeling, but for studies in small animals, the higher sensitivity and facile quantification that can be obtained with PET are preferred. Here the potential of 2′-[18F]fluoro-2′-deoxy-D-glucose ([18F]-FDG), a PET tracer, for tracking of neural stem cell (NSCs) trafficking toward an inflammation site was investigated. [18F]-FDG turns out to be a poor radiopharmaceutical to label NSCs owing to the low labeling efficiency and substantial release of radioactivity from these cells. Efflux of [18F]-FDG from NSCs can be effectively reduced by phloretin in vitro, but inhibition of tracer release is insufficient in vivo for accurate monitoring of stem cell trafficking.
CELLULAR REPLACEMENT THERAPY with (genetically modified) neural stem cells (NSCs) provides a promising tool for treating central nervous system disorders as NSCs have been shown to migrate to sites of cerebral pathologies, such as lesion sites in multiple sclerosis, Parkinson disease, ischemic infarcts, and intracranial gliomas.1–4 Different routes of administration of NSCs, including intrastriatal, intraventricular, and intravascular injections, have been examined.5–7 Burnstein and colleagues showed in a rat model of Parkinson disease that expanded human neural progenitor cells after transplantation into the substantia nigra show survival up to 12 weeks posttransplantation and differentiation of some cells into neurons, yet without significant behavioral recovery. 1 However, NSCs engineered to express a cytosine deaminase suicide gene were shown to significantly reduce tumor mass in glioma-bearing mice following administration of the prodrug 5-fluorocytosine, 5 and Benedetti and colleagues showed that interleukin-4-producing NSCs promote the survival time of glioma-bearing mice and rats, indicating the effectiveness of NSC replacement therapy. 8
Although after intravascular administration, relatively few cells reach the lesion site, when compared to intrastriatal and intraventricular administration, this route of administration is attractive for the delivery of NSCs to the brain as it obviates the need for invasive intracranial surgery. Recently, it was shown that inflammatory signals are the major attractants for NSCs. Scatter factor/hepatocyte growth factor (SF/HGF), fibroblast growth factor 2 (FGF-2), transforming growth factor a (TGF-a), and pleiotrophin (PTN) were found to be the strongest inducers of NSC migration toward gliomas, 9 whereas migration of NSCs was mediated by the chemokine CXCL12 in an in vivo model of multiple sclerosis. 2
Noninvasive and highly sensitive nuclear imaging techniques such as positron emission tomography (PET) and single-photon emission computed tomography (SPECT) have been applied for monitoring cell migration and localization in vivo.10–13 For nuclear imaging of cell migration, the cells need to be labeled ex vivo with a suitable radiopharmaceutical and injected in the patient. Outside the body, the distribution of the labeled cells can be followed by measuring the emitted radioactivity over time. Ex vivo labeling of cells with single photon–emitting radiopharmaceuticals such as [99mTc]HMPAO and [111In]oxine has been used to study cell migration of various cell types in vivo.14–21 In fact, [99mTc]HMPAO-and [111In]oxine-labeled white blood cells have been used in routine clinical practice for many years. 22 However, the intrinsic properties of PET theoretically make this method preferable over SPECT and planar scintigraphy because PET is characterized by a higher sensitivity and allows for a more accurate quantification.
In recent years, several publications have appeared on the successful monitoring of cell migration with PET, using various types of cells that were in vitro or ex vivo labeled with the glucose analogue 2′-[18F]fluoro-2′-deoxy- D-glucose ([18F]-FDG). For example, Rini and colleagues showed that sites of inflammation could be successfully visualized with PET using [18F]-FDG-labeled white blood cells. 12 Terrovitis and colleagues showed that [18F]-FDG-labeled cardiac stem cells could be tracked with PET after intramyocardial transplantation in the ischemic region of a rat heart. 23 Similarly, Zhang and colleagues used PET with [18F]-FDG-labeled human circulating progenitor cells to demonstrate the effect of collagen matrices on cell distribution after cell transplantation in an ischemic hind leg of a rat. 24 Thus far, nuclear imaging approaches have not been applied yet for monitoring NSC migration toward inflammatory sites in vivo.
Although Doyle and colleagues claimed that [18F]-FDG-labeled circulating progenitor cells could be successfully tracked, despite significant efflux of the tracer at 2 hours after labeling, 25 others showed that substantial efflux of FDG limits the technique. 26 We investigated the occurrence of [18F]-FDG-efflux in NSCs and whether efflux can be reduced with the glucose transport inhibitors phloretin and N-ethylmaleimide and the glucose-6-phosphatase inhibitor chlorogenic acid. Phloretin and N-ethylmaleimide are competitive inhibitors of glucose transport. Phloretin was found to effectively inhibit glucose efflux in erythrocytes but not glucose influx. 27 Chlorogenic acid is an inhibitor of glucose-6-phosphatase, the enzyme responsible for the dephosporylation of glucose 6-phosphate into glucose. Recently, chlorogenic acid has been shown to reduce glucose-6-phosphatase activity in vivo in rats, exerting hypoglycemic activity. 28
In this study, the migration of NSCs and the efflux of FDG from these cells in vivo were investigated in a tumor inflammation rat model. 29 NSCs have been reported to be attracted by inflammatory stimuli.2,9 Therefore, an inflammation model was selected to demonstrate this preferential migration of NSCs to sites of inflammation. Previous data (unpublished) from our laboratory showed that in the tumor inflammation model, NSCs are attracted equally by signals from tumor and inflammation. As free [18F]-FDG will lead to an additional accumulation of radioactivity in the tumor, because of the tumor's high basal glucose metabolism, the tumor serves as an extra control for leakage of [18F]-FDG from the NSCs in vivo.
Material and Methods
Cell Lines
C17.2 NSCs (generously provided by Evan Y. Snyder, Stem Cell and Regeneration Program, Burnham Institute for Medical Research, La Jolla, CA) were grown in high-glucose Dulbecco's Modified Eagle's Medium (DMEM; Invitrogen, Breda, the Netherlands) supplemented with 10% fetal calf serum (FCS; BODINCO B.V., Alkmaar, the Netherlands), 5% horse serum (Invitrogen, the Netherlands), 100 mg/L ampicillin (Invitrogen, Paisley, UK), and 100 mg/L streptomycin (Invitrogen, UK) at 37uC under a 5% CO2 atmosphere and passaged twice a week (1:10 dilution).
C6 glioma cells (ATCC, CCL-107) were grown in DMEM supplemented with 7.5% FCS at 37uC under a 5% CO2 atmosphere and passaged twice a week (1:10 dilution).
Animal Model
The tumor inflammation animal model used in this study was previously described by van Waarde and colleagues. 29 In short, male Wistar rats (180–220 g body weight) were obtained from Harlan Laboratories (Horst, the Netherlands). The rats were housed in Macrolon cages (38 × 3 26 × 3 × 24 cm) on a layer of wood shavings in a room with constant temperature (21 ± 2°C) and a fixed 12-hour light-dark regimen (light phase from 7:00 to 19:00 hours). Food (standard laboratory chow, RMH-B, Hope Farms, the Netherlands) and water were available ad libitum. After 1 week of acclimatization, C6 glioma cells were subcutaneously injected into the right shoulder (2 × 3 106 cells in a 1:1 [v/v] mixture of Matrigel [BD Biosciences, Bedford, MA] and DMEM with 7.5% FCS). After 9 to 10 days, a solid tumor nodule had grown. Turpentine (0.1 mL) was injected into the thigh muscle of the left hind leg to induce a local sterile acute inflammation. Twenty-four hours after turpentine injection, [18F]-FDG or C17.2 NSCs labeled with this radiotracer were injected in the lateral tail vein. PET imaging and ex vivo biodistribution were performed as described below. All experiments were approved by the Animal Ethics Committee of the University of Groningen, the Netherlands. The animal experiments were performed by licensed investigators in accordance with the Law on Animal Experiments of the Netherlands.
Cellular [18F]-FDG Uptake
C17.2 NSCs were seeded at a density of 0.3 × 3 × 106 or 0.6 × 10⁶ cells per well in a 12-well plate. The next day, cells were incubated in 1 mL of complete growth medium (see “Cell Lines,” above) with approximately 200 kBq [18F]-FDG 22 per well for 30 to 120 minutes at room temperature to investigate the effect of incubation time on labeling efficiency. To study the effect of the medium, 0.3 × 10⁶ cells per well were seeded in a 12-well plate and the next day washed once with phosphate-buffered saline with calcium and magnesium (PBS++: 17.4 mM Na2HPO4, 3.5 mM KH2PO4, 0.9 mM CaCl2, 3.5 mM KCl, 0.9 mM MgCl2, 137 mM NaCl2, pH 7.4). Either high-glucose DMEM (4.5 g/L of glucose), low-glucose DMEM (1 g/L of glucose), or PBS++ (without glucose) was added to the cells. Subsequently, approximately 200 kBq of [18F]-FDG was added per well and cells were incubated for 60 minutes at 37uC. Following incubation with the radiotracer, cells were washed two times with 1 mL of PBS++ and harvested by trypsinization, and cellular radioactivity was determined using a Compugamma CS 1282 gamma counter (LKB-Wallac, Turku, Finland). The number of viable cells was counted by a trypan blue exclusion assay. The percentage of cellular radiotracer uptake was calculated by dividing the radioactive counts in the cell suspension by the total activity of radiotracer that was added to the cells. Presented values (corrected for decay) are normalized to 1 × 10⁶ cells. All cell experiments were done at least twice in triplicate.
The toxicity of [18F]-FDG applied at high dose was evaluated. Cells were plated at a density of 24,000 cells per well in a 96-well plate. The next day, cells were incubated with 50 kBq, 500 kBq, and 5 MBq of [18F]-FDG (which corresponds to approximately 500 kBq, 5 MBq, and 50 MBq of [18F]-FDG applied to a well in a 12-well plate) for 1 hour in 100 μL of PBS++. Control cells were incubated in PBS++ without added radioactivity. Immediately after labeling, cell viability was assessed by a trypan blue exclusion assay, and after 24 hours, cell viability was assessed by a trypan blue exclusion assay as well as an 2,5-diphenyltetrazolium bromide (MTT) assay (described below).
Cellular [18F]-FDG Efflux
To investigate any spontaneous efflux of the radiotracer from C17.2 cells, cells were seeded at a density of 0.3 × 10⁶ cells per well and incubated with [18F]-FDG in PBS++ for 60 minutes. Next, cells were washed two times with 1 mL of PBS++ and incubated in growth medium or growth medium supplemented with 50, 100, or 200 μM phloretin (Sigma, St. Louis, MO) or 500 μM or 1 mM chlorogenic acid (Sigma). Either immediately or 120 minutes after replacement of the medium, the supernatant (efflux) was collected and cells (retention) were harvested by trypsinization. Radioactivity of the supernatant and the cell suspension were determined using a Compugamma CS 1282 gamma counter, and the number of viable cells was counted. The percentage of [18F]-FDG retention by the cells was expressed as activity in the cell suspension divided by the sum of the activity in the cell suspension and the supernatant, normalized to 1 × 10⁶ cells.
To study the effect of N-ethylmaleimide on cellular efflux, cells were washed with PBS++ after 60 minutes [18F]-FDG incubation and subsequently incubated with 100 or 500 μM N-ethylmaleimide in PBS pH 7.2 (Calbiochem-Novabiochem Corporation, La Jolla, CA) for 3 minutes. Cells were washed two times with 1 mL of PBS++ and incubated in growth medium. Immediately or 120 minutes after the addition of growth medium, radioactivity was measured in supernatant and cells and efflux was calculated as described above. All cell experiments were done at least twice in triplicate.
Thin-Layer Chromatography
[18F]-FDG and phosphorylated [18F]-FDG in C17.2 NSCs and medium were quantified by thin-layer chromatography (TLC). Immediately following the efflux, experiment cells were thoroughly washed and lysed by 5% Triton X-100 (Sigma). Samples (5 μL) of lysate and medium were applied to silica gel–coated aluminum strips (Whatman, Dassel, Germany). An authentic sample of [18F]-FDG was used as a standard. TLC strips were developed with acetonitrile/water (95/5) as the eluent. After its development, the strips were air-dried, covered with a multipurpose Cyclone phosphor imaging screen (PerkinElmer, Lincoln, NE), and placed in an x-ray film cassette overnight at room temperature. The screen was subsequently analyzed using a PerkinElmer Cyclone Storage Phosphor System. Regions of interest were drawn for [18F]-FDG (Rf value 0.5–0.6) and phosphorylated [18F]-FDG (Rf value 0) using OptiQuant software (Packard Instruments, Meriden, CT), providing the relative amounts of these compounds for each sample.
Cell Viability Assays
Cell viability after uptake and efflux assays was determined by the trypan blue exclusion assay. Following the uptake and efflux assays, aliquots of cell suspension were incubated with an equal volume of 0.4% (v/v) trypan blue (Sigma) for 1 minute at room temperature. The percentage of blue cells, representing the population of dead cells, was counted using a phase-contrast microscope.
Twenty-four hours after cell labeling with increasing amounts of [18F]-FDG, cell viability was assessed with an MTT cell proliferation assay (Sigma). Cells were incubated with MTT, final concentration, 0.5 mg/mL, for 4 hours. The medium was removed, and formed formazan was dissolved in 200 μL dimethyl sulfoxide (DMSO; Merck, Stuttgart, Germany). The OD was measured at 520 nm wavelength in a multiwell plate reader (uQuant, Bio-Tek Instruments, Inc, Winooski, VT, USA).
MicroPET Imaging of [18F]-FDG-Labeled C17.2 Cells in Rats
C17.2 cells were seeded at a density of 0.3 × 10⁶ cells/well in a 12-well plate 1 day prior to the experiment. One hour before incubation with the radiotracer, the cell growth medium was replaced for PBS++. Cells were incubated with 50 MBq [18F]-FDG/well for 60 minutes at 37°C. Subsequently, cells were collected by trypsinization in PBS++. Following radiolabeling of the cells, cellular toxicity was assayed by trypan blue exclusion.
Approximately 8 × 10⁶ radiolabeled cells in 300 μL of PBS++ were used for intravenous administration in rats. Animals were anesthetized with a 1.5% isofluran-air mixture. One hour before the first PET scan, five animals received a bolus injection of 20 to 30 MBq [18F]-FDG and three animals received a similar dose of [18F]-FDG-labeled cells through a tail vein. Because of the leakage of [18F]-FDG from the cells found in the in vitro study, six animals were intravenously pretreated with phloretin (75 mg/kg) (Sigma) dissolved in 100 to 150 μL DMSO (Sigma). Another four animals were pretreated intravenously with DMSO only (carrier control) 3 to 5 minutes before cell injection. The animals were allowed to awaken between tracer injection and scanning to stimulate their brain activity. The more active the brain is, the higher is its capacity to take up any free [18F]-FDG that is released from the labeled cells. One-hour dynamic whole-body scans with continuous bed motion were performed 1 and 4 hours after tracer injection. Ketamine (Parke-Davis, Munich, Germany) and medetomidine (Pfizer, New York, NY) anesthesia was maintained throughout the study, and animals were kept warm with a heating pad. PET scans were made using a Siemens microPET Focus 220 scanner (Siemens Medical Solutions, Knoxville, TN). Imaging data were reconstructed using the two-dimensional ordered-subset expectation maximization (OSEM2D) algorithm with four iterations. As transmission scan for attenuation correction by tissue was not feasible owing to continuous bed motion, a function emission calibration and segmentation in ASIPro software (Siemens Medical Solutions, Hoffman Estates, IL) was used to create an attenuation correction file. During the second round of reconstruction, zoom factor 2 was applied. The PET acquisition data were corrected for dead time, random coincidences, and attenuation. Image analysis was performed using ASIPro microPET data analysis software. For visual representation, data were decay corrected, expressed as a percentage of injected dose, and presented as coronal view of maximal-intensity projections.
Biodistribution of Free Radiotracer and Radiolabeled C17.2 Cells in Rats
The animals of all the treatment groups (ie, free [18F]-FDG, [18F]-FDG-labeled cells, [18F]-FDG-labeled cells plus phloretin, and [18F]-FDG-labeled cells plus DMSO) were sacrificed by extirpation of the heart under deep anesthesia after completion of the final scan, that is, 5 hours after injection of [18F]-FDG or [18F]-FDG-labeled cells. Major organs and tissues as well as the tumor and part of the inflamed muscle were dissected, and wet weight was measured. Plasma and blood cell fractions were obtained from blood by centrifugation (10 minutes at 1,200g). The radioactivity in all samples was measured using a Compugamma CS 1282 gamma counter (LKB-Wallac) applying a decay correction. The results were expressed as standardized uptake values (SUVs) calculated as radioactivity per gram of tissue divided by the injected dose per gram of body weight. The inflamed to control muscle ratio was also calculated as a measure of cell migration toward inflammation.
Statistical Analysis
The biodistribution data were analyzed using SPSS version 16.0 (SPSS Inc, Chicago, IL). Comparison between groups was made using the Student t-test and one-way analysis of variance (ANOVA) followed by the Bonferroni post hoc test, and p values < .05 (two-sided) were considered statistically significant.
Results
Labeling of C17.2 NSCs with [18F]-FDG
Several parameters for the labeling of C17.2 NSCs with [18F]-FDG were investigated to achieve a sufficiently high labeling efficiency for in vivo imaging studies. When C17.2 cells were incubated with [18F]-FDG in complete (high glucose) growth medium, a linear increase in cellular [18F]-FDG accumulation over time was observed (Figure 1A), indicating that [18F]-FDG accumulation was not complete within 2 hours. In fact, cellular [18F]-FDG uptake was less than 1% of the applied dose after 2 hours of incubation. When C17.2 cells were seeded at half the density, an approximately 25% increase in [18F]-FDG uptake was observed at each time point, but labeling efficiency was still low. As [18F]-FDG is a glucose-analogue and C17.2 cells were incubated with this analogue in a high-glucose medium, competition between [18F]-FDG and glucose could be responsible for this low tracer uptake. Therefore, we investigated whether a reduction in glucose content of the medium would result in an increase in labeling efficiency. Indeed, the cellular uptake of [18F]-FDG was dramatically enhanced when cells were kept in a low-glucose medium during the labeling procedure (Figure 1B). Thus, in low-glucose medium, the labeling efficiency was enhanced threefold compared to the labeling efficiency in high-glucose medium, that is, 4.1 ± 0.4 and 1.4 ± 0.4% dose/106 cells, respectively. In the absence of glucose (PBS++ as medium), the labeling efficiency was almost an order of magnitude higher (11.9 ± 0.5% dose/106 cells) than the labeling efficiency in high-glucose medium.

Cellular uptake of [18F]-FDG in C17.2 neural stem cells. A, The effect of the seeding density of cells and the total incubation time with the radiotracer on the cellular radioactivity in C17.2 cells. Cells were seeded in complete growth medium with 4.5 g/L of glucose. B, The effect of glucose in the medium on labeling efficiency. Cells were seeded at 0.3 × 10⁶cells per well. Cells were incubated with [18F]-FDG for 1 hour. High-glucose DMEM contains 4.5 g/L glucose, lw-glucose DMEM contains 1 g/L glucose, and PBS++ has no glucose. Data are presented as mean ± standard deviation. Owing to the size, in some cases, standard deviations are not visible.
With the trypan blue exclusion assay, no effect of the [18F]-FDG labeling procedure on cell viability was noticed immediately following labeling, but small reductions in cell viabilities were measured by the MTT assay 24 hours after tracer incubation: the percentage of viable cells after exposure to 50 kBq, 500 kBq, and 5 MBq of [18F]-FDG was 91 ± 13%, 93 ± 13%, and 84 ± 9%, respectively, compared to unlabeled control cells (100 ± 14%). The results from a one-way ANOVA test showed that these differences in cell viabilities were not statistically different. Therefore, the highest dose was chosen for the labeling of C17.2 cells for in vivo experiments.
Inhibition of [18F]-FDG Efflux from C17.2 NSCs In Vitro by Phloretin
For in vivo cell tracking, it is important that the radioactive label does not substantially dissociate from the cells. Unfortunately, approximately 40% of radioactivity was released from the [18F]-FDG-labeled C17.2 cells within 2 hours after labeling (Figure 2). TLC of the cell lysates at different time points after labeling (Figure 3) revealed a decrease in the cellular amount of phosphorylated [18F]-FDG of ≈ 20% after 1 hour of efflux, which is in agreement with the speed of efflux of cell-bound radioactivity.

Cellular retention of [18F]-FDG at 120 minutes after labeling. Cells were seeded at 0.3 × 10⁶ cells per well. After incubation with [18F]-FDG, cells were washed for 3 minutes with N-ethylmaleimide followed by incubation in complete feeding medium (NEM) or incubated in complete feeding medium with different concentrations of chlorogenic acid (CHA) and phloretin. The results are normalized to cell retention immediately after cell labeling.
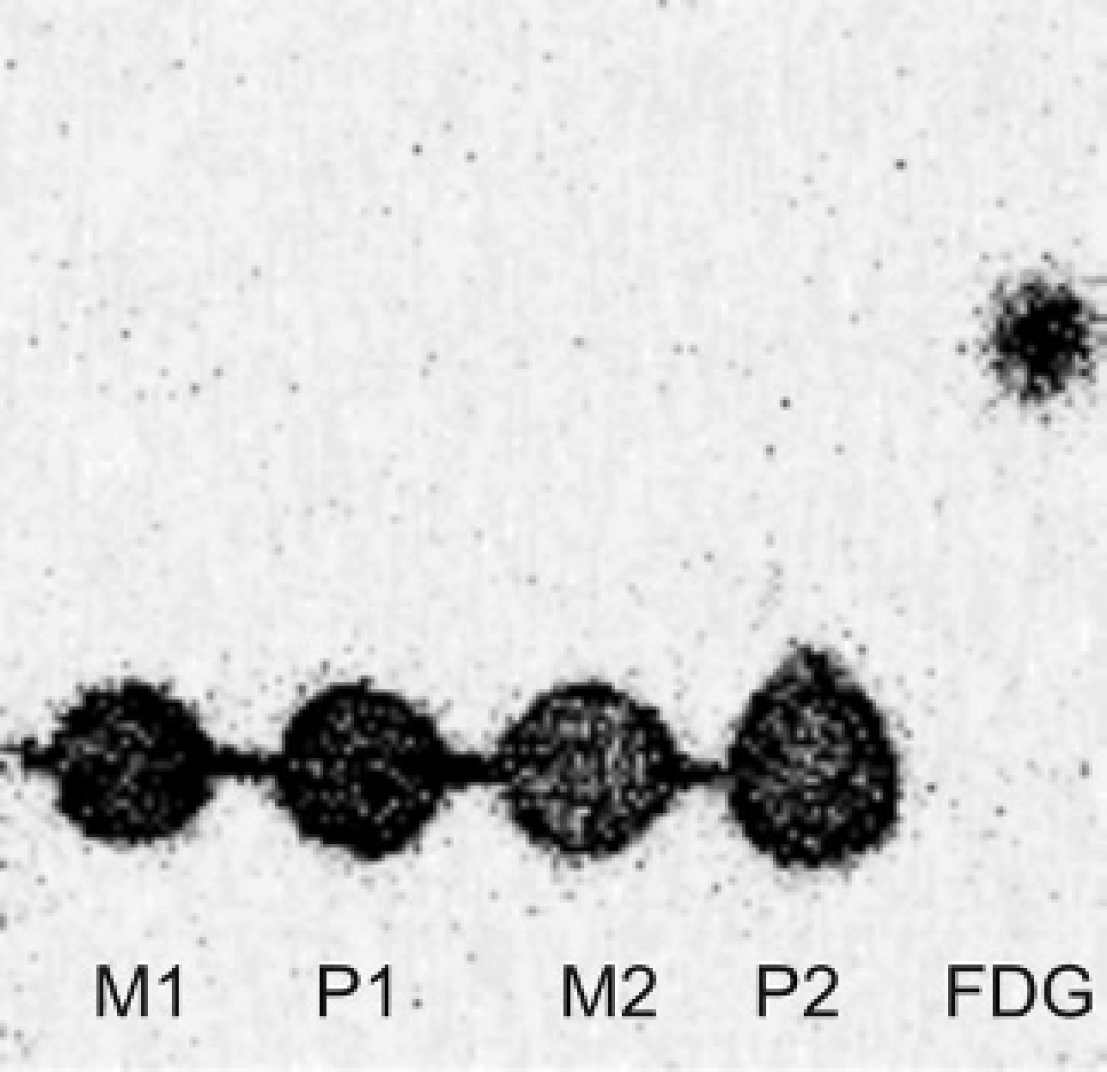
Thin-layer chromatogram (TLC) of lysates from [18F]-FDG-loaded C17.2 neural stem cells. On [18F]-FDG uptake, the cells were washed and incubated for 1 hour in medium (M) or 200 μM phloretin (P). Next, they were washed again and lysed (samples M1 and P1, respectively) or incubated in medium for 1 more hour, washed, and lysed (samples M2 and P2, respectively). The right lane shows an authentic sample of [18F]-FDG. TLC was performed on silica gel–coated aluminum strips with acetonitrile/water (95/5) as the eluent.
In an attempt to block the release of [18F]-FDG from C17.2 cells, the effect of the glucose-6-phosphatase inhibitor chlorogenic acid on cellular efflux of radioactivity was investigated. Interestingly, inhibition of glucose-6-phosphatase activity by chlorogenic acid did not prevent the release of radioactivity from [18F]-FDG-labeled C17.2 cells (see Figure 2). Chlorogenic acid did not show any toxicity in the trypan blue exclusion assay. As chlorogenic acid was shown to inhibit glucose-6-phosphatase in liver microsomes, 30 we assessed its effectiveness in intact liver (HepG2) cells. Similar to C17.2 NSCs, [18F]-FDG efflux could not be blocked by chlorogenic acid in intact HepG2 cells. Next, the effect of the glucose transport inhibitors phloretin and N-ethylmaleimide was tested. N-Ethylmaleimide showed toxicity to C17.2 cells and did not result in improvement in [18F]-FDG retention. Phloretin, on the other hand, was able to improve retention of the radioactivity in the cells in vitro. Incubation of [18F]-FDG-labeled C17.2 cells in the presence of phloretin, an inhibitor of facilitative glucose transport, resulted in a concentration-dependent increase in [18F]-FDG retention (see Figure 2). Phloretin did not affect cell viability, as determined by the trypan blue exclusion assay. At a phloretin concentration of 50 μM, [18F]-FDG retention was 70% compared to ≈ 60% in its absence. At 100 μM phloretin, retention increased further to 80%, and at 200 μM phloretin, the retention was nearly 90%. When cells were not in the continuous presence of phloretin after [18F]-FDG labeling, but phloretin was washed away after 1 hour of incubation, radio-TLC showed ≈ 20% loss of phosphorylated [18F]-FDG in the cell lysate in the subsequent hour (see Figure 3), indicating that glucose transport inhibition by phloretin is transient and reversible.
MicroPET Imaging of [18F]-FDG-Labeled C17.2 Cells in a Tumor Inflammation Model
The procedures and protocols for tumor growth and inflammation induction were carried out as previously described. 29 Similarly, as reported in those studies, tumor growth after inoculation of C6 glioma cells varied between animals. The tumor mass at the time when animals were sacrificed was 1.727 ± 1.238 g (mean ± SD). Turpentine caused palpable swelling of the thigh 24 hours after injection. Muscle dissection revealed the presence of abscess, a sign of acute inflammation, which was accompanied by massive infiltration of neutrophils.29,31
Prior to infusing labeled C17.2 cells and examining their tissue distribution, we first analyzed the distribution of free [18F]-FDG after intravenous administration. A typical distribution pattern of [18F]-FDG was observed 1 and 4 hours after tracer injection (Figure 4). A high amount of activity was visible in the bladder because of [18F]-FDG excretion via the kidneys. 32 Ex vivo biodistribution at 5 hours postinjection (Table 1) showed high accumulation of [18F]-FDG in tissues with a high-glucose metabolism, such as heart, tumor, and brain (SUV 8.1, 4.3, and 1.3, respectively). Administration of [18F]-FDG-labeled C17.2 NSCs resulted in significantly higher accumulation of radioactivity in liver, lungs, and spleen (see Table 1) compared to administration of the free tracer (5.7-fold, 5.4-fold, and 2.4-fold increase, respectively; p < .01). In fact, PET images showed that most of the C17.2 cells were present in the lungs after 1 hour (see Figure 4), whereas redistribution from the lungs to the liver and spleen was observed 4 hours after cell administration. These results imply that the increased tracer uptake in liver, lung, and spleen is due to trapping of the NSCs in these tissues. However, equally high accumulation of radioactivity in tumor and heart was observed after injection of either free [18F]-FDG or [18F]-FDG-labeled C17.2 cells. Administration of radiolabeled cells resulted in only 22% lower (p 5 .012) accumulation of radioactivity in the brain than injection of free [18F]-FDG, whereas uptake in tumor and heart was comparable for both groups. These results suggest that [18F]-FDG presumably is partly released from the cells as cells are not expected to migrate to the brain or accumulate in the heart without any inflammatory targeting signals. In fact, we have shown in a previous study (unpublished data) that C17.2 NSCs labeled with [99mTc]-HMPAO do not significantly accumulate in the brain and heart (SUV 0.024 ± 0.021 and 0.125 ± 0.031, respectively; 17 hours postinjection). As [18F]-FDG is excreted via the kidneys, the high radioactivity in kidneys and bladder shown in the PET images of animals infused with [18F]-FDG-labeled cells is also in accordance with leakage of the radiotracer from cells.

Coronal view of maximal-intensity projections of PET images obtained 60 to 120 minutes and 240 to 300 minutes after injection of free [18F]-FDG, [18F]-FDG-labeled stem cells, and [18F]-FDG-labeled stem cells after pretreatment with phloretin or DMSO. The upper part of the images shows the anterior part of the animals. Hot spots in the head are harderian glands. The corresponding lower parts of each frame show coronal slices of the hind legs, revealing inflamed muscle tissue in the left leg versus control muscle tissue in the right leg. Animals received a bolus injection of 20 to 30 MBq [18F]-FDG or a similar dose of [18F]-FDG-labeled cells through a tail vein. Dotted regions of interest indicate the position of the tumors, as well as the inflammations, and some organs.
Biodistribution of Free [18F]-FDG and C17.2 Neural Stem Cells Labeled with [18F]-FDG in a Rat Tumor Inflammation Model at 5 Hours after Injection

[18F]-FDG 5 2′-[18F]fluoro-2′-deoxy-D-glucose; NS = not statistically significant; RBC = red blood cell.
Results are represented as standardized uptake value ± standard deviation.
Effect of Phloretin on [18F]-FDG Efflux In Vivo
To prevent the leakage of [18F]-FDG from the C17.2 cells, animals were treated with 75 mg/kg phloretin in DMSO prior to injection of labeled NSCs. PET (see Figure 4) and ex vivo biodistribution data (Table 2) showed that accumulation of radioactivity in glucose-consuming tissues such as heart, brain, and tumor was not significantly decreased after administration of phloretin. However, the uptake ratio between inflamed muscle and control muscle was significantly increased in the phloretin-treated animals (ratio 5.0 ± 0.9) compared to animals injected with [18F]-FDG-labeled cells (ratio 2.7 ± 0.9; p 5 .042) or [18F]-FDG only (ratio 2.3 ± 0.6; p 5 .004). For comparison, injection of DMSO before [18F]-FDG-labeled cells resulted in an inflamed to control muscle ratio of 3.0 ± 1.7. Taken together, these results suggest that labeled NSCs migrate toward the inflammatory site but that phloretin could only partly prevent release of [18F]-FDG from labeled NSCs in vivo.
Biodistribution of Neural Stem Cells Labeled with [18F]-FDG in a Rat Tumor Inflammation Model at 5 Hours after Injection

ANOVA = analysis of variance; DMSO = dimethyl sulfoxide; [18F]-FDG 5 2′-[18F]fluoro-2′-deoxy-D-glucose; NS = not statistically significant; RBC = red blood cell.
Pretreatment was as follows: no pretreatment ([18F]-FDG-labeled cells), pretreatment with 75 mg/kg phloretin in DMSO (phloretin + [18F]-FDG-labeled cells), and pretreatment with DMSO only (DMSO + [18F]-FDG-labeled cells). The results are represented as standardized uptake value ± standard deviation.
Effect of DMSO on the Distribution of Labeled Stem Cells
Compared to images of animals administered with labeled cells only, PET images of animals treated with 75 mg/kg phloretin in DMSO before administration of labeled stem cells showed a redistribution of the radioactivity from the lungs to the liver and spleen 1 hour after administration of the labeled cells (see Figure 4). PET scans obtained 4 hours after administration showed further clearance of the radiolabel from the lungs. Ex vivo biodistribution at 5 hours postinjection (see Table 2) confirmed that phloretin administration prior to injection of the radiolabeled stem cells significantly reduced the accumulation of radioactivity in lung (−74%) and spleen (−63%). Tracer uptake in liver was also strongly reduced (−54%), but this reduction did not reach statistical significance. The major reduction in tracer uptake in these organs, however, cannot be attributed to phloretin because ex vivo biodistribution of animals pretreated with only DMSO (vehicle control) prior to injection of labeled stem cells showed a similar significant reduction in tracer uptake in lung, spleen, and liver compared to animals injected with [18F]-FDG-labeled cells only. Pretreatment with DMSO only also caused significant reductions in tracer accumulation in heart (−37%) and tumor (−38%), which were not observed in animals pretreated with a phloretin solution in DMSO. The reason for this discrepancy remains to be elucidated.
Discussion
In this study, we investigated the possibility of labeling C17.2 NSCs with [18F]-FDG and the subsequent application of this approach to examine the in vivo distribution of the radiolabeled C17.2 cells by microPET imaging in a tumor inflammation model after intravascular administration. The PET tracer [18F]-FDG is a glucose analogue that is actively transported into cells by glucose transporters, where it is phosphorylated by hexokinase. The phosphorylated form, 2′-[18F]fluoro-2′-deoxy-D-glucose-6-phosphate ([18F]-FDG-6-P), is a poor substrate for glucose-6-phosphate dehydrogenase, an enzyme in the pentose phosphate pathway, and therefore causes its entrapment within the cells. 33
C17.2 NSCs at high, that is, ≈ 90%, confluency showed a lower uptake of [18F]-FDG than C17.2 cells at median, that is, ≈ 50%, confluency (see Figure 1A). This distinction can be explained by the fact that C17.2 NSCs display contact inhibition on reaching total confluency, resulting in a lower metabolic activity. Moreover, incubation of cells with [18F]-FDG in the absence of glucose (PBS++) resulted in a significantly higher labeling efficiency than incubation in the presence of glucose (see Figure 1). These data thus reveal that [18F]-FDG, as a glucose analogue, most likely competes with glucose in the medium for the same cellular transporters and hexokinase to be internalized and phosphorylated by the cells.
TLC revealed the presence of both [18F]-FDG and phosphorylated [18F]-FDG in cell lysates, whereas in the medium, only free [18F]-FDG was detectable. A decrease in the amount of phosphorylated [18F]-FDG in cell lysates occurred over time. Although glucose-6-phosphatase, an enzyme that dephosphorylates glucose 6-phosphate, is abundantly expressed in liver and kidney cells, its expression has been demonstrated in other cell types as well.34–37 Since we observed a decrease in the amount of phosphorylated [18F]-FDG in the cell lysate over time, as revealed by TLC, dephosphorylation of [18F]-FDG-6-P apparently also occurs in C17.2 cells. To inhibit the dephosphorylation of [18F]-FDG-6-P, cells were incubated with chlorogenic acid. Chlorogenic acid inhibits hepatic glucose-6-phosphatase by blocking transport of glucose 6-phosphate to the endoplasmic reticulum, where dephosphorylation occurs. 30 Unfortunately, it did not show inhibitory effect on [18F]-FDG-6-P dephosphorylation in our hands in both C17.2 NSCs and HepG2 cells. One reason for that could be that chlorogenic acid does not affect intact cells as its effect was shown only on microsomes. On the other hand, Leuzzi and colleagues showed that glucose-6-phosphate transport in fibroblast-and HeLa cell–derived microsomes is not influenced by chlorogenic acid either. 38 As glucose 6-phosphate accumulates in the endoplasmic reticulum of the latter cell types, the authors suggested the existence of a second endoplasmic reticulum glucose-6-phosphate transport system. Although we did not investigate this further, owing to high [18F]-FDG efflux and the inability of chlorogenic acid to block the efflux, we cannot exclude the existence of such a glucose-6-phosphate transport system in C17.2 NSCs.
Unfortunately, [18F]-FDG leakage from the cells was evident both in vitro and in vivo. Whereas in vitro [18F]-FDG leakage from the cells could be prevented by the use of phloretin (see Figure 2), phloretin could not prevent the loss of cellular radioactivity in vivo (see Table 2). High levels of radioactivity in plasma and metabolically active organs such as the brain and heart in animals pretreated with phloretin indicated that phloretin (at 75 mg/kg) is not effective in the prevention of [18F]-FDG leakage from C17.2 cells following tail vein injection. As the brain and heart are organs with high metabolic activity but exhibit no inflammatory signals, the radioactivity in the brain and heart does not reflect accumulation of labeled cells but should be ascribed to leakage of [18F]-FDG from the cells. Leakage of [18F]-FDG from labeled cells is not uncommon, and efflux from other cell types has been reported as well.26,39,40 The inability of phloretin to inhibit [18F]-FDG efflux in vivo might be due to the dosage of phloretin administered in this study, which may be insufficient for completely blocking all glucose transporters. Phloretin is only very slightly soluble in water or ethanol. The inhibitor can be dissolved in DMSO, but to keep the injection volume of this organic solvent small within reasonable limits, we had to limit the dosage of the inhibitor to 75 mg/kg.
The majority of [18F]-FDG-labeled C17.2 cells were trapped in the capillary network of lungs, liver, and spleen (see Figure 4). Interestingly, PET images from animals treated with phloretin showed faster clearance of stem cells from the lungs compared to the group of animals that had not been treated with phloretin (see Figure 4). In accordance, the biodistribution data (see Table 2) showed that the activity in lungs, liver, and spleen was significantly lower in animals pretreated with phloretin compared to the activity in animals that received no pretreatment (see Table 1). The measured activities in these organs in the phloretin-treated animals resembled the values of animals injected with free [18F]-FDG, suggesting avoidance of cell retention in the capillary beds of these organs in the presence of phloretin. However, this decrease in cell retention cannot be explained by an effect of phloretin per se, as the same decrease of radioactivity in lungs, spleen, and liver was attained when the animals had been pretreated with DMSO, that is, the solvent for phloretin (see Table 2). Interestingly, it has been shown that administration of sodium nitroprusside, a strong vasodilator, reduces mesenchymal stem cell trapping in lungs after intravenous injection. 41 Given that DMSO-induced relaxation in porcine pulmonary and coronary arteries has been described, 42 it appears plausible that a vasodilatation effect of DMSO could have alleviated cell retention in lung, liver, and spleen in our study.
In future work, it will therefore be of interest to further investigate the effect of more vasodilation compounds on the distribution of intravenously injected stem cells as they could markedly improve the migration of stem cells to the target site. 43
Conclusions
We have shown that labeling of C17.2 NSCs with [18F]-FDG is feasible, but labeling efficiency remains relatively low, despite optimization of the procedure. Still, sufficient quantities of labeled cells for in vivo cell tracking can be produced. However, the major drawback of [18F]-FDG-labeled NSCs was the substantial loss of radioactivity observed both in vitro and in vivo, which is presumably due to the glucose-6-phosphatase activity of the stem cells. In vitro, release of radioactivity from the labeled stem cells could be inhibited with the glucose transport inhibitor phloretin, but only partial reduction of efflux of radioactivity was observed in vivo. As a consequence, [18F]-FDG-labeled NSCs are not suitable for tracking of cell migration, not even after administration of phloretin. An incidental but interesting finding in this study was that DMSO, the matrix in which phloretin was administered, strongly reduced the entrapment of labeled cells in the microvasculature of lung, spleen, and liver, which might be due to the vasodilatation activity of DMSO. This could be an important finding for new strategies on improving cell replacement therapy protocols with intravenously administered stem cells.
Footnotes
Acknowledgments
This work was funded by the Dutch Top Institute Pharma project T5-105.
Financial disclosure of reviewers: None reported.