
Abstract
In this study, we assessed the feasibility of using positron emission tomography (PET) and the tracer [11C]OMAR ([11C]JHU75528), an analogue of rimonabant, to study the brain cannabinoid type 1 (CB1) receptor system. Wild-type (WT) andCB1 knockout (KO) animals were imaged at baseline and after pretreatment with blocking doses of rimonabant. Brain uptake in WT animals was higher (50%) than in KO animals in baseline conditions. After pretreatment with rimonabant, WT uptake lowered to the level of KO animals. The results of this study support the feasibility of using PET with the radiotracer [11C]JHU75528 to image the brain CB1 receptor system in mice. In addition, this methodology can be used to assess the effect of new drugs in preclinical studies using genetically manipulated animals.
THE ENDOCANNABINOID SYSTEM is composed of the cannabinoid (CB) receptors, the endogenous CB ligands, and the enzymes involved in their synthesis and degradation. At least two types of CB receptors have been identified: CB1, the most abundant G protein–coupled receptor, which is mainly expressed in the central nervous system, and CB2, which is found mostly in the immune system. 1 Globally, the endocannabinoid system is involved in the control of several physiologic processes of the central nervous system and peripheral tissues, such as gastrointestinal activity, 2 induction of analgesia, 3 and bone maintenance. 4
Knockout (KO) animals have become a powerful tool for studying multiple physiologic and pathologic processes and for testing and developing new drugs and therapies. Interestingly, a KO animal for the CB1 receptor is available. 5 Studies using these animals have demonstrated that the CB1 receptor is involved in emotional responses, 6 cognition, 7 nociception, 8 and metabolism. 9 The use of positron emission tomography (PET) to investigate the role of certain genes in brain function is nowadays possible by imaging KO mice. Recently, three CB1 receptor ligands were proposed as imaging agents for PET: [11C]OMAR ([11C]JHU75528), 10 [18F]MK9470, 11 and [11C]MePPEP. 12 PET studies with these ligands have been carried out in rodents,10,13 baboons, 10 and humans.11,12,14 In this study, we assessed the feasibility of using PET and the tracer [11C]JHU75528, an analogue of rimonabant, to study the CB1 receptor system in the mouse brain by imaging wild-type (WT) and CB1 KO mice.
Materials and Methods
Radiotracer Synthesis
All compounds and solvents were purchased from Sigma-Aldrich (Madrid, Spain), Panreac (Barcelona, Spain), Scharlab (Barcelona, Spain), ABX (Radeberg, Germany), and Merck (Darmstadt, Germany). The C18 semipreparative column was a Teknokroma (Barcelona, Spain) Sea18 (250 × 1 cm, 5 μm), and the analytic column was a Teknokroma Sea18 (150 × 0.46 cm, 5 μm). The gas chromatography (GC), purification, and analytic highperformance liquid chromatography (HPLC) were done in an Agilent (Santa Clara, CA) 1100 series device. [11C]MeI was produced in a Bioscan (Washington, DC) MeIPlus Production Module, and the radiotracer synthesis was done in a Bioscan Autoloop Methylation Module. The HPLC radiodetectors used were the Raytest Gina model, and the multichannel gammaspectrometer was a Raytest Mucha model. Precursor (1-(2,4-dichlorophenyl)-4-cyano-5-(4-hydroxyphenyl)-N-(piperidin-1-yl)-1H-pyrazole-3-carboxamide) and standard (1-(2,4-dichlorophenyl)-4-cyano-5-(4-methoxyphenyl)-N-(piperidin1-yl)-1H-pyrazole-3-carboxamide) were synthesized according to the methodology described by Fan and colleagues. 15 [11C]JHU75528 (1-(2,4-dichlorophenyl)-4-cyano-[11C]-5-(4methoxyphenyl)-N-(piperidin-1-yl)-1H-pyrazole-3-carboxamide) was synthesized following the methodology previously described in Fan and colleagues, 15 with slight modifications. Briefly, [11C] was generated in a cyclotron (IBA, Cyclone 18/9, Louvain-la-Neuve, Belgium) in the chemical form of [11C]CO2 by bombarding protons (35 μA for 60 minutes) into a target containing a mixture of N2 and O2 (0.5%) to yield approximately 110 GBq of activity. The radioactive specimen [11C]CH3I was obtained after reducing the [11C]CO2 in the presence of 1 M LiAlH4 in dried tetrahydrofuran and finally addition of hydroiodic acid at 37% in water solution. Then [11C]CH3I was distilled to a loop reactor, where 1 mg of precursor in 100 μL of anhydrous dimethyl sulfoxide was [11C]methylated at 100°C for 6 minutes in the presence of 0.7 μL of 2 M NaOH. After that, the reaction crude was purified by HPLC using a C18 semipreparative column and a mixture of ammonium formiate/CH3CN 70:30 at 5 mL/min in isocratic mode. The collected desired fraction (corresponded to 10.12 minutes) was reformulated by solid-phase extraction methodology to obtain [11C]JHU75528 in a 0.9% saline solution. Subsequently, the tracer underwent a quality control procedure consisting of chemical purity by ultraviolet HPLC, radiochemical purity by radio-HPLC, residual solvents by GC, and radionucleid purity by multichannel gammaspectrometry.
Animals
Eight adult male mice were used in these experiments (four WT, four CB1 KO) (mean weight 43 ± 2 g). Mice were housed in controlled laboratory conditions with the temperature maintained at 21 ± 1°C and humidity at 55 ± 10%. Food and water were available ad libitum. Animal procedures were conducted in strict accordance with the guidelines of the European Communities Directive 86/609/EEC regulating animal research and were approved by the local ethical committee (CEEA-PRBB). The proposed study consisted of a baseline PET study in WT and CB1 receptor KO mice followed by a displacement (CB1 receptor blocking) PET experiment performed on the same animals. Animals were injected intravenously with [11C]JHU75528 and imaged by a microPET R4 (Concorde, Siemens, Concord, CA) system. Specific binding displacement studies were performed by injecting 2 mg/kg of rimonabant intravenously 30 minutes before image acquisition. 10
Autoradiography and Histology
To perform the autoradiographic studies, WT animals (n = 3) were anesthetized and injected with an average dose of 95 μCi of [11C]JHU75528. Anesthesia was maintained for 60 minutes to reproduce the experimental conditions of the PET study. Then mice were euthanized by decapitation under isoflurane anesthesia, and the brains were removed and frozen by immersion in cold (–70°C) 2-methylbutane. Fifty-micron sections were obtained at the level of the nucleus accumbens, striatum, hippocampus, and cerebellum using a cryomicrotome. Sections were exposed to an imaging plate BAS-SR (Fujifilm, Kanagawa, Japan), and the autoradiographic images were obtained with a BAS-5000 system (Fujifilm, Tokyo, Japan). To locate the different brain areas, the sections were stained with Nissl staining. For each animal, regions of interest (ROI) were manually drawn with AIDA Bioimaging Analyzer software (Fujifilm) over the stained sections. Finally, the ROI were applied to the autoradiographic sections and the mean signal value was obtained.
PET Imaging
Mice were anesthetized with isofluorane vaporized in O2 at a concentration of 2.5% and received a [11C]JHU75528 injection through the tail vein (273 ± 30 μCi; mean specific activity 81 GBq/mmol). The animal was then immediately placed in the scanner to proceed with data acquisition. Anesthesia was maintained through the whole acquisition with a facial mask. Data were acquired for 90 minutes with a microPET R4 scanner, and two studies were reconstructed: the sum of the whole acquisition and a dynamic study (frames: 12 × 20, 10 × 60, 10 × 300, and 2 × 600 seconds). Images were corrected for decay and nonuniformities. No attenuation or scatter correction was applied.
Image Analysis
The whole sum image was reconstructed using the maximum a posteriori (18 iterations) ordered subset expectation maximization (12 subsets, 2 iterations) algorithm. This image was used to draw the ROI manually. A whole-brain ROI was drawn for each animal. Dynamic studies were reconstructed using the filtered backprojection algorithm (ramp filter cutoff value 0.5). Time-activity curves were obtained for each animal and were normalized to the injected dose and weight to calculate the mean standard uptake values (SUVs) for each group (WT, KO). Images obtained by summing from 30 to 60 minutes and 60 to 90 minutes were also quantified to test if the results were equivalent and the image acquisition protocol could be shortened. One-way analysis of variance followed by the Tukey multiple comparison test was used to assess if the differences among studies and groups were significant.
Results
Following the proposed methodology, the [11C]JHU75528 mean radiochemical yield was 40% (± 7%). The radiotracer doses had a mean specific activity of 80 GBq/mmol and a radiochemical purity > 98%.
The tracer [11C]JHU75528 showed a rapid uptake by the brain (between 5 and 10 minutes postinjection time) in both WT and KO animals (Figure 1). Brain uptake was followed by a relatively stable and slow clearance in WT animals and a faster washout in KO animals (Figure 1 and Figure S1 [online version only]). KO animals showed a lower tracer uptake than the WT animals (50%). The effect of pretreatment with rimonabant 2 mg/kg decreased the brain uptake in WT animals (Figure 2), bringing the curves to the level of the KO animals (see Figure 1). No differences could be appreciated in the KO animals between the baseline condition and after treatment with a blocking dose of rimonabant (see Figure 2).
The brain distribution of [11C]JHU75528 was rather homogeneous (see Figure 2) in PET images, indicating a similar uptake in the different brain regions. Additional autoradiographic studies were performed in WT animals to verify this behavior. Figure 3 shows the autoradiographic sections obtained at the level of the caudate putamen (right column), hippocampus (center), and cerebellum (left), with the corresponding histologic sections below. The results from the autoradiography showed a higher binding of radiotracer in the cerebral cortex, hippocampus, and striatum in comparison with the thalamus and pons (Figure S2 [online version only]).
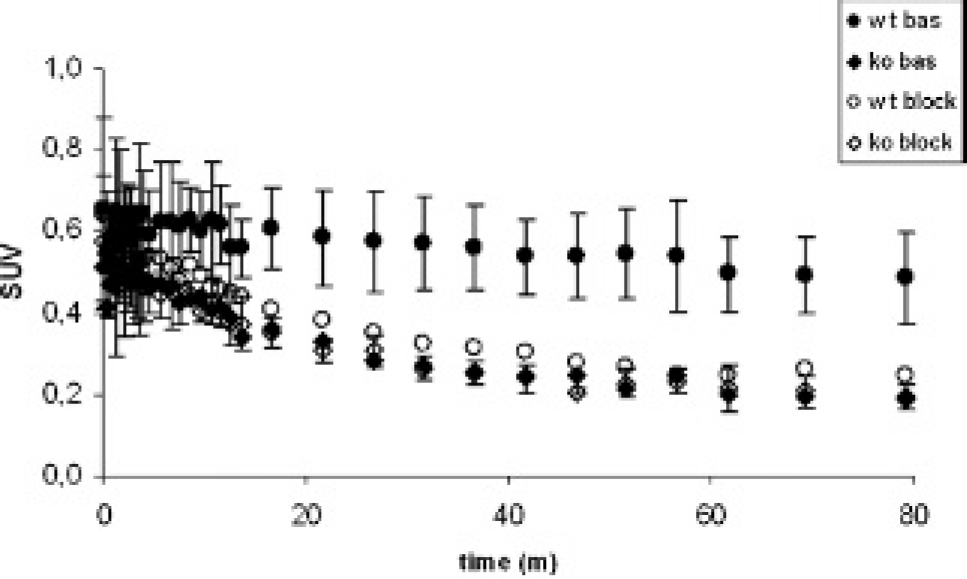
PET brain time-activity curves of [11C]JHU75528 in wild-type (WT) and knockout (KO) animals. The mean standard uptake value (SUV) curve (and standard deviation bars) for each group (n = 4/group) is plotted against time. Baseline (filled symbols) and pretreatment studies (open symbols) were performed in all animals (WT = circles, KO = diamonds).
Quantification results were the same if the summed image of 30 to 60 minutes or 60 to 90 minutes was used, as reported in Table 1. The effect of pretreatment with rimonabant was significant in WT animals, decreasing the brain uptake by a 50% (Tukey's post hoc comparisons p < .001). Differences between WT baseline and KO baseline (p < .001) as well as WT baseline and KO blocking (p < .01) were also significant. No differences were seen between the baseline and blocking results in KO animals.
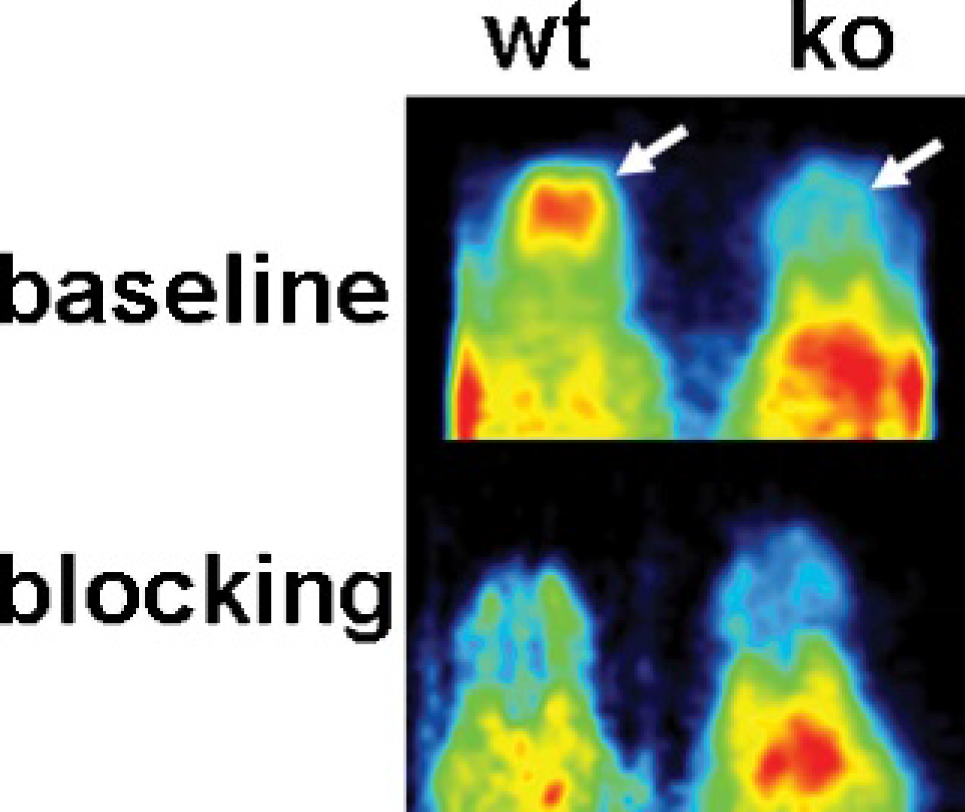
[11C]JHU75528 PET images in mice. Axial views of wild-type (WT; left column) and knockout (KO; right column) animals at baseline (upper row) and following pretreatment of a blocking dose of rimonabant (lower row). Images were pseudocolored and scaled to their maximum for display purposes. The arrow is pointing to the brain.

[11C]JHU75528 autoradiographic images in wild-type mice at 60 minutes postinjection. Transverse sections of two animals and the corresponding histology in online version only. The left column shows sections at the levels of the caudate putamen; the central column, the hippocampus; and the right column, the cerebellum. Images were pseudocolored and scaled to their maximum for display purposes.
Mean Standard Uptake Value and Corresponding Standard Deviation for Each Group of Animals in Baseline and Blocking Conditions
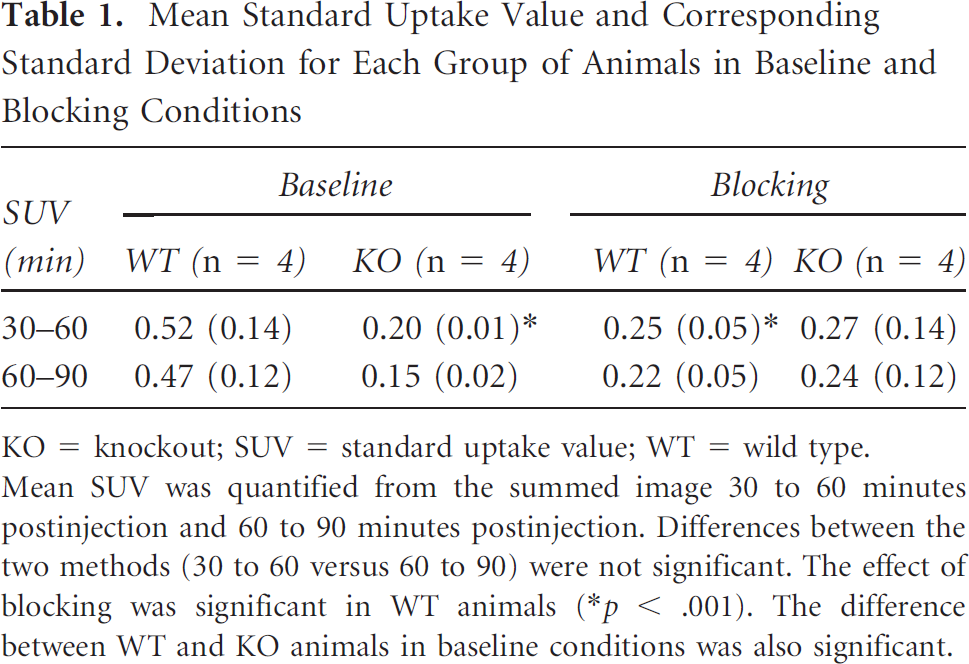
KO = knockout; SUV = standard uptake value; WT = wild type.
Mean SUV was quantified from the summed image 30 to 60 minutes postinjection and 60 to 90 minutes postinjection. Differences between the two methods (30 to 60 versus 60 to 90) were not significant. The effect of blocking was significant in WT animals (*p < .001). The difference between WT and KO animals in baseline conditions was also significant.
An approximate calculation of the transient equilibrium time was performed for the WT group by plotting the mean ratio of specific to nonspecific uptake. Specific uptake was defined as the mean SUV in baseline conditions minus the mean SUV under rimonabant pretreatment, which was defined as nonspecific uptake. The graph showed that equilibrium was reached at 45 minutes after the radiotracer injection (Figure 4). The calculation was repeated using the mean SUV baseline in KO animals as nonspecific uptake, obtaining the same results (see Figure 4).
Discussion
The radiochemical yield in [11C]JHU75528 synthesis increased from 16% (± 5%) to 40% (± 7%). This increase is due to the fact that the reaction was performed in a reactor loop instead of a vessel. The reactor loop has a greater reactor surface, allowing a better interaction between the reactants. A similar increase in the radiochemical yield has also been described for other ligands. The increase in radiochemical yield allowed shortening of the production time, thus elevating the specific activity (using wet chemistry and an 11C-CO2 target in the IBA cyclotron).

Determination of an approximated transient equilibrium time of [11C]JHU75528 in mice. The subtraction of the mean (n = 4) wild-type (WT) baseline and corresponding blocking curves was plotted as a function of time. The maximum values were reached at 45 minutes. The same result was obtained when the subtraction between baseline WT and baseline knockout (KO) curves was calculated.
The CB1 receptor radiotracer [11C]JHU75528 showed a clear brain uptake in WT animals, which was displaceable by pretreatment with the selective CB1 receptor antagonist rimonabant. No brain-specific uptake was seen in CB1 KO mice in both baseline and blocking conditions. These sets of experiments demonstrate that [11C]JHU75528 binds specifically to the CB1 receptor at the whole brain level of the mice. Similar results were obtained with the radiotracer [11C]MePPEP. 12
Tracer kinetics showed a rapid uptake by the brain, followed by a relatively stable and slow clearance in WT animals, whereas a faster washout was seen in KO animals owing to the lack of binding to the CB1 receptor. The relatively stable and slow washout observed in both WT and CB1 KO mice could be related to the fact that CB tracers are generally very lipophilic. The high lipophilicity of almost all CB1 ligands constitutes a serious issue in CB1 radiotracer development. In fact, high lipophilic radiotracers remain in cell membranes and myelin structures for a longer time. This is appreciated as slow clearance in time-activity curves and contributes to increasing the nonspecific binding and, perhaps, reducing the binding potential of the radiotracer. A recent study focused on reducing the lipophicity of the tracer [11C]JHU75528. 16 The peak of radiotracer concentration occurred before 15 minutes postinjection. Our result was in accordance with the previously published data by Horti and colleagues using dissection methods, who reported a time to peak of 15 minutes postinjection (although there are no data on earlier time points). 10 PET studies in baboons, published by the same group, showed that the time to peak happened before 15 minutes after [11C]JHU75528. 10 Other CB1 radiotracers showed similar behavior with a time to peak before 20 minutes postinjection. 12
Image analysis was performed evaluating the whole brain because image resolution did not allow making a clear delineation of small brain regions. In addition, brain uptake was quite homogeneous, making the region localization even more difficult compared to other tracers with a clear and unique target region, such as [11C]raclopride, for the dopamine type 2 receptors 17 or [11C]PIB for the amyloid plaques. 18 The images from the autoradiographic assay showed a slight heterogeneous binding across different brain regions. The quantification results indicated differences in regional binding similar to those observed by other authors using a different methodology. 19 Image SUV quantification showed a clear difference between baseline and blocking studies in WT animals but not in KO animals (see Table 1). The average percentage decrease in brain uptake in WT animals subjected to rimonabant pretreatment was 50%. The decrease in mouse brain uptake measured by Horti and colleagues was higher by using an ex vivo dissection-based approach. 10 This methodology allows us to measure radiotracer accumulation in small regions with more precision. PET studies performed in small animals are affected by the system resolution and the mass effect.
The first limitation in this study affects image quantification because small subregions cannot be defined. Studies in rats would represent a clear improvement to avoid this limitation owing to the larger brain size even though studies in mice are mandatory because several disease models are based on genetically modified mice. On the other hand, the total injected mass affects the measurement because it is related to the fact that the injected radiotracer dose can induce a receptor occupancy per se. Calculations based on the reported densities of CB1 in mice 8 and the injected mass in the baseline experiment in WT animals (mean 0.65 ± 0.08 nmol) indicated that the maximum expected receptor occupancy owing to the mass injected was below 30%. Nevertheless, reductions of this range (65%) were also measured with [11C]MePPEP 12 when WT mice were compared to KO mice in trace conditions. Moreover, PET studies performed in baboons showed an average decrease in the binding potential of about 50% with rimonabant pretreatment. 10
The fact that we obtained the same results independently of the image summed interval used (30 to 60 minutes or 60 to 90 minutes) could be due to the fact that the tracer clearance is quite slow in WT animals and stable during the whole acquisition period (90 minutes). Actually, this can represent an advantage because image acquisition might be shortened by just acquiring 30 minutes and even considering using the same radiotracer synthesis for two sequential image studies. In fact, the high cost of [11C] radiotracer synthesis hampers [11C] radiotracer use in animal studies. By using only a 30-minute acquisition length, double the number of animals could be scanned with the same number of syntheses.
The approximation used to calculate the time of transient equilibrium gives only a rough estimate but seems to indicate that the maximum binding potential is reached before 90 minutes postinjection as opposed to the results reported by Horti and colleagues. 10 No doubt, further studies in rats and PET could help elucidate this point. We evaluated the whole brain region in mice, which can underestimate the time to transient equilibrium. Nevertheless, baboon PET data support the idea that transient equilibrium has been reached before 90 minutes postinjection (if one estimates the ratio of specific to nonspecific uptake from the published data). 10 Other CB1 radiotracers, such as [18F]MK9470, showed a slower kinetics, reaching a plateau 120 minutes postinjection in humans. 11 [11C]MePPEP in mice also peaks before 90 minutes postinjection. 16
Taken together, the results of this study support the feasibility of using PET technology to study the CB1 receptor in vivo in the brain of genetically modified mice. Interestingly, [11C]JHU75528 can be used to investigate the CB receptor system and assess the effect of new drugs and treatments in preclinical studies. In fact, the present work presented the kinetics of the radiotracer in the mouse brain and this binding pattern, which is quite homogeneous between the different brain regions. Finally, we have demonstrated that in mice, the specific binding observed for [11C]JHU75528 corresponds completely to the CB1 receptor.
Footnotes
Acknowledgments
Financial disclosure of authors: This study was partly funded by grants PHECOMP (LHSM CT 2007-037669) and PS09/02620 and PS09/02217 from the Fondo de Investigación Sanitarias (FIS)-Instituto de Salud Carlos III. In addition, X.J. is the recipient of the “Torres Quevedo” fellowship program from the Ministerio Ciencia e Innovación, E.M.-G. is a “Sara Borrell” postdoctoral fellow from the FIS-Instituto de Salud Carlos III, and A.B. is a predoctoral fellow from Generalitat Catalunya-TALÈNCIA.
Financial disclosure of reviewers: None reported.