
Abstract
This report describes the biologic evaluations of [99mTc(HYNIC-3P-RGD2)(tricine)(TPPTS)] (99mTc-3P-RGD2: 6-hydrazinonicotinyl; 3P-RGD2 = PEG4-E[PEG4-c(RGDfK)]2; PEG4 = 15-amino-4,7,10,13-tetraoxapentadecanoic acid; and TPPTS = trisodium triphenylpho-sphine-3,3′,3“-trisulfonate), [99mTc(HYNIC-3G-RGD2)(tricine)(TPPTS)] (99mTc-3G-RGD2: 3G-RGD2 = G3-E[G3-c(RGDfK)]2 and G3 = Gly-Gly-Gly), and 99mTcO(MAG2−3G-RGD2) (MAG2 = mercaptoacetylglycylglycyl) as radiotracers for noninvasive imaging of tumor integrin αvβ3 expression in five xenografted tumor-bearing models. Biodistribution and imaging studies were performed in athymic nude mice bearing U87MG, MDA-MB-435, A549, HT29, or PC-3 tumor xenografts. Immunochemistry was performed using the cultured primary tumor cells and xenografted tumor tissues. It was found that the radiotracer tumor uptake followed the trend U87MG > MDA-MB-435 ≈ HT29 ≈ A549 > PC-3. The total integrin β3 expression levels followed the general trend: U87MG > MDA-MB-435 ≈ A549~HT29 > PC-3. There is a linear relationship between the radiotracer injected dose per gram tumor uptake and the total integrin β3 expression levels. On the basis of these, it was concluded that radiotracer tumor uptake is contributed by integrin αVβ3 expressed on tumor cells and activated endothelial cells of the tumor neovasculature. 99mTc-3P-RGD2 has the capability to monitor integrin αvβ3 expression in a noninvasive fashion.
RADIOLABELED CYCLIC RGD (ARGININE-GLYCINE-ASPARTIC ACID) PEPTIDES represent a new class of radiotracers that target the integrin αvβ3 expressed on tumor cells and activated endothelial cells of the tumor neovasculature.1–9 Noninvasive measurement of integrin αvβ3 expression is highly desirable for patient selection before antiangiogenic treatment and for more effective monitoring of therapeutic efficacy in integrin αvβ3–positive cancer patients.10–12 Over the last several years, many multimeric cyclic RGD peptides, such as E[c(RGDfK)]2 (RGD2) and E{E[c(RGDfK)]2}2 (RGD4), have been used to maximize integrin αvβ3 binding affinity and radiotracer tumor uptake.13–24 It has been demonstrated that radiolabeled (99mTc, 18F, 64Cu, 68Ga, and 111In) multimeric cyclic RGD peptides have better tumor-targeting capability, as evidenced by their higher tumor uptake, with longer tumor retention time than their monomeric counterparts.
Recently, we reported a series of 99mTc-labeled cyclic RGD dimers, examples of which are shown in Figure 1 (99mTc-3P-RGD2: 3P-RGD2 = PEG4-E[PEG4-c(RGDfK)]2, PEG4 = 15-amino-4,7,10,13-tetraoxa-pentadecanoic acid; and 99mTc-3G-RGD2, 3G-RGD2 = G3-E[G3-c(RGDfK)]2, G3 = Gly-Gly-Gly), as new radiotracers for tumor imaging in athymic nude mice bearing U87MG glioma and MDA-MB-435 breast cancer xenografts.25,26 The integrin αvβ3 binding assay showed that 3P-RGD2 and 3G-RGD2 are bivalent, as evidenced by their higher binding affinity than that of RGD2. It has been clearly demonstrated that the addition of PEG4 and G3 linkers is responsible for the improved tumor uptake of 99mTc-3P-RGD2 and 99mTc-3G-RGD2 owing to their bivalency in binding to integrin αvβ3 and their faster clearance kinetics from the liver and kidneys. Similar results were obtained for other radiotracers,27–31 such as 99mTcO(MAG2−3G-RGD2) (see Figure 1: MAG2 = mercaptoacetylglycylglycyl),30 99mTcO(MAG2−3P-RGD2), 31 64Cu(DOTA-3P-RGD2) (DOTA = 1,4,7,10-tetraazacyclododecane-1,4,7,10-tetracetic acid), and 64Cu(DOTA-3G-RGD2). 27 99mTc-3P-RGD2 has been selected as a candidate for clinical evaluations because of its high tumor uptake, long tumor retention time, and high metabolic stability in athymic nude mice bearing U87MG glioma and MDA-MB-435 breast cancer xenografts. 32

Cyclic RGD peptide dimers and their 99mTc complexes.
It is well established that integrin αvβ3 is highly expressed on tumor cells and activated endothelial cells of the tumor neovasculature.33–39 It is also known that integrin αvβ3 expression is quite heterogeneous among different tumor types. 40 It has been demonstrated that radiolabeled cyclic RGD peptides are able to bind to integrin αvβ3 for noninvasive imaging of solid tumors in cancer patients.41–45 The ability to visualize integrin αvβ3 expression provides new opportunities to characterize tumor angiogenesis noninvasively, to select appropriate patients for antiangiogenic treatment, and to monitor the therapeutic efficacy of antiangiogenic drugs in cancer patients. Although many radiolabeled cyclic RGD peptides have been developed for integrin αvβ3 imaging, reports on the correlation between integrin αvβ3 expression levels and radiotracer tumor uptake are relatively rare. Haubner and colleagues first investigated the relationship between tumor uptake of [18F]galacto-RGD and integrin αvβ3 expression levels in several subcutaneous tumor-bearing models. 41 The tumor to muscle ratios obtained from micro–positron emission tomographic (PET) images and direct tissue sampling were compared with relative integrin αv expression measured by Western blot analysis. In clinical studies, Beer and colleagues found that there was a significant correlation between the standard uptake values (SUVs) of [18F]galacto-RGD with microvessel density and integrin αvβ3 intensity from immunohistochemical staining studies. 42 , 45 Zhang and colleagues also explored the relationship between the radiotracer's SUVs and the integrin expression in multiple tumor models. 46 Although a good correlation was reported, the integrin αvβ3 expressed on the neovasculature was completely ignored.
In this study, we evaluated 99mTc-3P-RGD2 for its ability to monitor integrin αvβ3 expression levels in five different xenografted tumor-bearing animal models (U87MG glioma, MDA-MB-435 breast cancer, A549 lung cancer, HT29 colon cancer, and PC-3 prostate cancer). We were interested in these five human tumor cell lines because they have different levels of integrin αvβ3 expression. 46 For comparison purposes, 99mTc-3G-RGD2 and 99mTcO(MAG2−3G-RGD2) were evaluated in the same animal models. The main objective of this study was to establish the relationship between tumor uptake and integrin αvβ3 expression levels regardless of the radiotracer's identity and to characterize the integrin αvβ3 expression levels on both tumor cells and activated endothelial cells of tumor neovasculature.
Experimental
Materials and Methods
Chemicals were purchased from Sigma-Aldrich (St. Louis, MO). 99mTc-3P-RGD2, 99mTc-3G-RGD2, and 99mTcO (MAG2−3G-RGD2) were prepared according to methods described in the literature.25,26,28 Na99mTcO4 was obtained from a commercial DuPont Pharma 99Mo/99mTc generator (North Billerica, MA). The radio-high-performance liquid chromatography (HPLC) method used the LabAlliance (State College, PA) HPLC system equipped with a β-ram IN-US detector and Zorbax C18 column (Agilent Technologies, Wilmington, DE) (4.6 mm × 250 mm, 300 Å pore size). The flow rate was 1 mL/min. The mobile phase was isocratic with 90% solvent A (25 mM NH4OAc buffer, pH = 5.0) and 10% solvent B (acetonitrile) at 0 to 2 minutes, followed by a gradient mobile phase going from 10% solvent B at 2 minutes to 15% solvent B at 5 minutes and 20% solvent B at 20 minutes.
Animal Model
Biodistribution and imaging studies were performed in compliance with the National Institutes of Health animal experimentation guidelines.
47
The protocol was approved by the Purdue University Animal Care and Use Committee. All human tumor cell lines (U87MG, MDA-MB-435, A549, HT29, and PC-3) were obtained from American Type Culture Collection (ATCC, Manassas, VA). The U87MG human glioma cells were cultured in Minimum Essential Medium Eagle (Sigma-Aldrich) with Earle's Balanced Salt Solution (nonessential amino acids sodium pyruvate; Invitrogen, Carlsbad, CA) (ATCC). PC-3 and A549 cancer cells were cultured in F-12 medium (GIBCO, Grand Island, NY). MDA-MB-435 and HT29 cancer cells were grown in RPMI 1640 medium with
Biodistribution Protocol
Three female athymic nude mice (weight 20–25 g) bearing the U87MG, MDA-MB-435, A549, HT29, or PC-3 tumor xenografts were administered with the 99mTc radiotracer (≈2.5 μCi per mouse in 0.1 mL saline) via tail vein. Animals were sacrificed at 60 minutes postinjection. Tumors were excised, dried with absorbent tissue, weighed, and counted on a PerkinElmer Wizard −1480 automatic gamma-counter (Shelton, CT). This experiment was performed twice. The tumor uptake was calculated as a percentage of the injected dose per gram of wet tissue mass (%ID/g), and the biodistribution data were presented as the mean plus the standard deviation from six tumor-bearing animals in each group.
Planar Imaging
Planar imaging was performed using the athymic nude mice (n = 3) bearing U87MG, MDA-MB-435, A549, HT29, or PC-3 tumor xenografts. Each animal was administered with ≈300 μCi of 99mTc radiotracer in 0.1 mL saline via tail vein injection. Animals were anesthetized with intraperitoneal injection of ketamine (80 mg/kg) and xylazine (12 mg/kg) and were then placed supine on a custom-made single-head mini gamma camera (Diagnostic Services Inc., Middlesex, NJ) equipped with a parallel-hole, low-energy, and high-resolution collimator. Anterior images were acquired at 15, 30, 60, and 120 minutes postinjection and stored digitally in a 128 × 128 matrix. The acquisition count limits were set at 300 K. After completion of imaging, animals were sacrificed by sodium pentobarbital overdose (≈200 mg/kg). The whole-body planar images were selected and reported without filtration.
Cultured Primary Tumor Cells
Tumor tissues (U87MG, MDA-MB-435, A549, HT29, or PC-3) were excised from the tumor-bearing mice and were immersed in a growth medium immediately after gamma counting. The tumor tissues were rinsed twice with the Hank's solution and dissected into small pieces with razor blades. Small tumor pieces were digested with 0.25% trypsin (1 mM ethylenediaminetetraacetic acid [EDTA], without Ca2+ and Mg2+) solution at 37°C for 30 minutes, followed by vigorous pipeting and filtration through a 40 urn mesh nylon screen. After centrifugation at 1,000 rpm for 5 minutes, the pellet was resuspended in the culture medium and incubated at 37°C in a humidified atmosphere containing 5% CO2. The purity of tumor cells could reach ≈90% after two passages, and the third passage was used for immunostaining studies.
Cellular Immunostaining
For staining studies, the primary tumor cells (U87MG, MDA-MB-435, A549, HT29, and PC-3) were seeded into eight-well chamber slides. Cells were allowed to attach and spread for > 24 hours. The tumor cells were fixed in −20°C methanol for 5 minutes and rinsed with phosphate-buffered saline (PBS). Cells were incubated in 5% bovine serum albumin for 30 minutes to block nonspecific binding and then were added to Alexa Fluor 488–conjugated mouse antihuman integrin αvβ3 monoclonal antibody LM609 (1:100; Millipore, Billerica, MA) for 1 hour at room temperature or incubated with rabbit antihuman and murine integrin β3 antibody followed by incubation with Alexa Fluor 594–conjugated goat antirabbit IgG (Santa Cruz Biotechnology, Inc., Santa Cruz, CA). After washing with PBS, the slides were mounted with 4′,6-diamidino-2-phenylindole (DAPI)-Fluoromount-G (Southern-Biotech, Birmingham, AL). The same procedure, except the primary antibody was replaced by PBS, served as the negative control. The same experiment was repeated three times independently. This procedure was also used for cellular fluorescent staining studies with the human U87MG, MDA-MB-435, A549, HT29, and PC-3 cell lines.
Tumor Tissue Immunohistochemistry
For tissue staining studies, the tumor tissues were harvested from the tumor-bearing mice and were immediately snap-frozen in the optical cutting temperature solution. Tumor tissues were then cut into slices (5 urn). After thorough drying at room temperature, the slides were fixed with ice-cold acetone for 10 minutes and dried in the air for 20 minutes at room temperature. The sections were blocked with 10% goat serum for 30 minutes at room temperature and then were incubated with the hamster anti–integrin β3 antibody (1:100; BD Biosciences, San Jose, CA) and rat anti-CD31 antibody (1:100; BD Biosciences) for 1 hour at room temperature. After incubating with the Cy3-conjugated goat antihamster and fluorescein isothiocyanate (FITC)-conjugated goat antirat secondary antibodies (1:100; Jackson ImmunoResearch Inc., West Grove, PA) and washing with PBS, the fluorescence was visualized with a Nikon fluorescence microscope (Nikon Instruments, Melville, NY). Quantitative analysis of CD31 and the total β3 expression levels was performed after immunostaining of the tumor tissues. All pictures were taken under 100× magnification with the same exposure time. Brightness and contrast adjustments were made equally to all images. The average area of positively stained CD31 or β3 on cryostat sections from at least 15 randomly selected fields in each group was calculated to assess the relative expression in the tumor tissues by National Institutes of Health ImageJ software (Bethesda, MD). Experiments were repeated three times independently. The fluorescent density was expressed as a percentage of the total area and presented as the mean ± SD. The fluorescent density data were plotted against the radiotracer %ID/g uptake (radioactivity density).
Data and Statistical Analysis
Analysis of the expression of CD31 and total β3 was derived from at least 15 different regions under 100× magnification and expressed as mean ± SD. Statistical analysis was performed by one-way analysis of variance (ANOVA) followed by the Newman-Keuls test for multiple comparisons. The level of significance was set at p < .05.
Results
Biodistribution
In this study, we used five animal models (U87MG, MDA-MB-435, A549, HT29, and PC-3) to compare the tumor uptake of three 99mTc radiotracers. As illustrated in Figure 2, the U87MG glioma uptake was the highest (99mTc-3P-RGD2: 11.2 ± 1.97 %ID/g; 99mTc-3G-RGD2: 11.73 ± 2.2 %ID/g; and 99mTcO(MAG2−3G-RGD2): 8.2 ± 1.74 %ID/g). In contrast, the PC-3 tumor uptake was the lowest (2.29 ± 0.64 %ID/g, 1.92 ± 0.17 %ID/g, 1.12 ± 0.35%ID/g for 99mTc-3P-RGD2, 99mTc-3G-RGD2, and 99mTcO(MAG2−3G-RGD2), respectively). Their uptake in the xenografted MDA-MB-435, A549, and HT29 tumors was moderate and comparable at 60 minutes postinjection within the experimental error. The tumor uptake of 99mTc-3P-RGD2 followed a trend: U87MG (11.2 ± 1.97%ID/g) > MDA-MB-435 (6.1 ± 0.79 %ID/g) ≈ HT29 (7.3 ± 1.78 %ID/g) ≈ A549 (5.5 ± 1.46 %ID/g) >> PC-3 (2.29 ± 0.64 %ID/g). The same general trend (see Figure 2) was observed for 99mTc-3G-RGD2 and 99mTcO(MAG2−3G-RGD2).
Planar Imaging
To further confirm the results from biodistribution studies, we obtained whole-body images of the athymic nude mice bearing U87MG, MDA-MB-435, A549, HT29, and PC-3 xenografts. Once again, the U87MG tumors had the highest activity accumulation with the best contrast (Figure 3). PC-3 tumors were not clearly visualized owing to low tumor uptake. The MDA-MB-435, A549, and HT29 tumors were also clearly visible for all three 99mTc radiotracers. The tumor-to-background (T/B) contrast was not as good as that in the glioma-bearing animal model, but it was much better than that in the PC-3 model. The radiotracer tumor uptake followed a general trend: U87MG > MDA-MB-435 ≈ HT29 ≈ A549 > PC-3.
Integrin αvβ3 Expression Levels on Tumor Cells
To understand differences in the radiotracer tumor uptake, the integrin αvβ3 expression patterns were examined in the cultured primary tumor cells extracted from tumor-bearing mice. It is known that β3 attaches to αIIb in addition to αv. Given that αIIbβ3 is exclusively expressed on activated platelets,48,49 staining of β3 can correlate αvβ3 expression in cultured primary tumor cells. Figure 4 shows the results from cellular immunostaining studies. Apparently, the integrin αvβ3 expression levels followed the order of U87MG > MDA-MB-435 > A549 ≈ HT29 > PC-3 (see Figure 4, left) in the cultured primary tumor cells using LM609 antibody. A similar trend was seen with the antibody against the β3 subunit (see Figure 4, right). The same results were obtained for the human cell lines with LM609 and the antibody against the β3 subunit (Figure S1A). Western blot data (see supplementary Figure S1B and Figure S2A) further confirmed the results from immunostaining studies. In Western blot studies, the antibody detects the total integrin β3, including the 97, 110, and 130 kilodalton variants. 50 Integrin αv expression was also evaluated. In all cases, PC-3 tumor cells had the lowest αv expression level (see supplementary Figure S2A).

The uptake of 99mTc-3P-RGD2, 99mTc-3G-RGD2, and 99mTcO(MAG2−3G-RGD2) in athymic nude mice bearing U87MG, MDA-MB-435, A549, HT29, and PC-3 tumor xenografts (N = 6) at 60 minutes postinjection. For each group, the 99mTc radiotracer (≈2.5 μCi in 0.1 mL saline) was administered via tail vein. The tumor uptake data are expressed as %ID/g ± SD. *p < .05, significantly different from all the other groups; †p < .05, significantly different from the U87MG group; #p < .05, significantly different from the PC3 group.

The representative 60-minute whole-body planar images of the tumor-bearing mice (U87MG, MDA-MB-435, A549, HT29, and PC-3) administered with 300 μCi of 99mTc-3P-RGD2, 99mTc-3G-RGD2, and 99mTcO(MAG2−3G-RGD2). Experiments were repeated three times in each group, with similar results. Arrows indicate the presence of tumors in planar images.
Integrin αvβ3 Expression Levels on Tumor Tissue
Immunohistochemistry was performed to determine the total integrin β3 expression levels on both the tumor cells and tumor neovasculature. CD31 was used as the endothelial biomarker to assess blood vessel density. Figure 5 illustrates the microscopic fluorescence images of the xenografted tumor tissues (U87MG, MDA-MB-435, A549, HT29, and PC-3) labeled with anti–integrin β3 (red) or anti-CD31 (green) antibody. In the overlay pictures, the green color indicates the presence of blood vessels, the red color indicates the presence of integrin β3, and the yellow color indicates integrin β3 expressed on neovasculature. Figure 6 shows the quantitative analysis of CD31 (see Figure 6A) and β3 (see Figure 6B) for five different xenografted tumor tissues (U87MG, MDA-MB-435, A549, HT29, and PC-3). The total β3 expression (tumor cells and neovasculature) was defined by the percentage of the red-colored area over the total area in each slice of tumor tissue. Blood vessel density (CD31 expression level) was quantified by measuring the percentage of the green-colored area over the total area in each tumor section slide. We found that the integrin β3 expression level was the highest in U87MG glioma tissues and the lowest in PC3 tumor tissues. The total integrin β3 expression levels followed the trend U87MG > MDA-MB-435 ≈ A549 ≈ HT29 > PC-3 (see Figure 6B), which is completely consistent with the ex vivo biodistribution data (see Figure 2). These results were further confirmed by the results from Western blot analysis of the tumor tissues (see supplementary Figure S2b). In contrast, the blood vessel density was very high in U87MG glioma and HT29 tumor tissues, whereas it was very low in PC-3 tumor tissues. The CD31 expression levels followed the order of U87MG ≈ HT29 > MDA-MB-435 ≈ A549 > PC-3 (see Figure 6A).

Representative fluorescence microscopic images of the cultured primary tumor cells extracted from athymic nude mice bearing U87MG, MDA-MB-435, A549, HT29, and PC-3 tumor xenografts stained with anti–integrin αvβ3 (green) and anti-β3 (red) antibodies. The blue color indicates the nuclei (DAPI). After fixation, cells were washed with PBS and incubated with Alexa Fluor 488–conjugated mouse antihuman αvβ3 monoclonal antibody LM609 for 1 hour or with rabbit antihuman and antimurine integrin β3 antibody followed by incubation with Alexa Fluor 594–conjugated goat antirabbit IgG. Images were acquired by a Nikon digital camera (400× magnification).
Relationship between Tumor Uptake and Integrin β3 Expression Levels
Figure 7 illustrates the plots of tumor uptake (%ID/g: radioactivity density) for 99mTc-3P-RGD2 (top), 99mTc-3G-RGD2 (middle), and 99mTcO(MAG2−3G-RGD2) (bottom) and the integrin β3 expression levels (fluorescence density) in the xenografted U87MG, MDA-MB-435, A549, HT29, and PC-3 tumor tissues. Apparently, there is a linear relationship between the radiotracer %ID/g tumor uptake and the integrin β3 expression levels, with R2 being .95, .92, and 0.96, respectively.
Discussion
In this study, we evaluated 99mTc-3P-RGD2, 99mTc-3G-RGD2, and 99mTcO(MAG2−3G-RGD2) as the integrin αvβ3–targeted radiotracers in five different tumor-bearing animal models. Biodistribution data indicate that all three 99mTc radiotracers have the highest uptake in U87MG glioma and the lowest uptake in PC-3 tumors. The radiotracer tumor uptake followed the general trend of U87MG > MDA-MB-435 ≈ HT29 ≈ A549 > PC-3 (see Figure 2), which was further confirmed by planar imaging studies (see Figure 3). It was also found that the cultured primary U87MG tumor cells and U87MG tumor tissues had the highest integrin αvβ3 expression, whereas the cultured primary PC-3 tumor cells and PC-3 tumor tissues had the lowest integrin αvβ3 expression (see Figure 4). Western blot data (see supplementary Figure S2A) are completely consistent with the results from immunostaining studies (see Figure 4). The integrin αvβ3 levels on the cultured primary tumor cells followed the order of U87MG > MDA-MB-435 > HT29 ≈ A549 > PC-3, which seems inconsistent with the general trend of the radiotracer tumor uptake (see Figure 2). Thus, the contribution of the tumor neovasculature to the total integrin αvβ3 expression must be taken into account when comparing the radiotracer tumor uptake difference in various tumor-bearing animal models.
Integrin αvβ3 is overexpressed on both tumor cells and activated endothelial cells of the tumor neovasculature.33–39 In this study, we found that the total integrin αvβ3 expression levels follow the order of U87MG > MDA-MB-435 ≈ A549 ≈ HT29 > PC-3 (see Figure 6B). Even though the integrin αvβ3 expressed on the cultured primary HT29 colon cancer cells is not as high as that on MDA-MB-435 breast cancer cells (see Figure 3), the higher blood vessel density (see Figure 6A) in HT29 colon tumor tissues compared to that on the MDA-MB-435 breast tumor tissues might explain the similar radiotracer uptake in the xenografted MDA-MB-435 and HT29 tumors (see Figure 2). On the basis of these results, we believe that the integrin αvβ3 expressed on both tumor cells and the neovasculature contributes to the tumor uptake of 99mTc radiotracers.
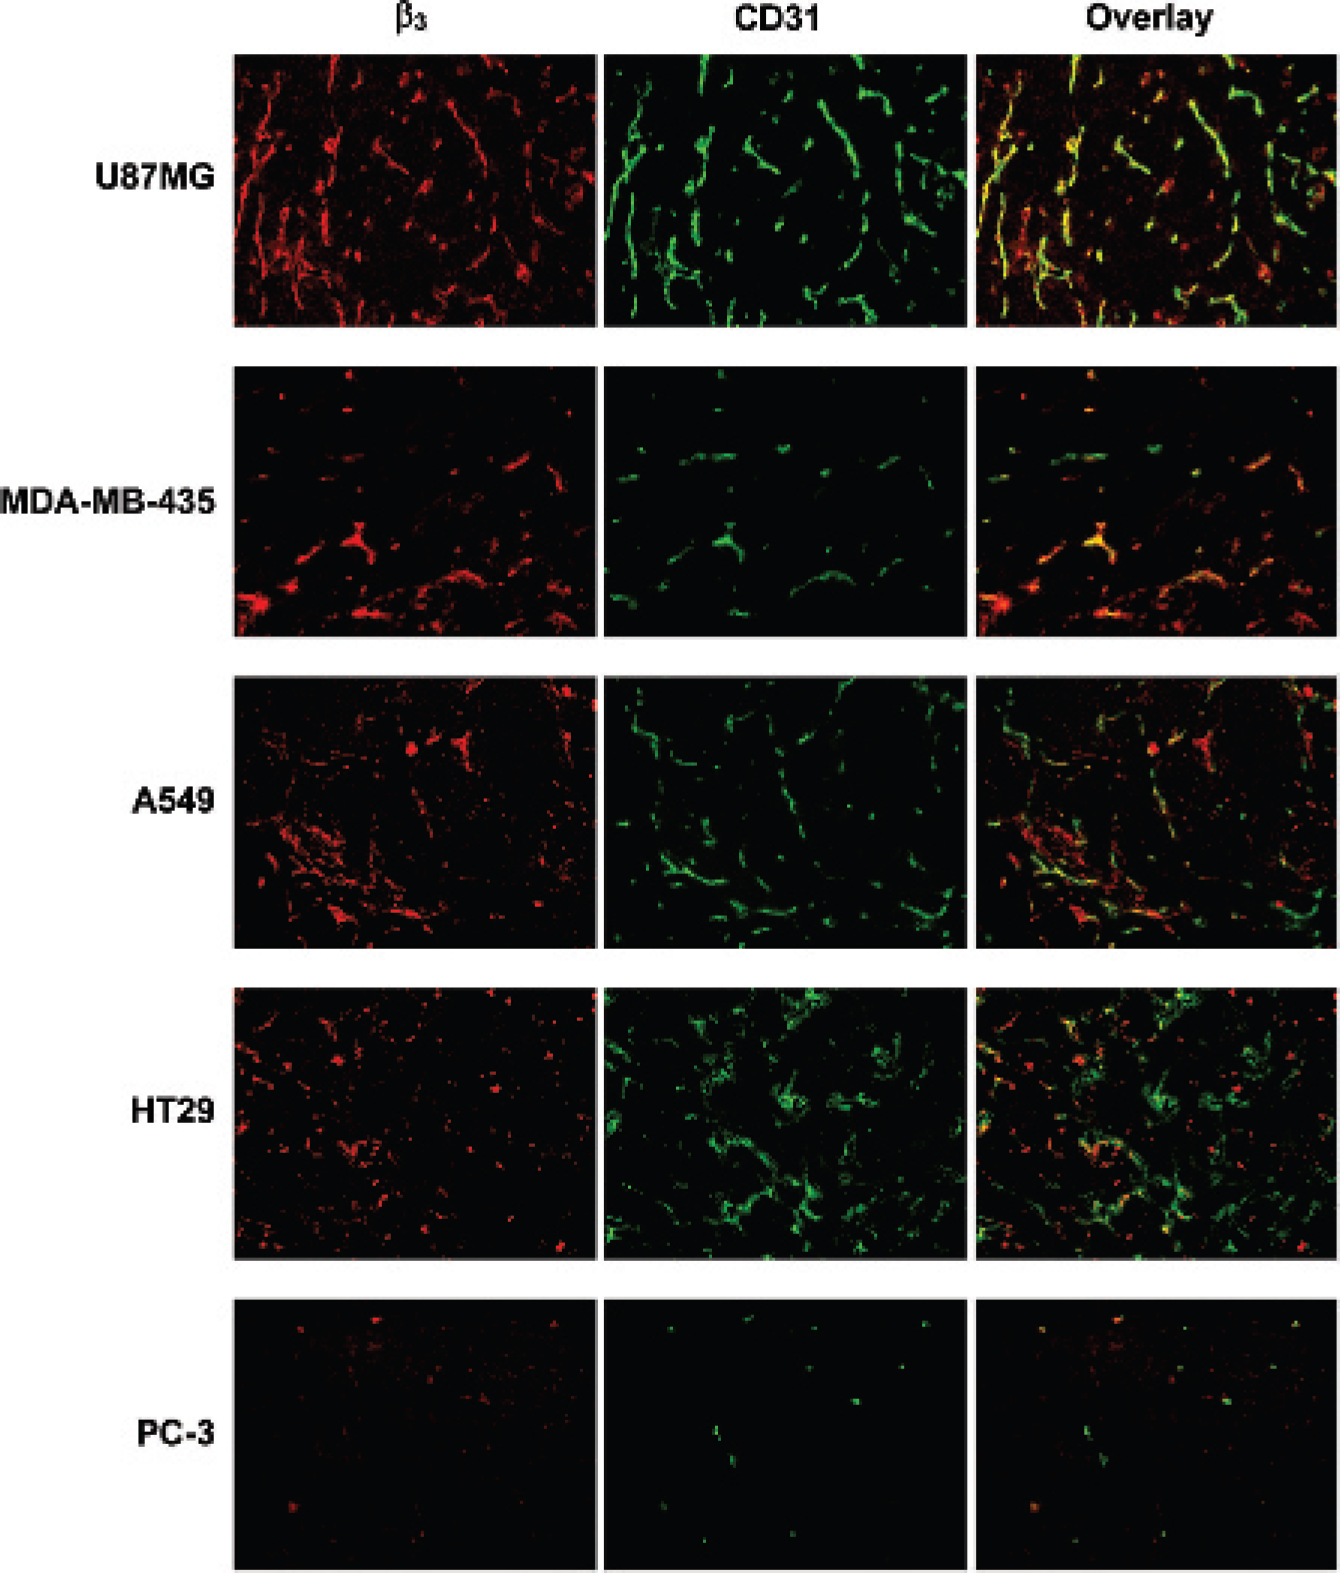
Representative microscopic fluorescence images of the xenografted tumor tissues (U87MG, MDA-MB-435, A549, HT29, and PC-3) labeled with anti–integrin β3 (red) or anti-CD31 (green) antibody or combination of the two. Yellow color, red integrin β3 staining merged with green CD31 staining indicates the presence of integrin β3 on the tumor neovasculature. After fixation, the tissues were incubated with hamster anti–integrin β3 and rat anti-CD31 antibodies for 1 hour followed by incubation with Cy3-conjugated goat antihamster and FITC-conjugated goat antirat secondary antibodies. Images were acquired by a Nikon fluorescence microscope (200× magnification).
The linear relationship (see Figure 7) between the tumor uptake (%ID/g) and integrin αvβ3 density strongly suggests that 99mTc-3P-RGD2, 99mTc-3G-RGD2, and 99mTcO(MAG2−3G-RGD2) are useful for noninvasive monitoring of integrin αvβ3 expression levels in cancer patients. This conclusion is completely consistent with the results from clinical studies with [18F]galacto-RGD in cancer patients.41–45 The ability to noninvasively quantify or estimate the integrin αvβ3 level provides new opportunities to select patients more appropriately for planning antiangiogenic treatment.10–12 For example, if the patient shows significant tumor uptake of the radiotracer (PET or single-photon emission computed tomography [SPECT]) owing to high integrin αvβ3 expression, he or she would most likely be responsive to antiangiogenic treatment. Conversely, if the patient shows very little radiotracer tumor uptake, indicating low integrin αvβ3 expression, antiangiogenic therapy would not be effective regardless of the amount of antiangiogenic drug administered to the cancer patient.
The next question is how much of the contribution is from the tumor cells or the neovasculature. Based on the results from this study, we believe that the contribution from the tumor cell integrin αvβ3 depends largely on the tumor type. If the tumor has high levels of integrin αvβ3 expression on tumor cells and neovasculature (eg, U87MG glioma), the radiotracer would have high tumor uptake. Conversely, if the tumor has low integrin αvβ3 expression levels on tumor cells and neovasculature (eg, PC-3 prostate cancer), the radiotracer tumor uptake would be low. The xenografted U87MG and HT29 tumor tissues share a similar blood vessel density (see Figure 6A), but the radiotracer tumor uptake (see Figure 2) in U87MG glioma is significantly higher than that in HT29 tumor owing to the higher integrin αvβ3 levels on U87MG glioma cells (see Figure 4). Xenografted MDA-MB-435, A549, and HT29 tumors have similar integrin β3 levels (see Figure 6B) and share almost identical tumor uptake (see Figure 3). The total integrin αvβ3 expression level is responsible for the αvβ3–targeted radiotracer tumor uptake. It must be noted that not all blood vessels in tumor tissues express integrin αvβ3. For example, many blood vessels have little expression of integrin β3 in U87MG and HT29 tumor xenografts, as indicated by the green-colored area in the overlay images, whereas the majority of the blood vessels in the MDA-MB-435 and A549 tumor xenografts express integrin β3, as indicated by the presence of more yellow-colored area. Given that integrin β3 is expressed in tumor microvessels, not mature large blood vessels, caution must be taken when correlating the radiotracer tumor uptake and blood vessel density.

Quantitative analysis of CD31 (A) and β3 (B) immunostaining from five different xenografted tumor tissues (U87MG, MDA-MB-435, A549, HT29, and PC-3). CD31 expression is represented by the percentage of green area over the total area in each slice of tissue. The total integrin β3 expression (tumor cells and neovasculature) is represented by the percentage of red area over the total area in each slice of tumor tissue. Each data point was derived from at least 15 different areas of the same tissue (100× magnification). Experiments were repeated three times independently with similar results. Values are means ± SD. *p < .05, significantly different from all the other groups; †p < .05, significantly different from the U87MG group; #p < .05, significantly different from the PC-3 group.
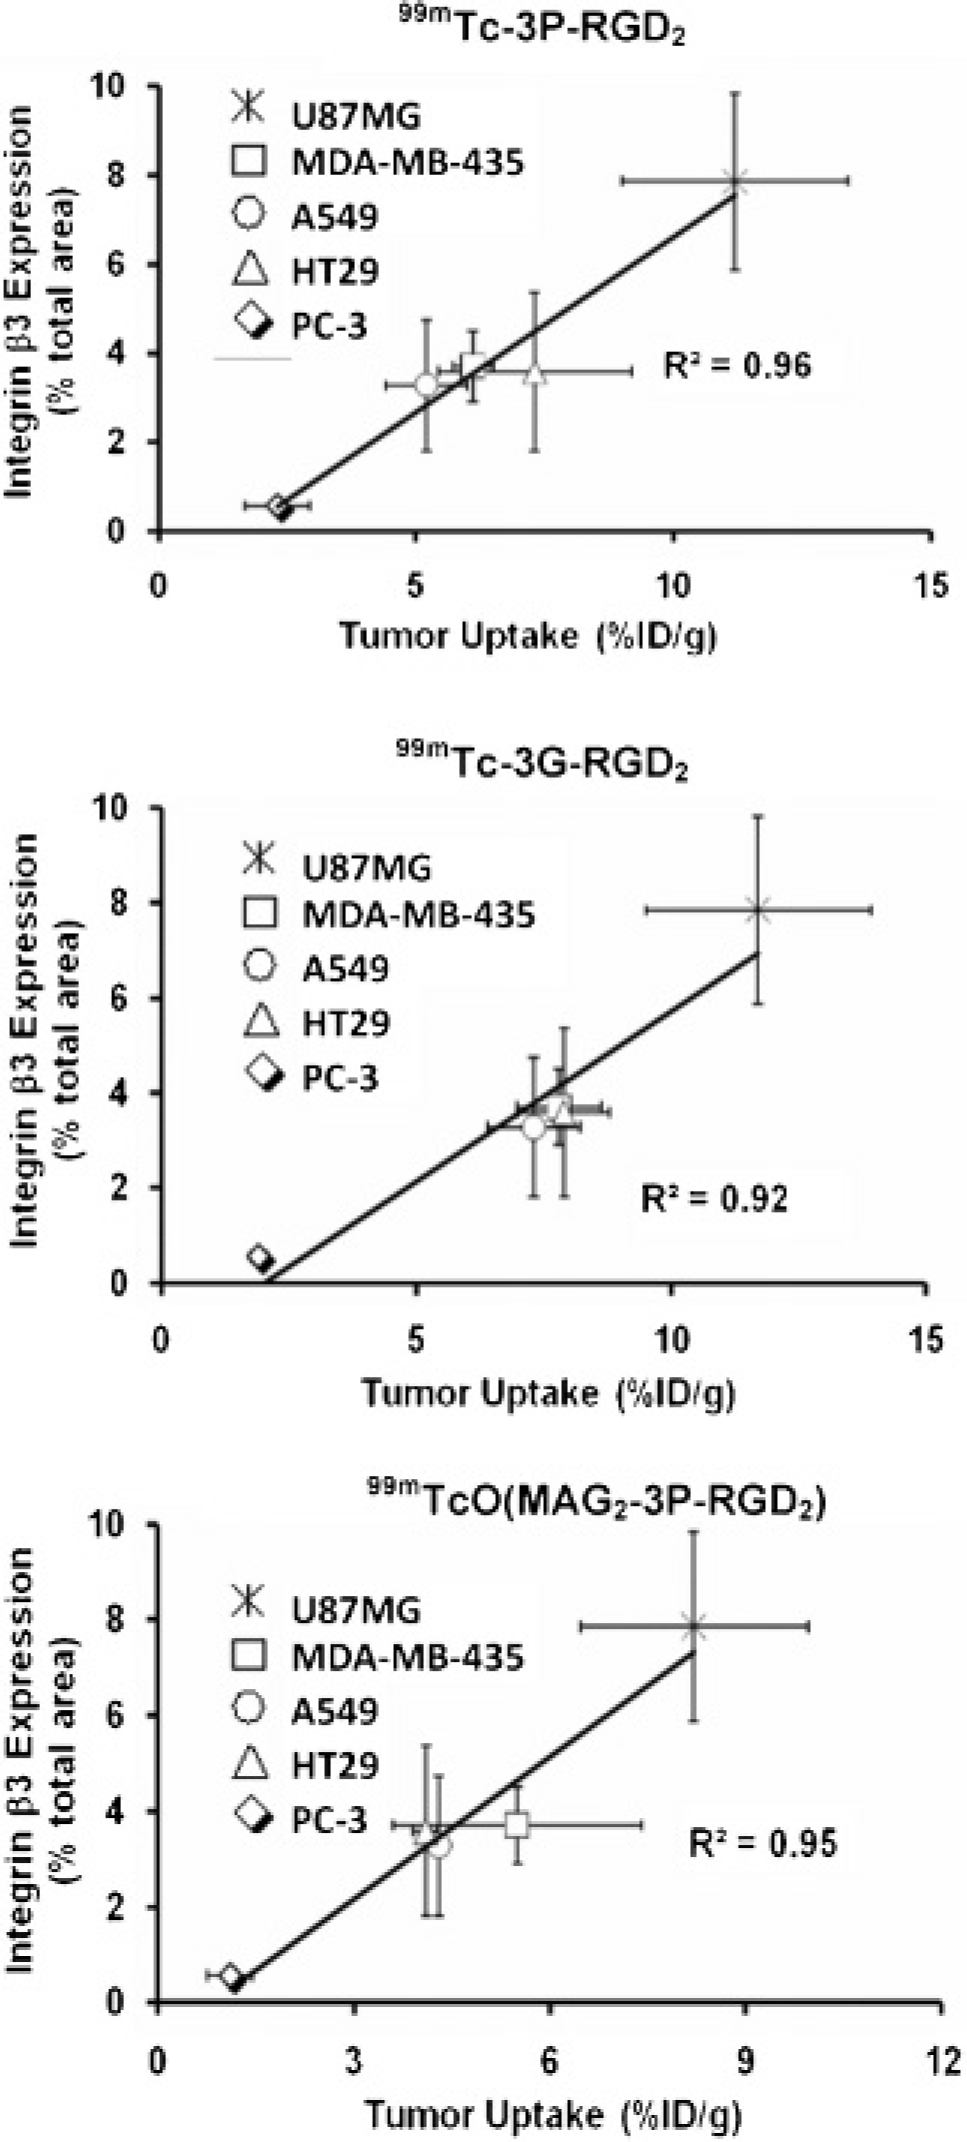
Relationship between tumor uptake (%ID/g: radioactivity density) and the relative β3 expression (% red color area over the total area in each slice of tumor tissue: fluorescence density) in five different xenografted tumors (U87MG, MDA-MB-435, A549, HT29, and PC-3).
It is important to note that the fluorescence distribution in the xenografted tumor tissues is not homogeneous. In many cases, the distribution pattern was significantly different on two tumors from the same animal or even in different areas of the same tumor tissue. In fact, the fluorescence distribution heterogeneity is characteristic of all five xenografted tumors (U87MG, MDA-MB-435, A549, HT29, and PC-3). This is also why we used the average area of positively stained β3 and CD31 on cryostat sections from at least 15 randomly selected fields in each group to assess the fluorescence density in the tumor tissues. This may also explain why radiotracer tumor uptake values often have such a large standard deviation in bio distribution studies (see Figure 3).
There are potential limitations to this study. First, the xenografted tumor models were established by subcutaneous injection of human tumor cells. Although the tumor-bearing animal models used in this study may not be representative of the microenvironment for the growth, invasion, and metastasis of human tumors, they are good enough for us to explore the relationship between radiotracer tumor uptake and integrin αvβ3 expression levels. Cellular staining data with LM609 suggest that cultured tumor primary cells are able to maintain many characteristics of human cancer cells. Second, quantification of the integrin αvβ3 heterodimer is extremely difficult because no Western blot techniques are currently available for the combined integrin αvβ3 subunits. In this study, we use “fluorescent density” from immunostaining studies to correlate the radiotracer tumor uptake (radioactivity density %ID/g) because quantification of absolute fluorescent intensity is very much operator dependent and subject to individual interpretation. Considering the “uncontrolled recovery rate” of the αv and β3 subunits from the xenografted tumor tissues when lysing the tissues, the results of Western blot studies are used only as supplementary information. Third, tumors of different sizes might have different integrin αvβ3 expression patterns. The expression levels of integrin αvβ3 and blood vessel endothelial cell biomarker CD31 only represent the status under specific experimental conditions, which is restricted by multiple factors, including animal species and sex, inoculation location, tumor cell type and culture conditions, tumor growth time, and tumor size. For example, the PC-3 cell line is known for low expression of integrin αvβ3. 51 However, the subcutaneous injection of PC-3 cells into the hindlimb of BALB/c nu/nu mice produced a higher level of angiogenesis. 52 Also, the higher level of integrin αvβ3 expression on activated endothelial cells in the xenografted tumor generated higher uptake of the imaging agent. 53 The slow progression and low density of the blood vessels in the PC-3 xenografted tumor shown in this study represent the outcome under particular experimental conditions (female athymic nude mice, subcutaneous injection in the shoulder flanks, etc.). We also found that PC-3 tumors grown in male mice had properties almost identical to those in female mice. Finally, further work needs to be done in cancer patients even though the linear relationship between tumor uptake (%ID/g) and integrin αvβ3 expression levels has been clearly established in the tumor-bearing animal models used in this study.
Conclusions
We evaluated 99mTc-3P-RGD2 for its ability to image integrin αvβ3 expression in xenografted U87MG, MDA-MB-435, A549, HT29, and PC-3 tumors. There are several significant findings from this study. First, the ex vivo biodistribution data indicate that 99mTc-3P-RGD2 has the highest uptake in U87MG glioma and the lowest uptake in PC-3 tumor. Its tumor uptake value followed the general trend: U87MG > MDA-MB-435 ≈ A549 ≈ HT29 > PC-3. The same general trend was observed for 99mTc-3G-RGD2 and 99mTcO(MAG2−3G-RGD2). Cellular and tumor tissue immunostaining studies indicate that U87MG glioma cells and U87MG glioma tissues have the highest integrin αvβ3 expression levels, whereas the PC-3 cells and PC-3 tumor tissues have little integrin αvβ3 expression. The integrin αvβ3 expression levels on the cultured primary tumor cells followed the order of U87MG > MDA-MB-435 > HT29 ≈ A549 > PC-3. The total integrin β3 expression levels, as determined by tissue staining, followed the general trend: U87MG > MDA-MB-435 ≈ A549 ≈ HT29 > PC-3. There is a linear relationship between radiotracer %ID/g tumor uptake and integrin β3 expression. Thus, we conclude that radiotracer tumor uptake is contributed by integrin αvβ3 expressed on both tumor cells and activated endothelial cells of the tumor neovasculature. 99mTc-3P-RGD2 is an excellent candidate for clinical evaluations because of its high tumor uptake, long tumor retention time, high metabolic stability, and ability to monitor integrin αvβ3 expression in a noninvasive fashion.
Footnotes
Acknowledgments
Financial disclosure of authors: This work was supported, in part, by Purdue University and research grants: R01 CA115883 from the National Cancer Institute and DE-FG02-08ER64684 from the Department of Energy.
Financial disclosure of reviewers: None reported.