
Abstract
To assess the suitability of asymmetric cyanine dyes for in vivo fluoro-optical molecular imaging, a comprehensive study on the influence of the number of negatively charged sulfonate groups governing the hydrophilicity of the DY-67x family of asymmetric cyanines was performed. Special attention was devoted to the plasma protein binding capacity and related pharmacokinetic properties. Four members of the DY-67x cyanine family composed of the same main chromophore, but substituted with a sequentially increasing number of sulfonate groups (n = 1−4; DY-675, DY-676, DY-677, DY-678, respectively), were incubated with plasma proteins dissolved in phosphate-buffered saline. Protein binding was assessed by absorption spectroscopy, gel electrophoresis, ultrafiltration, and dialysis. Distribution of dye in organs was studied by intraveneous injection of 62 nmol dye/kg body weight into mice (n = 12; up to 180 minutes postinjection) using whole-body near-infrared fluorescence imaging. Spectroscopic studies, gel electrophoresis, and dialysis demonstrated reduced protein binding with increasing number of sulfonate groups. The bovine serum albumin binding constant of the most hydrophobic dye, DY-675, is 18 times higher than that of the most hydrophilic fluorophore, DY-678. In vivo biodistribution analysis underlined a considerable influence of dye hydrophilicity on biodistribution and excretion pathways, with the more hydrophobic dyes, DY-675 and DY-676, accumulating in the liver, followed by strong fluorescence signals in bile and gut owing to accumulation in feces and comparatively hydrophilic DY-678-COOH accumulating in the bladder. Our results demonstrate the possibility of selectively controlling dye-protein interactions and, thus, biodistribution and excretion pathways via proper choice of the fluorophore's substitution pattern. This underlines the importance of structure-property relationships for fluorescent labels. Moreover, our data could provide the basis for the rationalization of future contrast agent developments.
Molecular optical imaging is among the most rapidly growing research areas in the life sciences. Research activities are mainly driven by the intrinsic ability of this technology to move beyond morphology, making early detection of pathologic changes on a molecular level possible by the use of noninvasive strategies. 1 , 2 A special focus of interest comprises diseases with high socioeconomic relevance. Typical examples are the visualization of biomarkers related to cancer, such as carcinoembryonic antigen 3 or HER2/neu. 4 Detection and monitoring of pathologic changes at an early stage with optical imaging techniques such as fluorescence reflectance imaging and fluorescence molecular tomography, which are noninvasive and comparably inexpensive, require contrast agents absorbing and emitting in the near-infrared (NIR) spectral region from <650 to 900 nm to allow a sufficient tissue penetration and to minimize contributions from tissue autofluorescence.5–7 Such contrast agents include simple organic dyes (equaling nontargeted contrast agents) and more sophisticated targeted probes modularly built from fluorescent labels and target-specific biomolecules such as antibodies or peptides.1,2,8,9 Among the fluorescent reporters employed, only indocyanine green (ICG), methylene blue, and fluorescein have been approved by the Food and Drug Administration (FDA) for clinical applications. The cyanine dye ICG, a symmetric heptamethine, is mainly used for blood flow determination and perfusion in the liver 10 or assessment of retinal vascularization status 11 in ophthalmology. Recently, in addition to symmetric cyanines such as ICG, cypate, Cy5.5, and Cy7, displaying the same aromatic end groups at both sides of the polymethine chain, asymmetric cyanine dyes such as the DY dyes, differing in the chemical nature of their aromatic end groups,1,812 have been increasingly exploited as nontargeted and targeted contrast agents.3,1314 The advantages of these dyes are their low cytotoxicity and improved stability compared to ICG. 15
Of particular relevance for the suitability of NIR fluorophores as future contrast agents is the knowledge of their interaction with plasma proteins because binding to these proteins distinctly influences the resuting pharmacokinetics and thus biodistribution. However, in contrast to ICG, which is known for its high plasma protein binding, 16 comparatively few reports exist on the interaction of asymmetric cyanine dyes such as the DY dyes with serum proteins.17–19 This encouraged us to elucidate these mechanisms in detail for the DY-67x series (DY-675, DY-676, DY-677, DY-678), which differ only in the number of sulfonate groups (n = 1-4) attached to the main chromophore and, thus, in hydrophilicity and water solubility. DY-676, which spectrally matches Cy5, is one of our workhorses for tumor imaging. 3 , 4 The overall goal was to systematically determine the influence of these sulfonate groups on pharmacokinetics, thus screening the effects of protein binding in vitro and in vivo that control biodistribution, excretion, and image quality. In this context, we used fetal calf serum (FCS) (to give an indication of the binding properties of the plasma proteins as a whole), and bovine serum albumin (BSA) as protein components as albumin is the main plasma transport protein (60% m/v) based on its ability to bind molecules as an ampholyte or via hydrophobic interactions. 20 In addition, immunoglobulin G (IgG) was included in this study as a representative for the immunoglobulins, which account for 40% m/v of all plasma proteins.
Material and Methods
Dyes
The asymmetric cyanines DY-675, DY-676, DY-677, and DY-678 (Dyomics GmbH, Jena, Germany) were used as free acids without further purification. The chemical structures of the DY-67x family are shown in Figure 1. The distribution ratio (log D) means the distribution between a polar and a nonpolar solvent and was in our case calculated with MarvinSketch software (ChemAxon Kft, Budapest, Hungary) at pH 7.4.
Proteins (BSA, FCS, IgG)
BSA (albumin fraction V, Roth, Karlsruhe, Germany), FCS (Gibco, Karlsruhe, Germany), and IgG from goat serum (Sigma-Aldrich, Karlsruhe, Germany) were used.
Solvents
Spectroscopic grade ethanol was obtained from Sigma-Aldrich. Phosphate-buffered saline (PBS; we used Hank's Balanced Salt Solution, pH 7.4) was purchased from PAA Laboratories GmbH (Pasching, Austria).
Spectroscopic Studies
The absorption and fluorescence spectra of the DY-67x dyes were determined in duplicate in air-saturated ethanol and in air-saturated PBS (pH 7.4) at a dye concentration of 1 × 10⁻⁶ mol/L (if not otherwise stated) in 1 cm quartz cuvets at a temperature of 25 ± 1°C). The absorption spectra were recorded on a CARY 5000 spectrometer (Varian Inc., Palo Alto, CA). The molar decadic absorption coefficients at the dyes absorption maximum (ε (λmax)) in ethanol were determined from three independent measurements of the absorption spectra of three different stock solutions (1 × 10⁻⁴ mol/L, ethanol) yet not from a concentration series. Owing to concentration-dependent dye aggregation, we used different concentrations of DY-678 compared to DY- 675, DY-676, and DY-677.
The fluorescence emission spectra were measured with a Spectronics Instruments 8100 spectrofluorometer (Spectronics Instruments, Westbury, CT) equipped with Glan Thompson polarizers and calibrated with physical transfer standards. 21 Typically, the emission was excited at the blue vibronic shoulder of the longest wavelength absorption band (absorbances of 0.02 to 0.06 to minimize inner filter effects and reabsorption). All the fluorescence emission spectra were corrected for the wavelength- and polarization-dependent spectral responsivity of the detection system. 21
For the spectroscopic determination of the dye-BSA binding constants, the cyanine dyes were dissolved in PBS in the presence of different amounts of BSA, thereby keeping the dye concentration constant, and the absorption spectra of the solutions were measured. The stoichiometry of the resulting dye-BSA complexes was determined separately via the method of continuous variation and was found to be 1:1.
22
The dye-BSA binding constants (K, equation 1) were determined from the BSA binding-induced decrease of the absorption (Ax) in the spectral region of the short-wavelength shoulder (642, 638, 634, and 634 nm for DY-675, −676, −677, and −678, respectively):

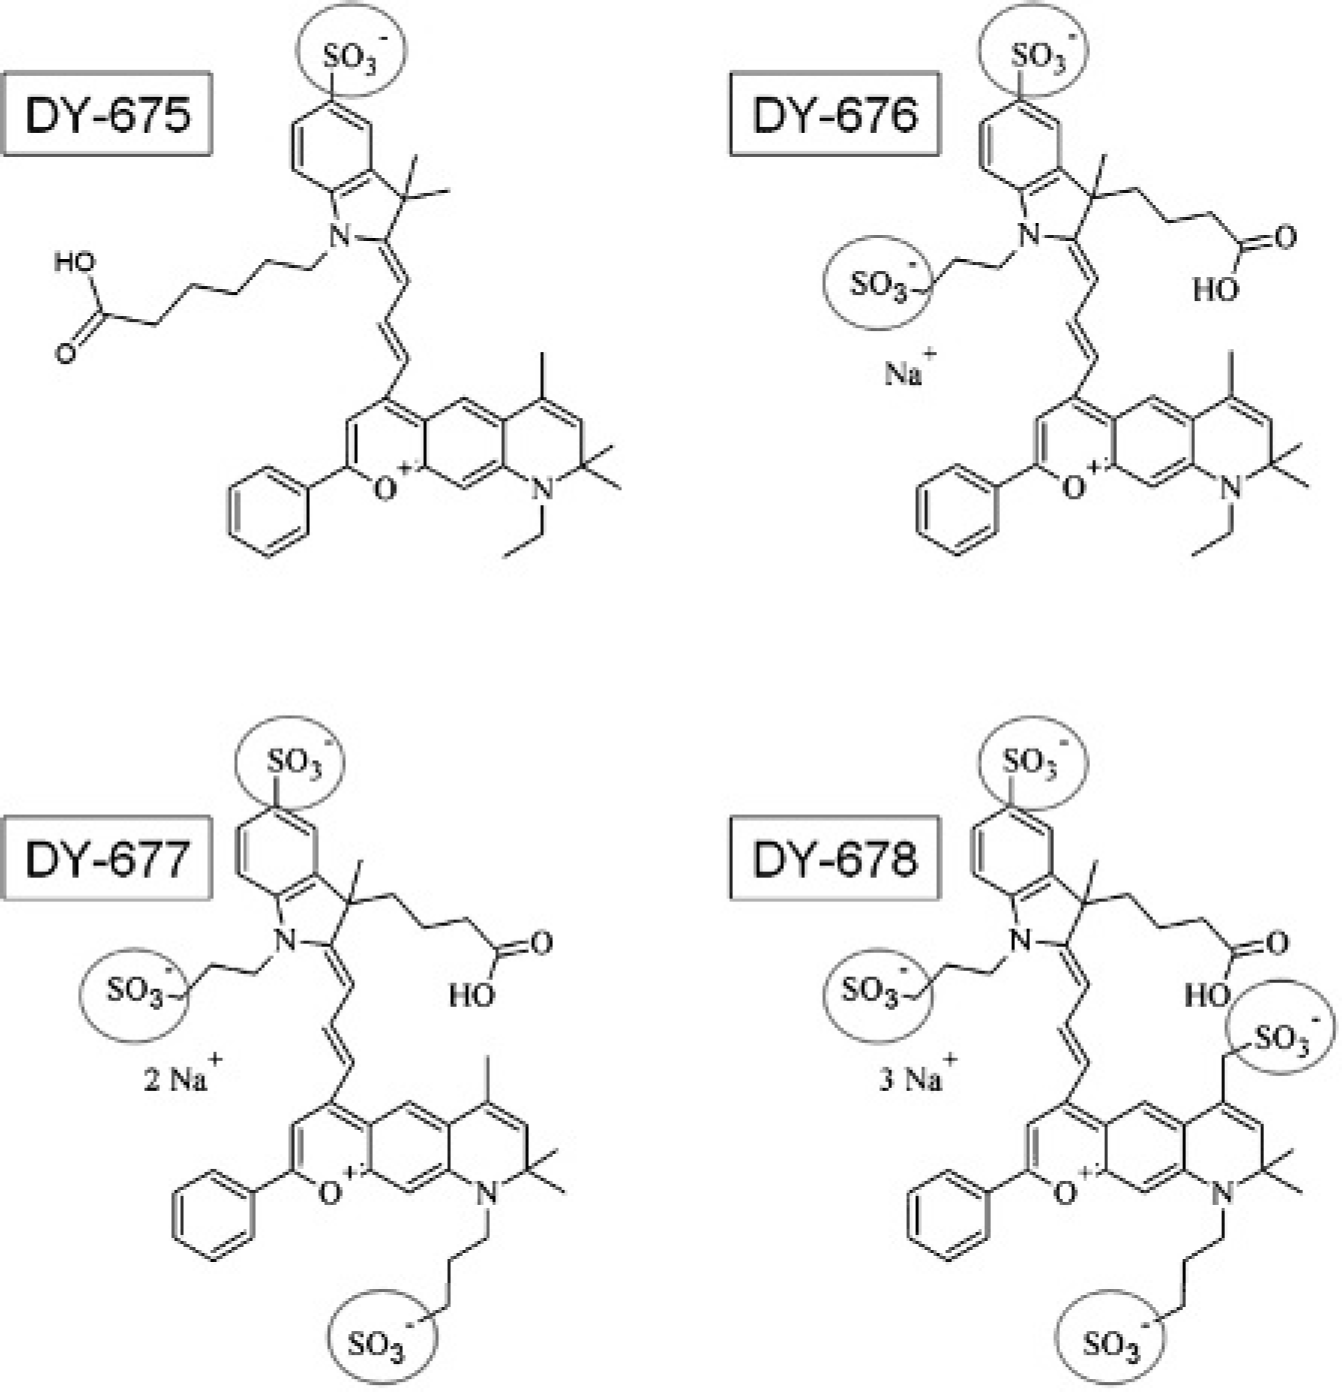
Chemical structures of the DY-67x family of asymmetric cyanine dyes varying in the number of sulfonate groups (circle) attached to the main chromophore.
The absorbance (Ax) correlates with the fraction of BSA-bound dye ([DP]/[D0]) according to equation 2:


Qualitative Analysis of Dye-Protein Binding
Sample Preparation
Different concentrations of each dye (in PBS) were incubated with a protein (BSA, FCS, or IgG) solution for 1 hour at 37°C (imitation of human plasma protein composition).
Agarose Gel Electrophoresis
First, qualitative analyses were performed with agarose gel electrophoresis. Two to 10 nmol DY-676 were incubated with 30 μL BSA (2 mg/mL in PBS). Thirty microliters of the protein-dye solution together with 5 μL loading buffer (300 mmol/L Tris/HCl pH 6.8, 10% [v/v] glycerol, 0.05% [w/v] bromophenol blue) were transferred to a 1.5% (w/v) agarose gel (NEEO Ultra-Quality, Roth, Karlsruhe, Germany) in 0.5 × TAE-Buffer (20 mmol/L Tris Base, 10 mmol/L glacial acetic acid, 0.5 mmol/L ethylenediaminetetraacetic acid [EDTA]) pH 8.0). Electrophoresis was performed at 80 V for 1.5 hours.
Protein Staining
Visualization of the protein bands after electrophoresis was achieved with a Coomassie staining solution (0.6 mol/L Coomassie Brilliant Blue R-250, 12.3 mol/L methanol, 1.75 mol/L acetic acid). For contrast enhancement, 2.5 mol/L methanol and 1.75 mol/L acetic acid (in acqua distillata) destaining solution was used.
Dye Visualization with an NIRF Scanner
For dye visualization, a Maestro whole-body small-animal NIRF imager (Cri Inc., Woburn, CA) equipped with an excitation bandpass (575–605 nm) and a longpass emission filter (645 nm), acquisition settings (wavescan from) 630 to 850 nm in 10 nm steps, cube size 696 × 520 pixels, exposure time set to automatic, binning factor 2 × 2), and a charge-coupled device camera (pixel size 6.45 mm) was used for the measurement of the fluorescence of the agarose and PAGE gels.
Quantitative Analyses of Dye-Protein Binding
Sample Preparation
A dye-protein stock solution was prepared by incubation of 25 nmol dye (see Table 1) with 500 ¼L of a 2 mg/mL protein (BSA, FCS, IgG) in PBS at 37°C by shaking at 600 rpm for 1 hour. Blank values representing unspecific binding (ultrafiltration, dialysis) were determined by incubation of 25 nmol dye without protein.
Ultrafiltration
Two hundred microliters of a stock solution (see above) were placed in an ultrafiltration tube (Microcon Ultracel YM-10 [Millipore, Billerica, MA], cutoff 10 kDa). Centrifugation was carried out with 10,000g at 20°C for 30 minutes to separate the unbound dye (in the eluate) from the protein-bound fluorophore through a 10 kDa cutoff membrane. Fifty microliters of the stock solutions was used for the photometric determination of the dye concentration (see below). To account for the effects due to dye aggregation or binding to the membrane, blank values were determined by incubation of dye without protein, followed by ultrafiltration.
Spectroscopic Properties of the Asymmetric Cyanine Dyes DY-67x in Ethanol

Dye concentration of about 2 × 10⁻⁶ mol/L.
ND = not determined owing to reduced solubility of this dye in ethanol compared to the other dyes of the DY-67x series, the number of the sulfonate groups of each fluorophore, and the resulting negative charge of the fluorophores.
Deprotonation of the COOH group and the counter ions was not considered here and in the calcutation of the distribution ratios (log D).
Dialysis
Two hundred microliteres of a stock solution (see above) was placed into a 5 cm dialysis tube (ZelluTrans, Roth) (molecular weight cutoff 8–10 kDa, width 10 mm). A beaker glass was filled with 20 mL of PBS, and the corresponding protein-dye solutions were dialyzed over night (24 hours) at room temperature. One milliliter of the dialysis tube surrounding milieu was taken for the photometric determination of the dye concentration (see below). Blank values of the dye incubated without protein (see above) were included to control effects due to dye aggregation.
Determination of the Dye Concentration
Quantification of the dye molecules in the protein solutions was performed by determining the corresponding dye absorption spectra at the wavelength region from 250 to 900 nm using a spectrophotometer (Ultrospec 3300 pro, Amersham Biosciences AB, Uppsala, Sweden). The correspondingly obtained dye absorbance at the dye's longest wavelength absorption maximum was used to calculate the dye concentration in the solution, exploiting the Beer-Lambert law. The dye concentration of the stock solution (Ds) was set to 100%, and the concentration of the eluate (ultrafiltration) and the surrounding milieu (dialysis) (De) was calculated relative to the stock solution (see equation 4). The difference between these values equals the amount of dye bound to the protein (protein binding [PB] in percent):

In Vivo Distribution
Male NMRI mice supplied by Charles River (Sultzfeld, Germany), 19 ± 6 weeks old (N = 12) and weighing approximately 43.6 g ± 6.4 g, were housed in standard conditions. Food and water were available ad libitum. Mice were randomly divided into four groups (one group per dye) of three animals each. Distribution of dye in organs was studied by intravenous injection into the tail vein of 62 nmol dye/kg body weight (injection volume 150 ¼L, dye solved in sterilized 0.9% NaCl solution) under isoflurane anesthesia. Mice were placed on their back, and whole-body fluorescence was recorded on the ventral side before (autofluorescence control) and immediately after contrast agent injection (0 minutes) and 30, 60, 120, and 180 minutes after fluorophore injection using the wholebody NIRF optical imaging system (examination table position at 2, fiberglass arm position at 2), as described above. Three hours after dye injection, mice were sacrificed, and spleen, heart, lung, kidney, and liver (including the gallbladder) were collected.
For semiquantitative fluorescence determination in the organs ex vivo, three regions of interest (ROI) with the equivalent pixel area were manually and randomly positioned on the unmixed fluorescence image of spleen, lung, heart, kidney, liver, and gallbladder (Figure 2). ROI analysis provided the average signal (per pixel) divided by the exposure time in milliseconds (analysis with Maestro 2.4.2 software) (signal intensities in arbitrary units ± standard deviation). Comparison of the fluorescence signals obtained for the different dyes was performed based on the assumption of similar molar absorption coefficients at the excitation wavelength and similar fluorescence quantum yields.
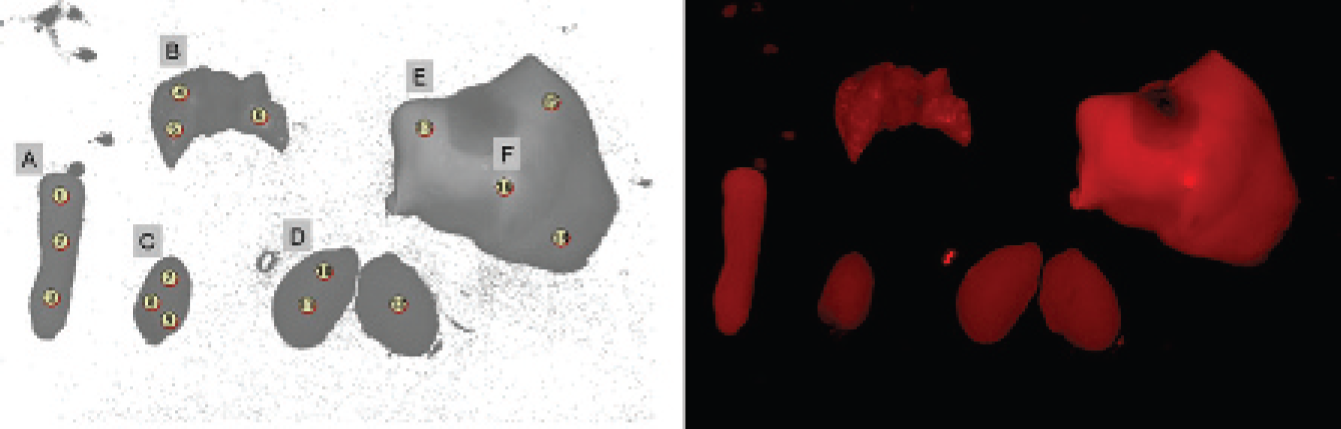
Methodology for the standardized selection of regions of interest (ROI) to determine the specific organ fluorescence ex vivo. Determination of three ROI per organ with an area of 1,012 pixels each to quantify the fluorescence signal (average signal/exposure time) A, spleen [ROI 1, 2, 3]; B, lung [ROI 4, 5, 6]; C, heart [ROI 7, 8, 9]; D, kidney [ROI 10, 11, 12]; E, liver [ROI 13, 14, 15]; F, gallbladder [ROI 16]; ROI numeration given by the system. The NIRF image was acquired with the Maestro scanner (filter set excitation 575–605 nm, emission 645 nm longpass, acquisition settings 630 to 850 nm in 10 nm steps, cube size 696 × 520 pixels).
Statistical Analysis
Fluorescence intensities (as arbitrary units) were presented as standard deviations (in vitro, three experiments per dye and protein) or standard error of the mean (in vivo, three ROI per organ, three organs per group).
Results
Qualitative Analyses of Dye-Protein Binding
Spectroscopic Studies in Solution
The spectroscopic and physical properties of the dyes relevant for this study are listed in Table 1. The spectroscopic properties are slightly affected only by the number of the sulfonate groups, whereas the distribution ratio (log D), which is a measure of the dye hydrophobicity, decreases significantly with increasing number of sulfonate groups.
Addition of BSA to each of the solutions of the DY-67x dyes in PBS results in a red shift of the absorption band and a slight decrease in the vibronic shoulder (at about 640 nm). This shift of the spectra is exemplary shown for DY-676 in Figure 3, summarizing the normalized absorption spectra of this fluorophore in PBS in the absence and presence of BSA.
As shown in Figure 4, the resulting BSA binding constants decrease rapidly with the increasing number of sulfonate groups attached to the parent chromophore. The BSA binding constant of the most hydrophobic dye, DY-675, is 18 times higher than that of the most hydrophilic fluorophore, DY-678. With respect to dye DY-675, each additional sulfonate group leads to a decrease in the binding constant of a factor of about 2 to 3.
Agarose Gel Electrophoresis
Agarose gel electrophoresis provided first qualitative information about the interaction of DY-676 with BSA. NIRF (Figure 5A) and light (Figure 5B) images showed a clear colocalization of DY-676 with BSA. Moreover, under identical measurement conditions, the free dye displayed a longer migration distance than the BSA-bound fluorophore (see Figure 5A, lane 6). The unbound dye was removed, that is, washed out during subsequent Coomassie staining, and thus could not contribute to the signal in the light image (see Figure 5B, lane 6). The observed band broadening was attributed to diffusion during Coomassie staining. BSA was not visible in the NIRF image in the absence of DY-676 dye or Coomassie staining.
Native PAGE
Depending on the number of sulfonate groups, the DY-67x dyes showed a distinctly different migration behavior (Figure 6). Experiments with DY-67x-BSA and DY-67x-FCS mixtures revealed NIRF of both BSA and FCS in the presence of the cyanine dyes, indicating that all the DY-67x dyes bound to these proteins. In addition to BSA, the proteins and protein fragments contained in FCS could be visualized only with the aid of DY-675 as a smear (not shown). IgG was not included in the native PAGE electrophoretic experiments because of its isoelectric point, resulting in migration to the cathode. 23 In the absence of protein, all the free dyes revealed a longer migration distance than their protein-bound analogues under identical running times. With an increase in the number of sulfonate groups, a second band at the position representative of the corresponding free dye appeared for DY-676 to DY-678. This band was accordingly ascribed to the unbound dye (not shown).

Absorption spectra of DY-676 in phosphate-buffered saline in the presence of varying amounts of bovine serum albumin (BSA): free dye (full squares), 3.31 ¼mol/L BSA (open squares), 8.27 ¼mol/L BSA (full triangles), and 827 ¼mol/L BSA (open triangles).

Relative bovine serum albumin (BSA) binding constants of DY-675, DY-676, DY-677, and DY-678. The BSA binding constant of DY-678 was set to 1.
Quantitative Analysis of Dye-Protein Binding: Ultrafiltration and Dialysis
Ultrafiltration and dialysis revealed that with increasing number of sulfonate groups, the concentration of the free dye in the eluate or surrounding medium increased, independent of the examined protein (BSA, FCS, or IgG; Table 2). For all dyes, the blank values determined by incubation of the pure dye without protein were lower and concisely reduced for DY-676 to DY-678 compared to DY-675. In average, protein binding measured with ultrafiltration appeared to be more pronounced in comparison with the corresponding values determined by dialysis (see Table 2). Nevertheless, for both methods, dye-protein binding followed the same tendency for the chosen classes of proteins, that is, albumins (BSA, FCS) and immunoglobulins (IgG).
In Vivo Dye Distributino
In Vivo Examination
The time-dependent biodistribution of the four DY-67x dyes monitored by NIRF whole-body scanning in 12 mice showed differences in both the time-dependent signal evolution and the resulting intensity distribution for DY-675 to DY-677 and DY-678 throughout the ventral part of the body in vivo. These observations were in agreement with organ fluorescence signals observed in opened mice ex vivo (Figure 7). Whole-body NIRF imaging measured after application of DY-675 (one sulfonate group) displayed fluorescence signals at defined areas under the costal arch of all three mice at 30, 60, and 120 minutes postinjection, presumably associated with the liver and gallbladder. Circularly shaped fluorescence areas could be seen in all mice up to 30 minutes postinjection and were presumably associated with dye-colored feces on the movement through the intestine. Anatomic coregistration of the open-body NIRF image with the black-and-white picture (see Figure 7, right column) revealed the presence of fluorescence mainly in the intestine at 180 minutes postinjection. DY-676 (two sulfonate groups) showed similar behavior in terms of the time-dependent signal evolution and fluorescence signal localization at specific body regions. For DY-676, in the opened body, ex vivo fluorescence signals were also observed in the gut.
In contrast, injection of DY-677 (three sulfonate groups) led to fluorescence in extended areas of the ventral part of the body (intestine) after 30, 60, and 120 minutes postinjection. Ex vivo open-body and organ distribution studies showed no distinct differences for DY-675 and DY-676. In the case of DY-678, fluorescence appeared all over the shaved ventral part of the body at 0 and 30 minutes after fluorophore injection, and no particularly discernible fluorescent areas could be localized. At longer postinjection times, emission in the area of the urinary bladder (verified with the open body black-and-white image) appeared over the whole monitoring time.

Determination of dye-protein binding via agarose gel electrophoresis of 60 ¼g bovine serum albumin (BSA), incubated with decreasing concentrations of DY-676 (1) 10 nmol DY-676, (2) 8 nmol DY-676, (3) 6 nmol DY-676, (4) 4 nmol DY-676, (5) 2 nmol DY-676, (6) free DY-676 without BSA, and (7) BSA without DY-676. A, NIRF image acquired with the Maestro scanner (filter sets: excitation 575–605 nm filter, emission 645 nm longpass filter, acquisition settings 630−850 nm in 10 nm steps, cube size 696 × 520 pixels). B, Staining of BSA using Coomassie blue staining.

Determination of dyeprotein binding using native PAGE: visualization of dye fluorescence with the Maestro NIRF imager (filter sets: excitation 575–605 nm filter, emission 645 nm longpass filter, acquisition settings 630–850 nm in 10 nm steps, cube size 696 × 520 pixels) and protein visualization via Coomassie staining; 25 nmol dye (DY-675, DY-676, DY-677, DY-678) was incubated with bovine serum albumin (BSA) and fetal calf serum (FCS), free dye without protein (Maestro imager, filter sets: excitation 575–605 nm filter, emission 645 nm longpass filter, acquisition settings 630–850 nm in 10 nm steps, cube size 696 × 520 pixels).
The observed fluorescence signals were comparable for all mice of one group.
Organ Distribution of the Dyes
Figure 8 illustrates the organ distribution of the DY-67x dyes 3 hours after administration. To facilitate this comparison, all the data are expressed as average signal/exposure times. Three hours after fluorophore injection, all the dyes were found primarily within the gallbladder, liver, and spleen and at lower levels in all the other organs (lung, heart, kidney). However, depending on the number of sulfonate groups, differences in the organ distribution between the dyes could be observed. Fluorescence signals from the heart were always close to the baseline, so a reliable conclusion regarding a dye accumulation in this organ could not be made.
Discussion
Our results clearly demonstrate that binding of the DY-67x cyanine dyes to the investigated serum proteins and immunoglobulins depends on the number of sulfonate groups attached to the otherwise identical main chromophore. To the best of our knowledge, this is the first systematic study of dye–protein interactions for a set of dyes differing only in the number of the sulfonate groups, thereby focusing on the influence of dye charge and hydrophilicity while minimizing contributions from steric effects. The assumption of increasing hydrophilicity with an increase in sulfonate groups was made from the chemical structure and was in agreement with the calculated distribution ratios (log D).
Quantitatively Measured Binding (%) of the DY-67x Dyes to the Proteins BSA, FCS, and IgG (proportion of dye bound to protein)

BSA = bovine serum albumin; BV = blank value (percentage of retained free dye in absence of protein; for further details, see equation 1 and text); the high blank value of DY-675 is attributed to the formation of supramolecular aggregates; FCS = fetal calf serum; HP = hydrophilicity; IgG = immunoglobulin G; PB = protein binding.
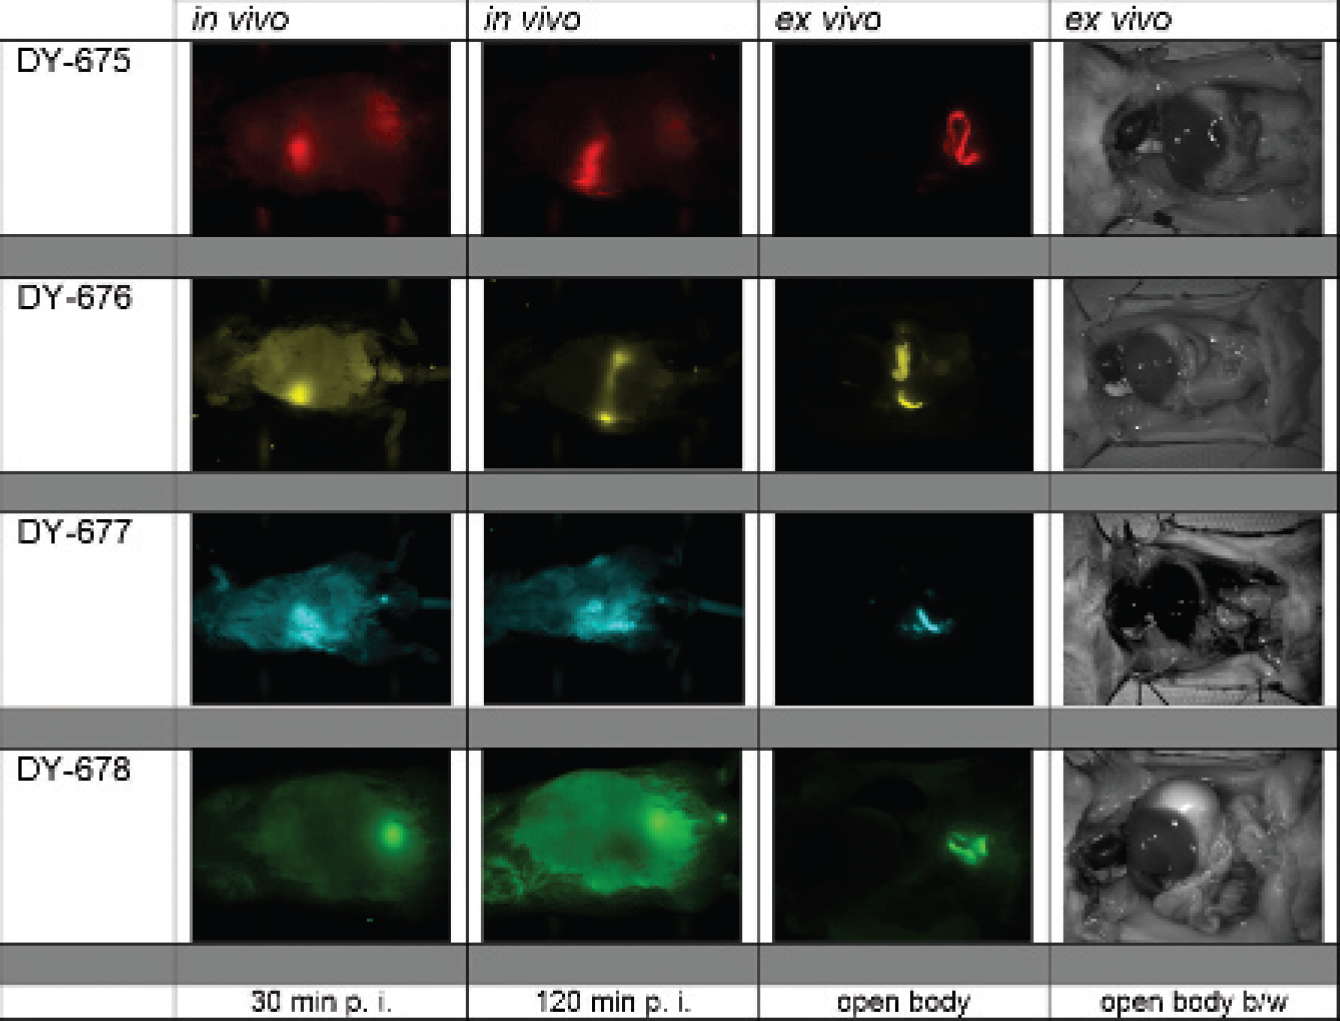
Time-dependent dye distribution in organs of living male NMRI mice (N = 12; weight approximately 43.6 ± 6.4 g, age 19 ± 6 weeks), determined with the whole-body NIRF Maestro scanner (false color images: red = DY-675, yellow = DY-676, cyan = DY-677, green = DY-678) at selected times (30 and 120 minutes) after injection of 62 nmol dye/kg body weight; anatomic coregistration of the fluorescence signals via black and white open body picture (right). Euthanasia was carried out 3 hours after contrast agent injection. p. i. = postinjection.
BSA, chosen as a model for serum proteins, consists of three homologous domains (I, II, III), which are divided into two subdomains (A, B) each. 20 In the subdomains IIA and IIIA, the specific drug binding sites—the warfarin site and the diazepam site—are located.24–28 These binding sites are the binding areas for small heterocyclic or aromatic carboxylic acids. Generally, the size of the ligand and drug–BSA interactions and dye–BSA interactions is influenced by the chemical structure of the respective compounds or species (steric effects) as well as their charge and hydrophilicity, which are closely related. 20 Accordingly, the BSA binding constants are also used as a measure for hydrophilicity.
The considerable influence of the number of sulfonate groups of the DY-67x dyes and, thus, dye charge and hydrophobicity follows, for example, directly from a comparison of the BSA binding constants of DY-675 and DY-676, which differ only by a sulfonate group at the indole moiety and, thus, by a single negative charge. The reduction in hydrophobicity results in a decrease in BSA binding constant (see Figure 3). The values observed for the BSA binding constants of the DY-67x series are comparable to those of the BSA binding constants obtained for other cyanines, ranging from 104 to 107 L/mol.29–33

Ex vivo dye organ fluorescence distribution in living male NMRI mice (weight approximately 43.6 ± 6.4 g, age 19 ± 6 weeks; one group per dye, three mice per group), determined with the Maestro wholebody NIRF scanner 180 minutes after injection of 62 nmol dye/kg body weight. Euthanasia was measured as average signal per pixel/exposure time with three regions of interest per organ (spleen, lung, heart, kidney, liver, gallbladder); the standard deviation is shown as the standard error of the mean. Trends in accumulation are indicated via arrows.
Qualitative Analysis Gel Electrophoresis
Dye-protein mixtures analyzed in agarose gels revealed a colocalization of BSA and dye in NIRF imaging and Coomassie visualization, respectively, and a reduced migration distance in the presence of the proteins in comparison with the unbound dyes. This indicates dyeprotein binding. The weak signals observed for DY-675 and DY-676 in the gels are ascribed to the formation of nonfluorescent H-aggregates (see also Figure 3, pronounced shoulder in the absorption spectrum of DY-676 suggesting dye aggregation 15 ). Dye-protein colocalization has also been reported for the cyanine dye Cy5.5 by Hansch and colleagues after incubation of Cy5.5 with mouse plasma and analysis in an agarose gel. 14 The possibility of controlling the size and extent of protein binding of the DY-67x dyes by substitution pattern in conjunction with their low cytotoxicity and good stability renders these asymmetric cyanines especially interesting as new contrast agents for molecular imaging.
Quantitative Analyses via Ultrafiltration and Dialysis
The quantification with ultrafiltration and dialysis showed a decrease in protein binding with an increase in the number of sulfonate groups. The blank values (according to protein binding calculated from the retained dye; see equation 4) were low (compared to protein binding) for DY-676 to DY-678. The observed retention of relatively high amounts of the dye DY-675 by ultrafiltration and dialysis is attributed to aggregate formation favored by the low hydrophilicity of this fluorophore. A similar behavior has been reported for ICG, which is known for its hydrophobic character and high plasma protein binding of 95% and is still the standard regarding protein binding. 34 These similarities suggest that these two dyes could also be comparable with respect to their in vitro (measured protein binding via ultrafiltration or dialysis) and in vivo (eg, excretion pathway, see below) properties.
The results of our dye-protein binding studies did not show a remarkable difference between FCS and BSA. This is not astonishing because BSA is known to be the main component of FCS (BSA 2.3 g/100 mL, total protein 3.8 g/100 mL 35 ) besides fetuin, fibronectin, globulin, protease inhibitors, or transferrin.
In Vivo Dye Distribution
The in vivo biodistribution of the different DY-67x dyes after intravenous injection is obviously controlled by the number of sulfonate groups. The first punctuated (abdominal right side, 30 to 60 minutes [not shown]) and then banded (abdominal left side, 120 minutes) strong fluorescence of DY-675 under the costal arch was observed in all mice and seems to be associated with the region of the liver. The high plasma protein binding of this fluorophore (see Figure 4), discussed in the previous section, which is indicative of the considerable lipophilicity of DY-675 and is typically also related to the dyes tendency to form aggregates, suggests that this dye could be excreted in a way similar to that for ICG. 16 It is known for ICG that the multidrug resistance P-glycoprotein 2 (Mdr2) as a phospholipid translocator is responsible for the biliary excretion of hydrophobic organic anions. 36 This transporter forms biliary phospholipid vesicles and mixed lipid/bile salt micelles. In the postmortem opened body, the fluorescence of this dye is clearly related to the intestine, which is indicative of an excretion of feces. Obviously, ICG is eliminated through liver and gallbladder by giving bile to the feces. 37 Moreover, other lipophilic contrast agents, such as 99mTc-HIDA (technetium-99m-N-(2,6-dimethylphenyl-carbamoyl-methyl)-iminodiacetic acid), are rapidly cleared from the blood and used as a gallbladder imagingagent. 38 Given that the hepatobiliary way of excretion can also be assumed for DY-675, this fluorophore presents a potentially new gallbladder imaging agent, especially owing to its favorable features concerning applications without the use of radiation and the low cytotoxicity 15 related to the dye per se in comparison with the clinically approved ICG.
DY-676 and DY-677 showed the same fluorescence pattern as DY-675, with the only difference being that for DY-677, a larger expansion of the fluorescence signal on the abdominal right side (intestine) was observed with a caudal migration after 120 minutes.
The excretion route of DY-675, DY-676, and DY-677 indicates fast dye elimination over bile and feces. This was not expected for DY-677 because it showed a protein binding behavior comparable to that of DY-678 in the in vitro experiments; thus, a similar excretion route for both dyes was also expected in vivo. Besides the complexity of the in vivo situation, where multiple factors can influence the protein binding behavior, this difference could be attributed to binding to other proteins, which are opsonized in a different way. An additional factor could be α1-acid-glycoprotein, which is synthesized in the liver and preferably binds lipophilic and basic molecules. This protein is relatively highly concentrated (compared to other plasma proteins with the exception of albumins and immunoglobulins) in the plasma (1–3%). 39 , 40
In summary, the dyes DY-675, DY-676, and DY-677 are removed from the blood circulation presumably via the mononuclear phagocyte system, with liver and spleen being the main target organs after opsonization by plasma proteins. This is a possible explanation for the observed strong liver accumulation.
In contrast, the most hydrophilic dye, DY-678, showed amplified whole-body fluorescence immediately after contrast agent injection, thus indicating that the dye is rapidly distributed all over the body. This is ascribed to its low binding to plasma proteins (see also Figure 4). The constant fluorescence within the area of the urinary bladder suggests a renal clearance of this dye owing to its high hydrophilicity. Free DY-678 molecules have a molecular weight below the threshold of renal elimination and can therefore be filtrated via the kidney into urine.
Ex Vivo Organ Dye Distribution
The ex vivo data correlate well with the in vivo data. Whereas for the dyes DY-675, DY-676, and DY-677, comparable trends in organ distribution could be observed, with the highest accumulation occurring in the gallbladder, liver, and spleen, for the most hydrophilic dye of this series, DY-678, kidney and lung were also found to be targets. The strong fluorescence signals from the gallbladder, liver, and spleen are ascribed to the involvement of these organs in metabolism, excretion, and detoxication. The parallel reduction in the fluorescence of the gallbladder and increase in the fluorescence in the kidneys found for the DY-67x dyes with the increasing number of sulfonate groups correlate well with the observations reported for lipophilic ICG, that is, accumulation in the gallbladder with a lower excretion rate by kidney via urine. 38 The hydrophilic nature of DY-678 in conjunction with its accordingly low affinity for plasma proteins seems to be responsible not only for the increased signals in the kidneys, suggesting an excretion by urine, but also for the nearly homogeneous distribution over all the other organs. This can also account for the increase in liver uptake of DY-678 compared to the dyes DY-675, DY-676, and DY-677, thereby suggesting recognition of this dye by scavenger receptors of the liver. We are currently investigating this assumption. Scavenger receptors, which are located on different cell types of the liver, are characterized by their interaction with many different polyanionic substances, such as heparin, dextran sulfate, polyinosinic acid, and phosphatidylserine. DY-678 variations of the ex vivo organ distribution values could be related to the relatively small number of animals per group and, therefore, biologic variations.
Conclusion
The results from the in vitro and in vivo studies with the DY-67x family underline the possibility of controlling dye hydrophilicity, dye–protein interactions, and, thus, eventually both biodistribution and excretion pathways of a contrast agent via proper choice of the fluorophores substitution pattern, that is, the number of sulfonate groups attached to the main chromophore without considerably affecting the dye's application-relevant spectroscopic properties. These data provide an insight into the relationship between molecular structure and the biologic behavior of such cyanine dyes. With regard to the low molecular weight of the DY dyes in comparison with, for example, an antibody or peptide, it is difficult to estimate the influence of dye charge on the application-relevant properties of dye-labeled biomolecules, especially on the pharmacokinetics. Here further systematic studies are needed that were beyond the scope of this article. Moreover, our results showed that the choice of a suitable dye depends crucially on the desired imaging application. This can form the basis for the rationalization of the development and optimization of new contrast agents for optical imaging.
Footnotes
Acknowledgments
We would like to thank Yvonne Heyne and Christiane Geyer for technical assistance during the in vivo experimentation, Dr. Frank Lehmann for the helpful discussions, and Dr. Melanie Kettering and Brigitte Maron for logistical assistance.
Financial disclosure of authors and reviewers: None reported.