
Abstract
Ultrasound-based molecular imaging employs targeted microbubbles to image vascular pathology. This approach also has the potential to monitor molecularly targeted microbubble-based drug delivery. We present an image-guided drug delivery technique that uses multiple pulses to translate, image, and cavitate microbubbles in real time. This technique can be applied to both imaging of pathology in large arteries (sizes and flow comparable to those in humans) and guiding localized drug delivery in blood vessels. The microbubble translation (or pushing) efficacy of this technique was compared in a variety of flow media: saline, viscous saline (4 cp), and bovine blood. It was observed that the performance of this approach was marginally better (by 6, 4, and 2 dB) in viscous saline than in bovine blood with varying levels of hematocrit (40%, 30%, and 10%). The drug delivery efficacy of this technique was evaluated by in vitro and ex vivo experiments. High-intensity pulses mediated fluorophore (DiI) deposition on endothelial cells (in vitro) without causing cell destruction. Ex vivo fluorophore delivery experiments conducted on swine carotids of 2 and 5 mm cross-section diameter demonstrated a high degree of correspondence in spatial localization of the fluorophore delivery between the ultrasound and composite fluorescence microscopy images of the arterial cross sections.
A THEROSCLEROSIS is a progressive occlusive disease of the arterial vessels and is the leading cause of death occurring from cardiovascular diseases. In the United States, cardiovascular diseases are responsible for more than 1.7 million deaths annually. 1 Current methods of imaging atherosclerosis in widespread clinical practice are restricted to detecting the anatomic features of macroscopic plaques—that is, disease at a relatively late stage. However, it is well established that the early molecular markers of atherosclerosis may be expressed decades before this disease manifests itself at the scale at which current imaging technologies can detect. 2 Imaging the molecular expressions of this arterial disease may help in early detection, thus facilitating more effective early therapy or lifestyle changes. In later stages, this approach may also help in characterizing different plaques for the purpose of treatment guidance or assessing the response to therapy.
Ultrasound-based imaging with molecularly targeted microbubbles has been established in the literature as an effective approach for imaging the molecular expressions of pathology on the vascular endothelium in vivo and ex vivo.3–6 Additionally, in the past decade, the therapeutic applications of microbubbles have emerged, motivated by the need for a focal drug delivery/gene delivery agent.7–13 Controlled oscillation of microbubbles under the influence of acoustic insonation causes transient changes in the permeability of cell membranes, enabling the transport of the extracellular molecules into the cytoplasm of viable endothelial/smooth muscle cells (ECs/SMCs). 14 An ultrasound-based real-time approach that combines molecular imaging and drug delivery may provide clinicians with a valuable method for diagnosing and treating (under image guidance) vascular diseases within a single procedure. Nevertheless, several issues need to be addressed before such an approach can be formulated and applied to drug delivery. Some of these issues are discussed and addressed in this work.
Jayaweera and colleagues suggested that the rheologic behavior of microbubbles is similar to that of red blood cells (RBCs); hence, microbubbles tend to travel along the central axis of the blood vessel. 15 In our observation, whereas RBCs tend to travel along the central axis of the blood vessel, microbubbles remain buoyant even when they are flowing through vessels. 16 This selectively reduces the probability of microbubbles establishing contact with ECs on the lower wall of the blood vessels, thus impeding drug delivery. One solution to this problem is applying acoustic radiation force for guiding microbubbles. 9 , 10 , 17 Zhao and colleagues and Rychak and colleagues have successfully demonstrated the value of applying radiation force in small capillaries in vitro and in vivo.18–20 Gessner and colleagues and Needles and colleagues demonstrated a real-time application of radiation force-enhanced targeted imaging in small capillaries, 21 , 22 whereas Patil and colleagues applied real-time sequences for simultaneously guiding and imaging microbubbles in vitro in large vessels (≈2 mm) with flow velocities up to 15.9 cm/s. 16 Those experiments, however, used saline as a flow medium, which in our observations led to significantly different results from those obtained using blood (with varying hematocrit) as a flow medium.
Application of ultrasound-assisted and microbubble-based drug delivery has been studied by different groups in vivo and ex vivo. 14 , 23 , 24 However, those experiments were conducted without any real-time feedback or spatiotemporal monitoring of fluorophore or drug delivery. In this work, we introduce a modified real-time approach for selectively imaging and guiding the microbubbles to monitor or enhance drug delivery in large blood vessels. Furthermore, we quantify the performance of this method between varying blood (flow medium) hematocrit. Specifically, we conducted experiments to (1) compare the performance of the proposed modified approach in saline with varying viscosity (1 and 4 cp) and in blood with varying hematocrit (10, 30, and 40%); (2) identify parameters in vitro to enable drug delivery without cell destruction; and (3) evaluate the ability of our approach to perform selective imaging of adherent microbubbles and enable directed fluorophore/drug deposition at a desired location in ex vivo arteries (varying diameters) with flowing saline and blood. We also demonstrate that real-time image-guided drug delivery can be performed at diagnostic mechanical index (MI < 1.9) and negligible spatial peak temporal average intensities (ISPTA) on clinical ultrasound scanners with minimal modifications, implying the potential applicability of this approach in a clinical setting.
Methods
Real-Time Dual-Frequency Imaging-Drug Delivery Sequence
The flow diagrams of the proposed real-time imaging and drug delivery sequence are illustrated in Figure 1. A 20-cycle low-frequency pulse (centered at 4 MHz) with a high pulse repetition frequency (PRF) is interlaced between a series of single-cycle high-frequency (8 MHz) and low PRF pulse inversion (PI) pulses. The frequency of the radiation force pulse should typically match the resonance frequency of the microbubble to optimize the translational displacement and backscatter of the microbubble. 17 The resonance frequency of the microbubble population (2.2 μm mean diameter) used in this work is approximately 4 MHz. 16 , 25 The intermittent PI pulses provide high-resolution tracking of the temporal accumulation of microbubbles. By summing the echo responses of noninverted/inverted transmit signal sequences, high microbubble signal specificity is achieved. 25 Note that the MI (MI = peak negative pressure in MPa/√(center frequency in MHz)) of the radiation force pulse is always maintained below 0.2 to minimize microbubble destruction by ultrasonography. Given that equal peak negative pressures are used for imaging and pushing, the imaging MIs are significantly lower owing to the higher imaging frequency.

A, Flow diagram of the real-time algorithm used for selective image-guided drug delivery. B, Schematic of the pulse sequence used in the real-time imaging-drug delivery algorithm.
The received radiofrequency PI data are slow-time filtered using a 10-tap infinite impulse response filter. In a slow-time filtering operation, a lowpass filter is applied in the time direction over a fixed number of frames. Slow-time filtering retains the signal from static microbubbles and largely cancels the signal scattered by flowing microbubbles.5,16,26,27 This allows selective imaging of static or adherent microbubbles in real time (8–10 Hz frame rate). At the end of this sequence, a high MI (MI = 1.0), high PRF destruction pulse is directed to the static or adherent microbubbles, thus facilitating local microbubble destruction and a concomitant fluorophore delivery.
Programmable Ultrasound Scanner
An Ultrasonix RP programmable research ultrasound scanner with a high bandwidth array transducer (4L12) (Ultrasonix, Richmond, BC) was used in this study. Gaussian pulses with a programmed bandwidth and PRF can be generated using the scanner. This scanner provides focused and unfocused data with fixed transmit focusing and dynamic receive focusing. The transducer has a center frequency of 8 MHz and −6 and −10 dB fractional bandwidths of 80 and 110%, respectively. This bandwidth allows varying transmit and receive frequencies between 4 and 12 MHz.
In Vitro and Ex Vivo Sample Preparation
An agar-gelatin channel flow phantom was used in flow experiments to assess the performance of our technique in saline with different viscosities and in blood with varying levels of hematocrit. An overview of preparing gelatinagar-based wall-less phantoms is detailed in an article by Patil and colleagues. 16
Experiments were conducted to determine the ability of our technique to deliver a potential drug to ECs without destroying them. DiI (1,1′,di-octadecyl-3,3,3′3′-tetramethylindocarbocyanine perchlorate, Molecular Probes, Eugene, OR) was used as a model compound to mimic drug delivery. SVEC4-10 ECs were grown in the OptiCell cell culture system (Thermo Fisher Scientific, Rochester, NY) with 10% fetal bovine serum in Dulbecco's Modified Eagle Medium (Invitrogen, Carlsbad, CA). Plating density was 2 × 10⁴ cells/cm2. Cells were cultured for 24 hours and allowed to reach approximately 80% confluence.
Swine carotids were used for ex vivo experiments testing fluorophore delivery under flow. Common carotid artery specimens were excised from recently sacrificed, farm-raised swine specimens. The arteries were excised proximal to the carotid bifurcation and ranged in size from 2 to 5 mm in diameter. Arteries were immediately stored in a physiologic saline solution containing Ca2+, Mg2+ and phosphate-buffered saline, 3-(N-morpholino) propanesulfonic acid (MOPS), 2 μM ethylenediaminetetraacetic acid (EDTA), glucose, and antibiotics at 4°C. The majority of connective tissue was removed from the outside of the artery. The arteries were sutured to the end of plastic tubing and immersed in a saline bath.
Microbubble Preparation
Biotinylated lipid microbubbles with DiI fluorophore incorporated into the shell and a nonfluorescent biotinylated microbubble of similar diameter (Targestar-B, Targeson Inc, San Diego, CA) were used in this study. Preparation and use of these microbubbles have been documented in depth by Klibanov and colleagues. 3 Briefly, phosphatidylcholine biotin-polyethylene glycol (PEG)–lipid (Avanti Lipids, Alabaster, AL) and PEG stearate (Sigma-Aldrich, St. Louis, MO) were dispersed in saline. Fluorescent microbubbles were prepared with the inclusion of a small amount of DiI (2% by molarity). The micellar lipid dispersion was then sonicated in the presence of gaseous decafluorobutane (F2 Corporation, Lancashire, UK). After preparation, the microbubble dispersion was washed with saline and aliquoted into glass vials with a decafluorobutane headspace.
Experimental Design and Apparatus
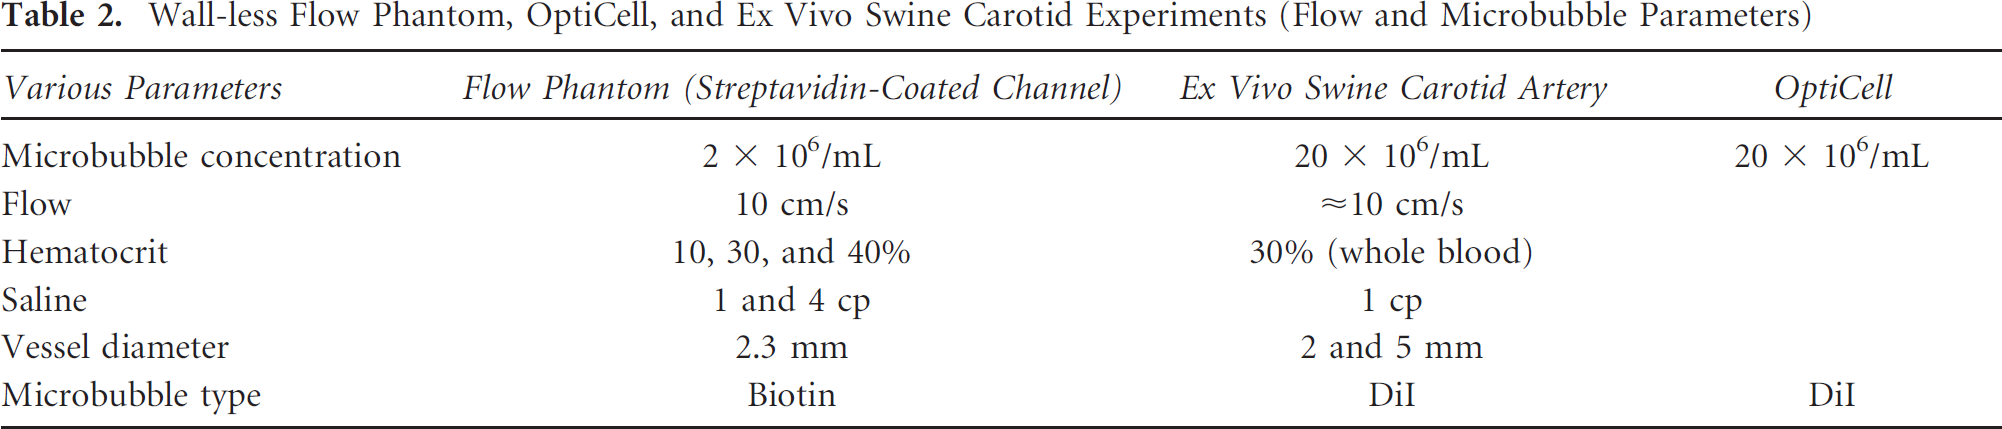
Table 1 lists the acoustic parameters and Table 2 lists the flow and the microbubble parameters used in the reported experiments. For the ex vivo carotid artery experiment, the swine carotid artery was immersed into a physiologic saline bath and the ends were sutured to plastic tubing (Figure 2A). Microbubbles were drawn into the tubing and artery using a programmable syringe pump (PHD 2000, Harvard Apparatus, Holliston, MA). The imaging and drug delivery sequences were applied using the Ultrasonix RP scanner. A wall-less phantom enclosing a 2.3 mm cross-section diameter vessel was used for the flow experiments testing the effects of viscosity (Figure 2B). The interior of the gelatin phantom vessel channel was incubated with 0.05 mg/mL of streptavidin overnight and flushed with albumin before conducting experiments. For the static fluorophore delivery experiments, the entire OptiCell was mounted on a plastic stand and the entire assembly was immersed in a 37°C water bath (Figure 2C).
Acoustic Parameters Used in Various Experiments

MI = mechanical index.
Wall-less Flow Phantom, OptiCell, and Ex Vivo Swine Carotid Experiments (Flow and Microbubble Parameters)
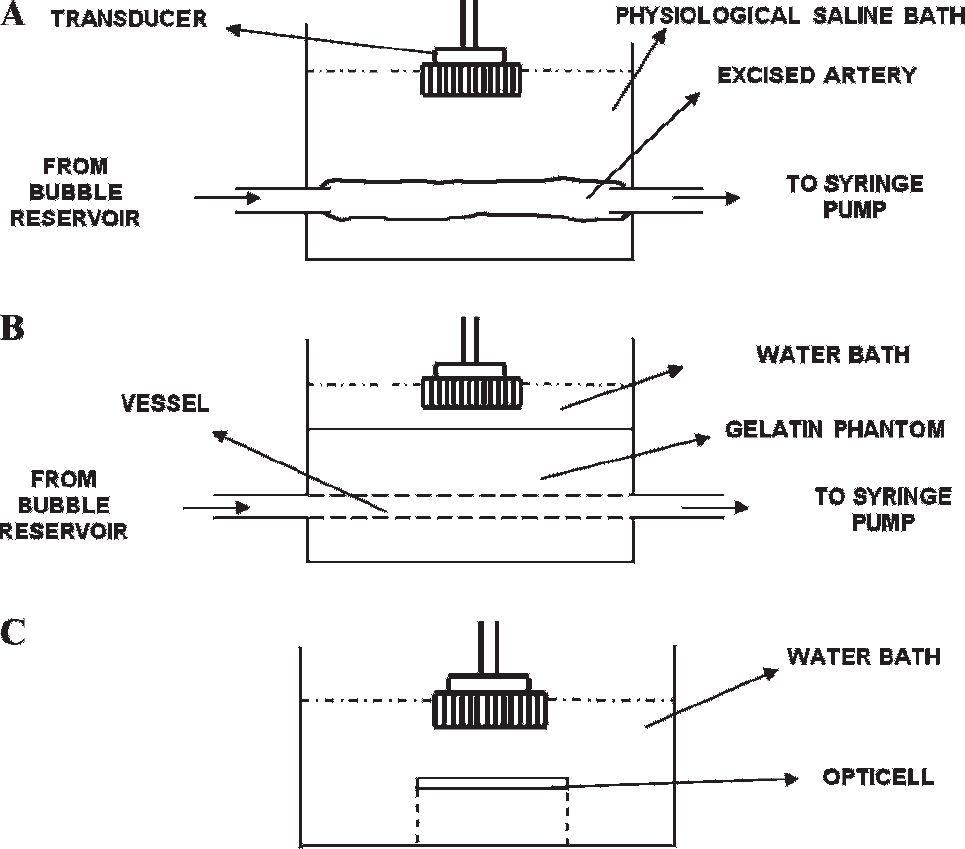
Schematic of the apparatus used in various experiments reported in this work. A, Experiment with ex vivo swine carotid artery. B, Wall-less flow phantom-based experiments for comparing the efficacy of the algorithm in saline with varying viscosity and blood with varying hematocrit. C, In vitro experiments with cultured endothelial cells.
Results
The temporal variation in the adherent microbubble signal from the distal (lower) vessel wall during the application of the selective molecular imaging sequence is presented in Figure 3A.

A, Temporal variation in the signal obtained from static (or adherent) biotin microbubbles at the far wall of the streptavidincoated vessel in the flow phantom. The exponential model is superimposed on the experimental data. Radiation force was applied using a 20-cycle pulse with center frequency of 4 MHz and MI < 0.2. Imaging was performed at 8 MHz using single-cycle pulse inversion pulses. The flow velocity of the fluid through the 2.3 mm cross-section vessel was 10 cm/s. The microbubble concentration was 2.0 × 10⁶/mL. The saline viscosity was maintained at 1 and 4 cp. The blood hematocrit was varied in steps from 10% and 30 to 40%. The mean and standard deviation were obtained over 20 independent renditions. B, Normalized absolute intensities and the maximum rate of change of the stationary (adherent) microbubble signal in A. H = hematocrit; S = normal saline; S-4cp = saline with viscosity 4 cp.
Signals from microbubbles in five different media (1 and 4 cp saline and blood with 10, 30, and 40% hematocrit) were plotted, with the error bars indicating 1 SD (n = 20). dIi/dt is the rate of change in the plotted signal (adherent microbubbles), and ΔIi indicates the absolute change in the plotted signal. An exponential model was superimposed on the experimental data (r 2 > .99). The rate of change in signal and the absolute intensities for the various flow media were normalized using the highest values obtained from the saline curve and are plotted in Figure 3B.
Composite bright-field and fluorescence images of the SVEC4-10 ECs insonated in the presence of DiI microbubbles (MI = 1) enabled verification of fluorophore delivery to ECs (Figure 4). No significant difference was observed in the fluorescence signal between cells insonated at MI = 1.0 and MI = 1.9. No cell death was observed at MI = 1.0 and 1.9 (Appendix).

Superimposed optical and fluorescence image of the SVEC4-10 endothelial cells. The endothelial cells were incubated with DiI microbubbles for 3 minutes and subjected to a destructive ultrasound sequence (4 MHz, 20 cycles, 42 kHz PRF, and MI = 1) for 3 minutes. The endothelial cells were washed and imaged under the microscope.
Ultrasound imaging data obtained during the image-guided drug delivery sequence enabled noninvasive verification of the retention of microbubbles to the endothelium (Figure 5). Data illustrate the presence of microbubbles in the vessel by the PI sequence (see Figure 5, left), as well as the adherent bubbles only, determined after slow-time filtering (see Figure 5, right). Saline was the flow medium in this experiment, and the flow direction was from the left to the right of the images. The adherent microbubbles accumulated downstream of the flow at the lower or distal wall of the carotid artery. This spatial pattern of accumulation can be attributed to the effects of the fluid velocity and the radiation force exerted by the pulse on the microbubble. At the end of 16 seconds, the destruction sequence was applied and the adherent DiI-loaded microbubbles were destroyed.

Images obtained from the selective molecular imaging sequence with (right) and without (left) slow-time filtering of the received pulse inversion data. The flow velocity of saline flowing through the ex vivo artery was approximately 10 cm/s. The concentration of the microbubbles was 20 × 106/mL. Imaging was performed at 8 MHz (single-cycle pulses), and radiation force was applied using 20-cycle 4 MHz pulses at PRF of 42 kHz (MI = 0.2). For destroying microbubbles, an MI of 1 was used with all other parameters similar to that of the radiation force pulse. The dynamic range of the images is 25 dB, and the direction of flow of microbubbles is from the left to the right of the image. The field of view is 18 × 18 mm.
Composite bright-field and fluorescence images of cross sections of the insonated swine carotid from upstream, downstream, and beyond the field of view (FOV) of insonation were used to verify the spatial location of fluorophore deposition (Figure 6, A-C). The red color on the composite images originates from the DiI fluorophore in the shell of the destroyed microbubbles that were transferred to the inner wall of the swine carotid. The upstream, downstream, and beyond the FOV of insonation locations are 1, 13, and 25 mm from the left of Figure 6D, respectively. The microscopy images of the histologic sections were also compared to the corresponding locations on the slow-time filtered images (see Figure 6D). The fluorescence signal from the lower wall was used to quantify the relative aggregation of adherent microbubbles to the endothelium of the carotid artery (Figure 7). In arbitrary brightness units, the fluorescence signal from upstream, downstream, and beyond the FOV of insonation locations were 5, 30, and 6, respectively.

Superimposed fluorescence and bright-field images of the various cross sections of the swine carotid artery in Figure 5: (A) upstream, (B) downstream, and (C) beyond the field of view of the applied sequence. D, Ultrasound image at the end of the applied sequence and the corresponding locations from where the sections (a, b, and c) were excised. Arrows indicate DiI signal (red) on the endothelial cell wall.
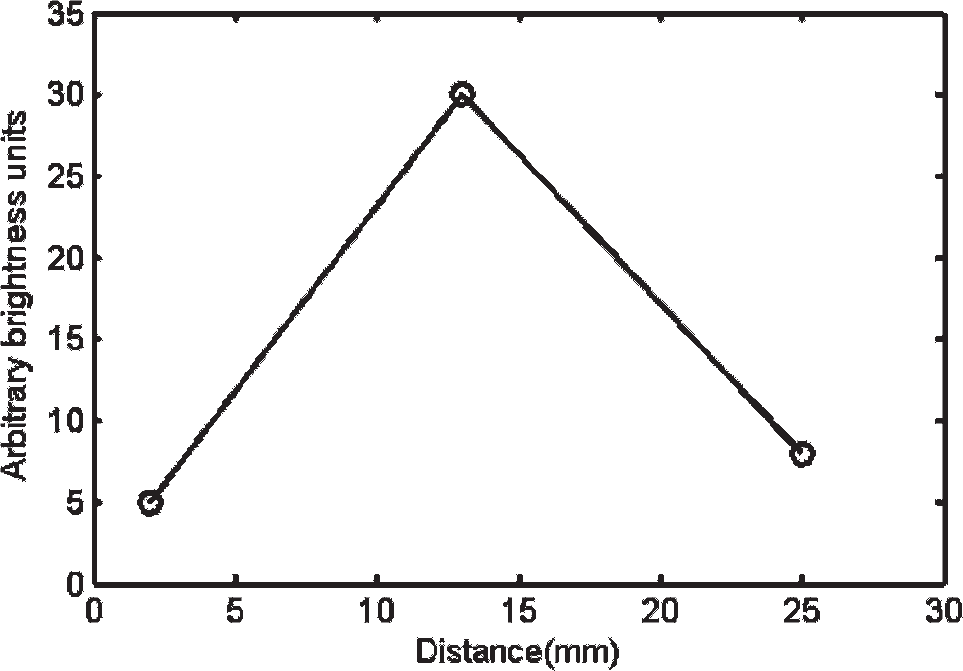
A plot of fluorescence DiI signal from the lower arterial wall in Figure 6, A to C, quantified in arbitrary brightness units.
The composite bright-field and fluorescence images of the cross section of the insonated swine carotid (≈2 mm diameter) also demonstrated DiI delivery to the endothelium (Figure 8, A-E). Histologic cross sections were obtained from 0, 2 (both upstream), 9 (midstream), and 18 mm (downstream) from the left of the image (see Figure 8, A-D, respectively). Cross sections were also obtained from beyond the FOV of insonation (see Figure 8E). The fluorescence signals from upstream (0 and 2 mm) and midstream locations were 5, 40, and 45 arbitrary brightness units, respectively, and the fluorescence signals recorded from downstream and beyond the FOV of insonation were 38 and 4 arbitrary brightness units (Figure 9).

A to E, Superimposed fluorescence and bright-field images of the various cross sections of the swine carotid artery and the (F) corresponding locations from where these sections were excised; the artery was 2 mm in cross-sectional diameter. The flow velocity of saline flowing through the ex vivo artery was approximately 10 cm/s. The concentration of the microbubbles was 20 × 106/mL. Imaging was performed at 8 MHz (single-cycle pulses), and radiation force was applied using 20-cycle 4 MHz pulses at PRF of 42 kHz (MI = 0.2). When destroying microbubbles, MI was increased to 1.0, and all other parameters remained the same as that used during the radiation force pulse. Arrows indicate DiI signal (red) on the endothelial cell wall.

Fluorescence DiI signal from the lower arterial wall in Figure 8, A to E, quantified in arbitrary brightness units.
Slow-time filtered images obtained from the application of the image-guided drug delivery sequence to the ex vivo swine carotid samples show the accumulation of the adherent microbubbles (Figure 10, A-D). The flow medium in this experiment was whole blood (30% hematocrit), and the flow was from the left to the right of the images. At the end of 16 seconds, the destructive sequence was applied and the DiI-loaded adherent microbubbles were destroyed. A plot quantifying the fluorescence signal obtained from the lower wall of the arterial sections corresponding to various locations is illustrated in Figure 10E. The upstream (2 mm, 5 mm) and the midstream (10 mm) fluorescence signals were 2.5, 12, and 14 arbitrary brightness units. The fluorescence signals from downstream and beyond the FOV insonation location were 16 and 3 arbitrary brightness units, respectively.

A to D, Images obtained from the molecular imaging and drug delivery sequence with slow-time filtering of the received pulse inversion data. E, A plot of fluorescence DiI signal from the lower arterial wall in histology cross sections obtained from various longitudinal positions denoted in D. The flow velocity of blood (30% H) flowing through the ex vivo artery was approximately 10 cm/s. The concentration of the microbubbles was 20 × 106/mL. Imaging was performed at 8 MHz (single-cycle pulses), and radiation force was applied using 20-cycle 4 MHz pulses at PRF of 42 kHz (MI = 0.2). For destroying microbubbles, an MI of 1 was used with all other parameters similar to that of the radiation force pulse. The dynamic range of the images is 25 dB, and the direction of flow of microbubbles is from the left to the right of the image. The field of view is 20 × 25 mm. Arrows indicate adherent microbubbles on the distal vessel wall.
Discussion
In this article, we reported the implementation and ex vivo validation of a modified technique for selective molecular imaging. We also demonstrated its application for enhancing localized fluorophore delivery in flow conditions that may be encountered in a clinical setting (blood, flow conditions, and artery size). It is worth noting that both imaging and drug delivery sequences were implemented at MIs and ISPTAS that are within the diagnostic ultrasound limit (ie, MI < 1.9 and ISPTA < < 720 mW/cm2). These sequences were implemented on a conventional ultrasound scanner and ultrasound probe with no change in transmit or beam-forming interface and minor changes in the postprocessing signal path and user interface. Previous research work on drug and gene delivery used significantly higher ultrasound intensities 14 , 24 and lacked real-time spatiotemporal feedback. 24 The imaging and radiation force parameters used in this work were based on previously conducted preliminary in vitro studies and are optimal for the thin-shelled lipid microbubbles and the instrumentation used in this work. 16 The ultrasound parameters used for destroying microbubbles were significantly lower than those necessary for cell destruction. 14 The microbubble dose concentration used in ex vivo and in vitro fluorophore delivery experiments (20 × 106/mL) was at the higher end of the range (2 × 10⁶ to 22 × 106/mL) tested in our previous work. 16 This enabled a higher signal to noise ratio and aided visualization.
Our current research scanner (Ultrasonix RP) has limited capabilities in terms of ultimate microbubble sensitivity and specificity arising out of limitations with its hardware (ie, ability to produce perfect inverted replica pulses for PI imaging). Newer versions of the Ultrasonix scanner are believed to overcome these problems and will probably enable improved sensitivity and specificity even with lower microbubble concentrations and lower ultrasound intensities. Alternatively, higher-performance ultrasound scanners (such as a Siemens Sequoia or similar) may, in principle, be adapted to use the techniques described here. Unfortunately, scanners other than the research user-oriented Ultrasonix scanner generally require engineering development by the manufacturer, and in our experience, this expenditure of engineering resources is difficult to arrange.
Data presented in Figure 3, A and B, summarize the significant differences observed in the rate of accumulation and final concentration of accumulated microbubbles at the target site when high-viscosity saline (4 cp) and blood with varying hematocrit were used. This observation underlines the significance of interaction between microbubbles and RBCs and needs further investigation. Slow-time filtering efficiently eliminates signals from moving microbubbles and retains signals from static or wall-bound microbubbles, thus aiding selective molecular imaging (see Figure 5, right). The static microbubble signal in vessels where blood was the flow medium (see Figure 10, A-D) is muted when compared to microbubble signal where saline was used (see Figure 5, right). This is due to the interaction of microbubbles and RBCs, which impede the translation of microbubbles to the lower vessel wall. Nevertheless, measurable signal (ultrasound and fluorescence) can still be detected from the distal or lower arterial vessel wall (see Figure 10E).
It should be noted that in Figure 6 and Figure 8, the fluorescence signal from the inner wall of the swine carotid is localized in a sector. This is attributed to the directivity of the radiation force pulse. Whereas a one-dimensional linear array cannot steer its beam in the elevation dimension, a two-dimensional array can steer its beam in the elevation dimension. By taking advantage of the elevational beam steering and translation of insonating aperture, it may be possible to direct microbubbles around a broader sector of an arterial cross section, thus improving spatial localization of drug delivery. Whereas the fluorescence signal from the inner wall of the smaller carotid (2 mm diameter) in Figure 8 is approximately uniform in intensity and spatial extent (upstream to downstream), the larger carotid artery exhibited reduced accumulation and lower signal (see Figure 6). This is most likely due to the larger distances that the microbubbles must travel before coming in contact with the lower vessel wall.
The results presented in this work suggest that this approach provides real-time semiquantitative tools for investigating early detection of molecular expression of pathology in large-animal models such as swine. The arterial sizes and blood flow regimens in these models are closer to humans than those in mice or rat models. The drug delivery sequence of our technique may also increase the efficacy of various drug delivery agents via higher spatial localization owing to the directivity of the radiation force pulse. This combined imaging-drug delivery approach may be further extended to intravascular ultrasound catheter-based drug delivery systems that may provide higher localization and targeted drug delivery at lower-dose concentrations. 24
Footnotes
Acknowledgments
We are grateful to Brooks Taylor Jr for software implementation on the programmable scanner. We acknowledge Ali H. Dhanaliwala, Sunil Unnikrishnan, Jose Tlaxca, and Bryce T. Lowrey for their help with experiments.
Financial disclosure of authors: Dr. Ann H. Macleod-Lambert (Gore's Processing, Edinburg, VA) provided the swine tissue and bovine blood used in this study. This work was partially supported by National Institutes of Health National Institute of Biomedical Imaging and Bioengineering grant EB 002185 and National Heart, Blood and Lung Institute grant HL090700 to J.A.H.
Financial disclosure of reviewers: None reported.
Appendix
Cell viability after ultrasonography was measured using a viability kit (LIVE/DEAD Viability/Cytotoxicity Assay Kit, Invitrogen). Briefly, SVEC4-10 endothelial cells were plated on OptiCells and grown until 80% confluent, as detailed in the Methods section. The medium was then replaced with a Dulbecco's phosphate buffered saline solution containing calcein AM and ethidium homodimer 1. The OptiCell was then immersed in a 37°C water bath and insonated (in the presence of microbubbles with a concentration of 20 × 106/mL) using the destruction pulse with parameters detailed in Table 1. The MI of insonation was 1.9. After insonation, the OptiCells were imaged using fluorescence microscopy and analyzed. Images were taken from outside and within the area of insonation (see ![]() , A and B, respectively). The green color denotes live cells, and the red color denotes dead cells. The superimposed red on green color indicates a viable cell whose cell membrane was transiently permeablized, allowing ethidium homodimer 1 to bind with the deoxyribonucleic acid (DNA). It is observed that most cells in the region of insonation are viable and/or permeablized and all cells outside the insonated region are viable.
, A and B, respectively). The green color denotes live cells, and the red color denotes dead cells. The superimposed red on green color indicates a viable cell whose cell membrane was transiently permeablized, allowing ethidium homodimer 1 to bind with the deoxyribonucleic acid (DNA). It is observed that most cells in the region of insonation are viable and/or permeablized and all cells outside the insonated region are viable.