
Abstract
Mutated adenomatous polyposis coli (APC) genes predispose transformations to neoplasia, progressing to colorectal carcinoma. Early detection facilitates clinical management and therapy. Novel lectin-mediated polymerized targeted liposomes (Rh-I-UEA-1), with polyp specificity and incorporated imaging agents were fabricated to locate and image adenomatous polyps in APCMin/+ mice. The biomarker α-
THE PATHOLOGY OF COLORECTAL CARCINOMA (CRC) evolves through normal colon, adenoma, adenoma with high-grade dysplasia, and invasive adenocarcinoma.
1
Biomarkers of CRC may spawn from colonocytes, and these biomarkers may be detectable either in feces or by targeted molecular imaging. Lectins are plant and animal proteins with specific sugar moiety affinities and a range of functions, from cell-cell recognition and adhesion to glycoprotein synthesis. Lectin-binding sites and regional binding differences have been observed in association with colorectal lesions. Clinical specimens of normal mucosa and cancerous lesions were examined with the lectin Ulex europaeus agglutin-1 (UEA-1).
2
Yonezawa and colleagues found 82% binding of UEA-1 by carcinomas of the rectum, whereas 0% binding was observed in the normal mucosa of the rectum; UEA-1-binding differences between the right and left colon were also reported.
2
Primarily, in the left colon, cancerous tissue bound UEA-1 79% versus 10% UEA-1 binding of nonneoplastic mucosa; UEA-1 binding in the right colon was reported as 71% for carcinoma, with 100% UEA-1 binding for the normal mucosa. A correlation was suggested between positive UEA-1 binding in rectal carcinoma and the α-
In an animal study of lectin-binding sites, rat mucosa artificially induced with the carcinogen 1,2-dimethylhydrazine (DMH) to undergo colonic transformation positively bound the lectins UEA-1 and peanut agglutinin (PNA) versus non-DMH-treated rats. 3 The authors reported 100% distal and proximal colon carcinoma labeling with UEA-1 and 50 and 60% carcinoma labeling in the proximal and distal colon, respectively, with PNA. In the same study, a labeling discrepancy was reported between regions of the colon in the non-DMH-treated rats with UEA-1. For example, the lectin labeled 100% of the proximal tissue and 0% of the distal colon; these findings resemble similar clinical results. 2 The PNA lectin labeled neither the distal nor the proximal colon in the control rats.
UEA-1-modified polymerized liposome for targeting the M cell as an oral vaccine vehicle was originally reported by Chen and colleagues using polymerizable lipid, 1, 2-bis(2,4-octadecadienoyl)-sn-glycero-3-phosphorylcholine (DODPC). 4 In recent years, an ultraviolet (UV) polymerizable diacetylenic phosphatidylcholine l,2-bis(tricosa-10, 12-diynoil)-sn-glycero-3-phosphocholine (DAPC; Avanti Polar Lipids, Alabaster, AL) was found to form stable liposome with l,2-dimyristoyl-sn-glycero-3-phosphocholine (DMPC) in buffer and plasma 5 ; a 1;1 ratio of DAPC to DMPC polymerized efficiently with a relatively high stability. 6 To exploit the affinity of lectins for the mucin carbohydrate backbone, we conjugated UEA-1 onto the outer surfaces of polymerized liposomes, which have rhodamine and are also encapsulated with an iodine imaging contrast agent, iohexol (Omnipaque, GE Healthcare, Piscataway, NJ). UEA-1 was selected as a ligand of interest because polyps may secrete surface mucins. The murine model of CRC, APCMin/+, was used to show that Rh-I-UEA-1 liposomes are targeted to polyps, surface bound, and detectable by the imaging modalities multispectral optical imaging (MSI), micro-computed tomography (microCT), and optical coherence tomography (OCT) + fluorescence molecular imaging (FMI).
Methods
Lectin Immunohistochemistry
Paraffinized intestinal sections containing adenomatous polyps (N = 13 specimen) were obtained from heterozygous male C57BL/6J APCMin/+ mice (Jackson Laboratories, Bar Harbor, ME, stock 002020, 8 weeks old, 25 g). The paraffin was warmed by heating the tissue sections to 60°C for 30 minutes; warmed paraffin sections were deparaffinized in 3× xylene, 100% ethanol (EtOH), 75% EtOH, 50% EtOH, and H2O. The final wash was in phosphate-buffered saline (PBS). The sections were incubated in two antibody-blocking solutions for 10 and 30 minutes, respectively. Lectin staining for carbohydrate expression was performed overnight at 4°C. Fluorescein isothiocyanate (FITC)-labeled lectins were commercially purchased (in a kit) from Vector Laboratories (Burlingame, CA). The lectins were diluted 1:500 using antibody diluent (Zymed, Carlsbad, CA), to a final concentration of 5 μg/mL; the FITC-lectins used in this experiment were concavalin A (ConA), Dolichos biflorus agglutinin (DBA), PNA, Ricinus communis agglutinin (RCA), soybean agglutinin (SBA), UEA, wheat germ agglutinin (WGA), jacalin (Jac), and Sambucus nigra agglutinin (SNA). The tissue sections were counterstained with DAPI, (2-(4-amidinophenyl)-1H-indole-6-carboxamidine) and were subsequently viewed for carbohydrate expression by fluorescent microscopy.
Ex Vivo MSI
C57BL/6J APCMin/+ specimens were incubated in 200 µUL Rh-I-UEA-1-targeted polymerized liposomes or Rh-I-polymerized control liposomes for 30 minutes at room temperature in a closed Petri dish. The tissues were washed twice each in 1× PBS for 5 minutes with shaking before MSI. For UEA-1-conjugated liposome studies, 27 polyps and 6 normal adjacent specimens were analyzed. Of the fresh specimens incubated with nonconjugated liposomes, 13 were studied as experimental polyps and 6 specimens were collected from the mucosa of normal adjacent tissue. MSI was performed using a high-sensitivity CRi Maestro imaging system (Woburn, MA). Imaging was performed at 10 nm intervals over the spectrum 500 to 720 nm, with an 800 ms exposure at each interval; the major peak was found at 560 nm. Background scatter was subtracted from the final reconstructed image. Representative bright-field images were also photographed.
Polymerization of Rh-I-UEA-1-Conjugated Liposomes
Liposomes were made by the extrusion method. The total lipid in chloroform was dried to form a thin film, which was hydrated with iodinated contrast solution, extruded, and cross-linked to form polymerized liposomes. The UEA-1 was subsequently conjugated to the liposomes. Briefly, 40 μmol of the polymerizable diacetylene phospholipid DAPC was mixed with 40 μmol of the saturated “spacer” lipid dimyristoylphosphatidylcholine DMPC (Lipoid, Newark, NJ), or functionalized lipid, DMPE-GLU (N-glutaryl-
For UEA-1 conjugation, polymerized liposomes were exchanged into 0.1 M MES buffer (pH 4.7) using a PD-10 column according to the manufacturer's instructions, GE Life Sciences, USA. 1-Ethyl-3-(3-dimethylaminopropyl)-carbodiimide (EDC) (30 mg, 156 μmol) and sulfo-N-hydroxysulfosuccinimide (NHS) (85 mg, 383 μmol) were added to the liposome solution and mixed for 10 minutes at room temperature. The liposomes were then exchanged into PBS (pH 7.4) using a PD-10 column, and 20 mg of UEA-1 in PBS buffer was added. The final concentration of UEA-1 in the reaction mixture was 1 mg/mL. The mixture was incubated at 4°C on a shaker overnight. The mixture was then loaded onto a 100K Amicon ultrafiltration spin-column (Millipore, Billerica, MA) and washed with PBS (3 × 10 mL) three times at l,000g. This process was monitored by Agilent high-performance liquid chromatography (HPLC); a TSK-G6000PW column was used with a flow rate of 1 mL/min. More PBS wash was done until there was no unbound UEA-1. The flow-through of each centrifugation was collected and tested for UEA-1 amounts using a commercial bicinchoninic acid (BCA) kit from Pierce (Rockford, IL). The amount of UEA-1 conjugated to polymerized liposomes was determined by subtracting the unbound UEA-1 from the initial addition of 20 mg. Both control liposome and UEA-1-conjugated polymerized liposomes were analyzed by dynamic light scattering (DLS) using a Malvern Zetasizer ZS (nanoComposix, San Diego, CA) and transmission electron microscopy (TEM). The liposomes were stored at 4°C until further use.
Liposome Incubation of Formalin-Fixed and Fresh Frozen Tissue
Freshly excised C57BL/6J APCMin/+ small and large bowels (N = 3) were quickly preserved in 4% paraformaldehyde and stored at — 80°C until further use. Additionally, male C57BL/6J APCMin/+ mouse bowels commercially purchased from Jackson Laboratories were used (N = 10). The bowels were incubated in 200 µUL Rh-I-UEA-1 (targeted) liposome or control liposome (no UEA-1) for 30 minutes at room temperature in a closed Petri dish. The tissues were washed twice each in 1× PBS for 5 minutes with shaking before all imaging experiments.
Micro-Computed Tomography
All fresh tissue described henceforth were incubated according to the experimental procedures outlined in the section on ex vivo MSI. For UEA-1-conjugated liposome studies, 27 polyps and 6 normal adjacent specimens were collected from male C57BL/6J APCMin/+ mice (Jackson Laboratories). On tissue incubation and washing and prior to imaging, the specimens were bonded to laminate bases (4 × 2 cm) with adhesive Super Glue. Representative baseline microCT images were taken of corresponding experimental polyps and normal specimens; therefore, 27 baseline polyps were under review for the UEA-1-conjugated liposome study. Of the fresh specimens incubated with nonconjugated liposomes, 13 were studied as experimental polyps and 6 specimens were collected from the mucosa of normal adjacent tissue. As described earlier, baseline microCT images were taken of corresponding experimental polyps and normal specimens; therefore, 13 baseline polyps were reviewed for the nonconjugated liposome study.
MicroCT was achieved using a SkyScan 1172 (Micro Photonics, Allentown, PA) high-resolution microCT scanner. Imaging parameters were 80 kV with a frame average of 8, 125 μA, 0.5° rotation step, 35 μm pixel size, and 158 ms exposure. Three-dimensional reconstruction was executed with corrections for ring artifacts and beam hardening via the image reconstruction software NRecon (Skyscan, Kontich, Belgium). Image analyses were accomplished via the software program Data Viewer version 1.3.2 (Skyscan, Kontich) and the public domain Java-based image processing program ImageJ. DataViewer was implemented to manually determine the positions of the polyps in the x, y, and z axes. The z-axis slice numbers equivalent to the surfaces of the polyps were used as input for ImageJ voxel-based region of interest measurements at the polyp surface. The unit output of the ImageJ measurements was the grayscale. The grayscale values were converted to Hounsfield units (HU) based on experimental parameters and computed tomographic (CT) settings (ie, normalization of water, kV, frame averaging). Five slices were measured, at the polyp surface, per polyp.
OCT with FMI
Fresh tissue samples were incubated in Rh-I liposomes conjugated with and without the UEA-1 lectin as described throughout. Four tissue samples were used for OCT + FMI.
Light is produced from wavelength-swept light by a high-speed, high-resolution OCT operating system. It generates a broadband spectrum of 100 nm at 1,300 nm, which provides an axial resolution of 10 urn in the tissue. The laser operates at a sweep rate of 16 kHz (equivalent to an imaging speed of 15 frames per second for a 1,024 axial-line image) with an average output power of 12 mW. The system sensitivity is 95 dB. A Michelson interferometer composed of one circulator and a fiberoptic 50/50 splitter is used to generate the Fourier-domain OCT signal. The OCT interference signal returned from both the sample and reference arms is detected by a balanced photodetector. A Mach-Zehnder interferometer (MZI) with a fixed path difference is used to create an optical frequency clock. Data acquisition is triggered by the zero-crossings of the MZI fringes, which are evenly spaced in optical frequency. Discrete Fourier transform is performed on the data to generate an axial depth profile of the sample (A-line) with 3 mm imaging depth and 512 pixels. 7
The FMI system uses a continuous-wave solid-state laser at 532 nm as the excitation source. The excitation light is combined with the OCT sample arm using a dichroic mirror. The typical illumination power on the sample is approximately 5 mW. The reflectance and fluorescence light is detected by the same fiber and then connected to a fiber splitter to divide the collected light into reflectance and fluorescence signals. The simultaneous measurement of reflectance and fluorescence signals from the same source and detector geometry are important for minimizing the influence of optical coupling variation for both excitation and collection paths. The reflectance signals are detected by avalanche photodiodes, whereas the fluorescence signals first pass through an emission filter set (600 ± 10 nm) and then are detected by a photomultiplier tube. The illumination and filter wavelengths are chosen based on the excitation and emission properties of the fluorescent dye rhodamine. 8
Statistical Analysis
Data were entered into Excel worksheets (Microsoft Corporation, Redmond, WA) and analyzed using the nonpaired, two-tailed Student t-test with unequal variance. A p value < .05 was regarded as significant. Statistical analyses were generated using the statistical software Minitab (Minitab, Inc., State College, PA) and MATLAB (The MathWorks Inc., Natick, MA).
Results
Lectin Immunohistochemistry
Paraffin-fixed intestinal tissue sections (N = 13; 9 initially, 4 repeated with best lectin) from male C57BL/6J APCMin/+ mice were deparaffinized and stained with 9 FITC-lectins each for immunohistochemistry analysis. One of nine lectins, the FITC-UEA-1, stained the polyps but not the adjacent normal tissue (Figure 1). Three of nine lectins stained the normal mucosa but not the polyp (RCA, ConA, PNA); three of nine lectins stained the polyp with no differentiation over the normal mucosa (SNA, JAC, SBA); and two of nine lectins showed carbohydrate expression at the polyp and a high background in the normal tissue (WGA, DBA).
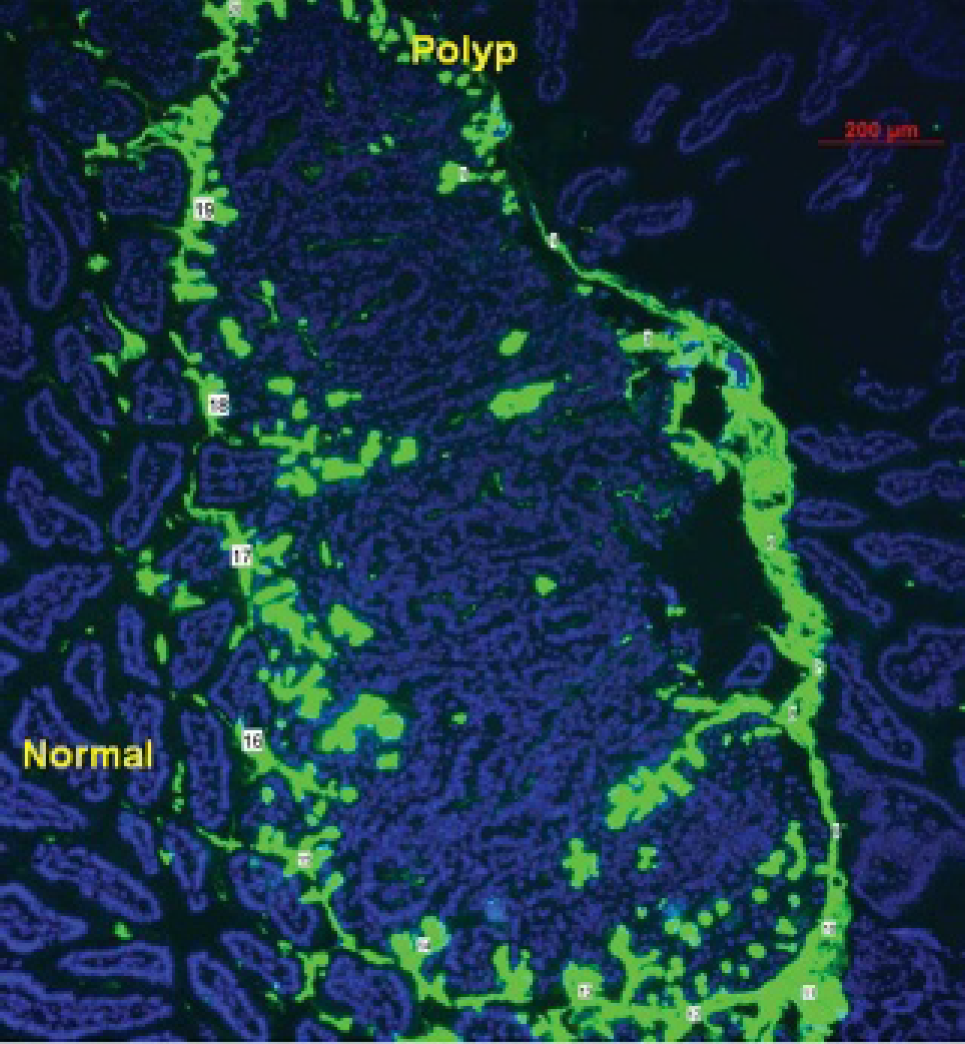
FITC-UEA-1 lectin shows excellent differential glycoprotein expression between polyp and normal cells. The numbers mark where the mucin layer was measured (ImageJ processing software). The average measurement of the mucin layer was 53.44 ± 27.03 μm.
The image analysis and processing software ImageJ was used to measure average thickness along the mucin layer. As illustrated in Figure 1, the average thickness of the mucin layer was 53.44 ± 27.03 μm (N = 20). When FITC-UEA-1 was used to incubate the colon tissue prior to slicing, fluorescence of the lectin label was indicated at the polyp surface, thereby confirming α-

FITC-UEA-1 binds to the surface of the polyp even when the colon is incubated prior to slicing, thus confirming that the lectin is a viable ligand for surface targeting of the polyps in the APCMin/+ specimen.
In Vitro MSI
Twenty-seven polyps and six normal adjacent tissues were studied for UEA-1-conjugated liposome incubation; 13 polyps and 6 normal adjacent tissues were investigated for nonconjugated liposome incubation. MSI showed positive correlation with specific binding of Rh-I-UEA-1 by the polyp. Within-tissue comparisons of fluorescence intensity of Rh-I-UEA-1-labeled specimens yielded a target to background ratio of 1.74 (N = 27; 240.91 ± 12.12; normal adjacent tissue [N = 6; 138.38 ± 11.46]). Similar evaluations of the control liposomes yielded a target to background fluorescence intensity ratio at the polyp of 1.34 (N = 27; 171.49 ± 33.26; normal adjacent tissue [N = 6; 128.26 ± 31.89]). Accordingly, the polyp-labeling efficiency of Rh-I-UEA-1 was significantly better (p < .05) by 1.4 times that of the control liposomes (N = 27; 240.91 ± 12.12 versus N = 6; 171.49 ± 33.26). The polyps are distinctly identified when APCMin/+ tissues are incubated with Rh-I-UEA-1, whereas control liposomes (no UEA-1) do not label polyps (Figure 3). Figure 4 shows APCMin/+ tissue that has been incubated with Rh-I-UEA-1; the polyp is clearly labeled, and the normal mucosa has low, nonspecific binding.

Ex vivo multispectral optical imaging of excised APCMin/+ tissue incubated in Rh-I-UEA-1-targeted liposomes (A: right) or control liposomes (no UEA-1; A: left); arrows indicate polyps. Rh-I-UEA-1-targeted liposomes show specificity toward polyps in APCMin/+ tissue, as seen with incorporated rhodamine contrast agent (B) and with background subtraction (C).

Optical image of liposomal binding. Rh-I-UEA-1 liposomes have greater specificity toward polyps (shown as arrows in bright-field image A) versus nonspecific binding of normal mucosa (shown as arrows in fluorescent image B) in APCMin/+ tissue; C shows background subtraction.
Polymerization of Rh-I-UEA-1-Conjugated Liposomes
A pictorial representation of the liposomes is shown in Figure 5A. The size distributions of both control and UEA-1-conjugated liposomes were analyzed by DLS; the control liposomes had a hydrodynamic size of 58.3 ± 11.29 nm (n = 5), and the UEA-1-conjugated liposomes had a size of 72.17 ± 8.95 nm (n = 7). The size distributions of UEA-1-conjugated liposomes were stable over a period of 2 weeks in PBS. Figure 5B shows representative DLS of control and UEA-1-conjugated liposomes, and Figure 5C is a TEM image of liposomes.

A, Pictorial representation of the liposomes. B, Representative dynamic light scattering of control and UEA-1-conjugated liposomes. C, Transmission electron micrograph of liposomes showing spherical and tubular morphology owing to mixing of two types of lipids; the average size is 53.34 ± 23.20 nm. D, High-performance liquid chromatography of purified UEA-1 liposomes (retention time 8.4 minutes).
For determining the total amount of UEA-1 conjugated to the liposomes, flow from 100K Amicon ultrafiltration columns was collected and quantified using bovine serum albumin (BSA) as standards. HPLC was used to monitor the purification process and sample analyses. UV absorbance at 550 nm, rhodamine's UV absorbance wavelength, was used for monitoring liposomes, whereas UV absorbance at 280 nm was used for detection of UEA-1. Figure 5D shows the HPLC of purified UEA-1 liposomes (retention time 8.4 minutes). The total amount of UEA-1 conjugated to the liposomes was 4.11 ± 1.60 mg (n = 7).
Micro-Computed Tomography
Rh-I-UEA-1 liposomes qualitatively suggest targeted labeling of the polyps along the mucin surface, as shown in Figure 6. However, quantitative analyses of mean Hounsfield units (mean ± SD) did not show preferential binding of the Rh-I-UEA-1-targeted liposomes at the polyp surface versus the nontargeted liposomes owing to beam hardening along the image periphery. Therefore, the results were inconclusive and did not yield significance.

Computed tomographic image of a polyp (A, red arrow) incubated with Rh-I-UEA-1. Blue arrows show the surface of the polyp. Transaxial slices were taken (A, red line); three-dimensional images are shown. Y (B, top) and Z (B, bottom) orientations are shown. In B, images are false color cross-sections taken from the imaging volume.
OCT with FMI
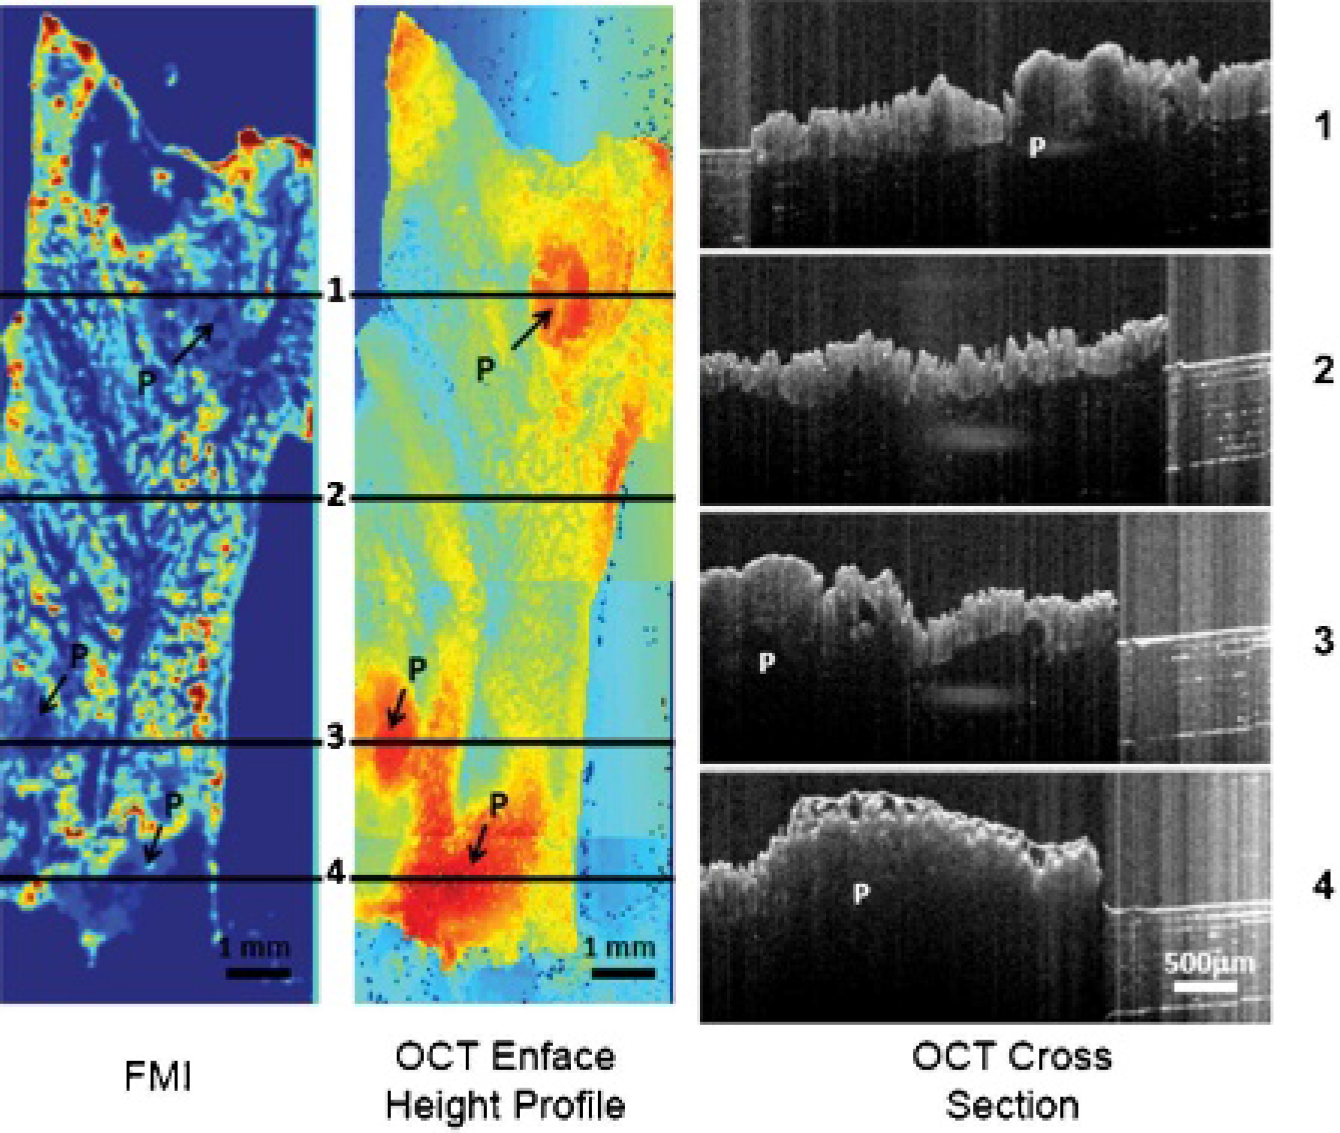
Twenty-eight total polyps were analyzed by OCT + FMI (12 conjugated, 16 nonconjugated). Figure 7 shows greater binding in polyps versus normal mucosa. The polyp to background ratio was significantly higher (p < 10<sp>−6) in conjugated (1.45 ± 0.18) samples versus nonconjugated samples (0.74 ± 0.16), as shown in Figure 8. Figure 9 shows the OCT + FMI compilations of an APCMin/+ specimen incubated with Rh-I-UEA-1. In the FMI profile, the targeted liposomes labeled the outer ring, or surface, of the polyps. There was residual background noise around the edges of the tissue owing to liposomes sticking between the tissue and the laminate base and incompletely washing away. The OCT height profile details the height of the polyp in relation to normal adjacent tissue, and the OCT cross section recognizes the distinguishing crypts of adenomatous polyps. Polyp height was 1 to 2.5 mm.

Rh-I-UEA-1-targeted liposomes bind APCMin/+ adenomatous polyps. Binding is greater in polyps (arrows) versus normal mucosa (multispectral optical imaging, left); binding by nontargeted liposomes (optical coherence tomography [OCT] + fluorescence molecular imaging [FMI], right) is less than by targeted liposomes (middle). The third OCT panel is a height profile of tissue in targeted image and is used in polyp localization.

Fluorescence image (FMI) and optical coherence tomography (OCT) en face height profile image from the conjugated sample. Also shown in the image are four OCT cross-sectional images from lines 1, 2, 3, and 4 in the OCT en face height image. “P” in the images indicates polyp regions.
Fluorescence image (FMI) and optical coherence tomography (OCT) en face height profile image from the nonconjugated sample. Also shown in the figure are four OCT cross-sectional images from lines 1, 2, 3, and 4 in the OCT en face height image. “P” in the images indicates polyp regions.
Contrary to the surface labeling found at the outer ring of the polyps by Rh-I-UEA-1, the nonconjugated liposomes did not label polyps. The OCT height profile and cross section of an APCMin/+ specimen incubated with nonconjugated liposomes correctly identified the polyp positions and characteristic crypts; however, from the FMI profile, there was no labeling of the polyps by nonconjugated liposomes. Again, background noise was inherent at the edges of the tissue.
Discussion
Polymerized liposomes have been suggested as an oral vaccination vehicle with different lipid compositions.4–6 DAPC and DMPC lipid composition was selected for this study owing to the availability of both lipids; also, this lipid composition has been studied extensively. Enhanced polymerization was reported when DMPC was added to DAPC with a 1:1 ratio,
9
and liposomes with this composition exhibit relative stability in saliva when compared to other compositions
5
; therefore, this composition holds promise for oral delivery. In this study, novel lectin-mediated polymerized targeted liposomes, Rh-I-UEA-1, were fabricated to detect and image polyps in the APCMin/+ murine model of colon cancer. The lectin UEA-1, which is sensitive to the expression of the carbohydrate α-
The stimulus to produce a polyp-specific contrast agent in the APCMin+ model was extrapolated from clinical findings in our laboratory detailing the first quantitative computed tomographic colonography (CTC) results of oral contrast adherence to the surfaces of polyps. O'Connor and colleagues found 46% surface tagging of polyps by oral contrast administration of barium sulfate (Ba2SO4) and Gastrografin. 10 Increased attenuation of fecal matter distinguishes stool from polyps immersed in pools of oral contrast. Oral contrast homogeneously mixes with stool, appearing inside the stool on CT. However, with polyps, the contrast appears outside the object on CT because it coats the surfaces of the polyps. Radiologists must maintain prudence to avoid identification of false lesions 11 ; nevertheless, it was a significant finding that 46% of the polyps had a surface labeling of adherent contrast. Of special clinical note, too, was that polyps with a villous component, associated with a greater risk of malignancy, 12 had 77% adherent contrast. Thus, enhanced polyp specificity outlines the motivation to design a marker. In context with the hypothesis that atypical mucus production may underlie preferential oral contrast adherence to villous polyps, 10 such a marker was sought, with the novel fabrication of Rh-I-UEA-1.
Mucins are high-molecular-weight glycoproteins located in the goblet cells that proliferate the crypts of the colon and rectum. Functions of the colonic intestinal mucin layer include nourishing the bacteria as a food source, 13 absorption of Na+,14 and facilitating the binding of Ca2+ by intestinal goblet cells. 15 Mucin-associated carbohydrate expression becomes altered during the progression to malignancy in CRC. 16 MUC1 was implicated in reducing E-cadherin-assisted epithelial cell-cell adhesion when transfected into murine fibroblast cells (which do not independently demonstrate cell-cell communication) with E-cadherin complementary DNA. 17 Given MUC1's apparent role in inhibiting cellular adhesion, it was postulated that noncohesion results from loss of cellular polarity; meanwhile, abnormal glycosylation may permit attachment of malignant cells to epithelia along the path to metastasis. 18 Nakamori and colleagues correlated MUC1 expression to the clinical stage of disease using surgically resected specimens of adenocarcinoma of the colon and rectum. 19 The authors used two monoclonal antibodies, specific for heavily glycosylated MUC1 and underglycosylated MUC1, to demonstrate mature MUC1 expression in advanced disease. In addition, it has been validated (using selective binding lectins to mucin in the human colon) that “alteration[s] in the exposed, non-reducing carbohydrate residues occur[s] in human colonic mucin during the process of goblet cell differentiation, and exposed carbohydrate structure[s] not normally present in human tissues [are] expressed in the mucin produced by malignant colonic epithelium.” 20
Gastrointestinal mucosal imaging has been reviewed in the literature. 21 , 22 Sodir and colleagues imaged an in-house mouse model of CRC, called APCMin/+Smad3−/−, by small-animal CT. 23 This model is suggested to mimic familial adenomatous polyposis because of solid polyp growth in the distal colon; however, crossing the two genes accelerates tumor growth, which is in contrast to the slow tumor growth represented by the human situation. The authors demonstrated mutant colons with manifold polyps, but the heavy metal barium was elected as the contrast medium. Barium, although common, is not a very selective imaging contrast agent. Therefore, the multiplicity of polyps generated by crossing APCMin/+ and Smad3−/− was not faithfully represented by the in vivo images.
APCMin/+ specimens have also been analyzed by other imaging techniques, including OCT, laser-induced fluorescence (LIF), 24 , 25 and laser-scanning confocal microscopy (LSCM). 25 The LIF technique exploits the autofluorescence of diseased or nondiseased tissue through excitation of endogenous fluorophores in a sample preparation of an exogenous dye. A spectral fingerprint is gained by shining UV light on the sample dye and collecting the tissue emission. LSCM combines LIF with high-resolution confocal microscopy. In the study reported by McNally and colleagues, the sensitivity to imaging is questionable with the use of exogenous fluorescent dyes, and time may be an issue when collecting in vivo images throughout the distal colon. 25 The three modalities (OCT, LIF, LCSM) were used in combination for the elucidation of the analytic results, yet OCT, which is an imaging technique capable of cellular resolution, could not discern the colonic crypts in their experimentation. The difference between their scheme and our imaging paradigm (OCT + FMI) is that we are able to resolve anatomy, including crypts at 10 μn detail.
In our studies, the TEM (see Figure 5) shows both spherical and tubular surface morphology of the liposomes. Our initial expectations were to observe spherical liposomes. Experimental examination led to the finding that the mixture of the two types of lipids during synthesis (DAPC and DMPC or DMPE-GLU) yields a mixed-batch liposomal morphology. According to Yager and colleagues, a polymerizable diacetylenic monomeric (eg, DAPC) lipid will form a hollow tube when cooled slowly through its phase transition temperature (Tm). 26 Additionally, Markowitz and colleagues portrayed a scheme of mixed polymers 1,2-bis(10,12-tricosadiynoyl)-sn-glycero-3-phosphocholine (DC8,9PC) and l,2-dinonanoyl-sn-glycero-3-phosphocholine (DNPC), with a braid-like morphology at different salt and DNPC concentrations; as the molar percentage of DNPC enlarged, the morphology of the structures became increasingly spherical. 27 It therefore appears that the mixed liposomal morphology is reasonable.
Rh-I-UEA-1 binds polyps without washing away, in contrast to the phenomenon occurring at the normal adjacent mucosa, where Rh-I-UEA-1 binds and washes away. Adenomatous polyps may generate more surface mucin than normal mucosa, thereby providing more binding prospects between α-
Rh-I-UEA-1 also has implications as an optical marker for colonoscopy. Here we describe incorporation of the fluorescent probe rhodamine B within polymerized liposomes and its successful discrimination between adenomatous and normal adjacent tissue using MSI and OCT. Other groups have demonstrated colonoscopy using fluorescein-labeled markers and endoscopy. For example, Hsiung and colleagues screened phage display peptides against fresh human colonic adenomas to identify a sequence with preferential binding to premalignant tissue. 28 A specific fluorescein-conjugated peptide sequence was imaged in vivo using a fluorescence confocal microendoscope (through a standard colonoscope) in patients undergoing colonoscopy. The authors found that the fluorescein-conjugated peptide bound dysplastic colonocytes with 81% sensitivity and 82% specificity versus normal adjacent mucosa. In another study, Funovics and colleagues reported in vivo mouse colonoscopy using a two-channel real-time fluorescence microendoscopy imaging system. 29 A proteaseactivated near-infrared (NIR) fluorescent probe and an NIR-nonactivated perfusion probe were used to correlate healthy colon, adenoma, or adenocarcinoma tissue with the concentration of cathepsin B (overexpression correlates with metastasis and angiogenesis in human CRC 30 , 31 ); the paradigms used to study the lesions were the APCMin+/− model of adenoma and a model of adenocarcinoma created by orthotopically implanting murine colon cancer CT26 cells against a nude background. The authors confirmed an increased imaging ratio of protease activity to perfusion across the spectrum from healthy colon to adenoma to adenocarcinoma. 29
Our CT imaging experiments could have been improved with either an imaging agent with an increased saturation point (iohexol 350 mg/mL iodine), or a vesicle that would allow a greater iodine-carrying capacity, for improved discrimination between polyp and normal tissue. Although the iodine imaging source, iohexol, distinguished normal and polyp tissue based on the UEA-1 target, we found the liposome loading capacity of iodine too low to provide sufficient discrimination.
Summary
Novel polyp-specific Rh-I-UEA-1 liposomes were polymerized to target and image adenomatous polyps in the APCMin/+ mouse. Rh-I-UEA-1 had a significantly greater labeling efficiency versus control liposomes, which was verified by MSI and OCT + FMI. These results may have clinical significance for the improvement of sensitivity of polyp detection on CTC in the diagnosis of CRC.
Footnotes
Acknowledgments
We thank Dr. Matt Dreher and Dr. Lawrence Tabak for helpful discussions, Dr. Mari Kono and Dr. Richard Proia for providing mice, and Dr. Shijun Wang for help in preparing the statistical analyses.
Financial dislosure of authors: This research was supported by the Intramural Research Programs of the National Institutes of Health Clinical Center, and National Heart, Lung, and Blood Institute.
Ronald M. Summers has pending and/or awarded patents and Celeste A. Roney and Jianwu Xie have a pending patent in the subject area of this manuscript. Ronald M. Summers receives royalty income for a patent license from iCAD Medical. His lab is supported in part by a Cooperative Research and Development Agreement with iCAD Medical. He is a Johnson & Johnson shareholder.
Financial disclosure of reviewers: None reported.