
Abstract
In this study, we used bioluminescence imaging (BLI) to track long-term transgene activity following the transfection of brain cells using a nonviral gene therapy technique. Formulations of deoxyribonucleic acid (DNA) combined with 30-mer lysine polymers (substituted with 10 kDa polyethylene glycol) form nanoparticles that transfect brain cells in vivo and produce transgene activity. Here we show that a single intracerebral injection of these DNA nanoparticles (DNPs) into the rat cortex, striatum, or substantia nigra results in long-term and persistent luciferase transgene activity over an 8- to 11-week period as evaluated by in vivo BLI analysis, and single injections of DNPs into the mouse striatum showed stable luciferase transgene activity for 1 year. Compacted DNPs produced in vivo signals 7- to 34-fold higher than DNA alone. In contrast, ex vivo BLI analysis, which is subject to less signal quenching from surrounding tissues, demonstrated a DNP to DNA alone ratio of 76- to 280-fold. Moreover, the ex vivo BLI analysis confirmed that signals originated from the targeted brain structures. In summary, BLI permits serial analysis of luciferase transgene activity at multiple brain locations following gene transfer with DNPs. Ex vivo analysis may permit more accurate determination of relative activities of gene transfer vectors.
IN VIVO BIOLUMINESCENCE IMAGING (BLI) employs internal biologic sources of light emitted from a luminescent enzyme, for example, luciferase, to detect labeled tissues. A bioluminescence imager combines the luciferase reporter system with a new generation of charge-coupled device cameras that detect the light transmitted through the animal's tissues; this type of system has opened the door to sensitive in vivo measurements of mammalian gene expression in living animals.1,2 BLI relies on planar imaging principles to noninvasively image optical contrast at depths of several millimeters to centimeters with high sensitivity and submillimeter to millimeter resolution. 3 This is attractive for the evaluation of transgene expression as reporter gene activity can be imaged in the same animal at various time points postinjection; this allows investigators to significantly reduce the number of experimental animals needed to evaluate the duration of transgene activity. BLI has been used in neurologic research to track stem cell and neural progenitor cell migration in brain4,5 and monitor the growth of implanted6,7 or spontaneous 8 brain tumors. A recent viral vector study demonstrated the utility of BLI for measuring luciferase gene expression in the brain of mice or rats injected with a vector. 9 In this study, Deroose and colleagues used a lentiviral vector encoding for luciferase to transduce brain cells in various brain regions, including the striatum and substantia nigra (SN), and followed luciferase activity over several months. 9
We recently used a nonviral technique to transfer genes to cells of the central nervous system. 10 Plasmid deoxyribonucleic acid (DNA) compacted into DNA nanoparticles (DNPs) by 10 kDa polyethylene glycol (PEG)-substituted lysine 30-mer (CK30PEG10k) has been shown to be a promising nonviral technology that appears safe and effective in the lung,11,12 nasal mucosa, 13 eye, 14 and brain. 10 We used this technique to demonstrate that short-term overexpression of the glial cell line–derived neurotrophic factor in the denervated striatum can provide neurotrophic support for fetal cells engrafted into the transfected brain region. 15
In this study, we directly injected DNPs containing plasmids encoding for luciferase into cortex (1.0 to 1.5 mm below the surface of the brain) and two major components of the nigrostriatal pathway: the SN and the striatum. Both are subcortical structures, with the main body of the striatum lying 3.0 to 7.0 mm below the surface of the brain, whereas the SN is a midbrain structure lying 7.0 to 8.0 mm below the surface of the brain. In vivo BLI was assessed at various time points over a 1-year period and ex vivo BLI of brain tissue was determined at 8 and 11 weeks postinjection.
Materials and Methods
Plasmid Construction
DNA vectors were constructed using standard molecular biology techniques, followed by restriction analysis and sequencing of subcloned regions. 16 Detailed methodology for pUL and pUL3 plasmid construction is reported in a previous publication. 10 Figure 1 shows plasmid maps for each plasmid used in these studies.
Preparation of Condensing Peptide
Formulation of DNPs
Compacted DNA was manufactured by adding 20.0 mL of DNA solution (0.1 mg/mL in water) to 2.0 mL of PEGylated condensing peptide (3.2 mg/mL in water) at a rate of 4.0 mL/min by a syringe pump and through sterile tubing ended with a blunt cannula. During this addition, the tube with peptide was vortexed at a controlled rate so that the two materials mixed instantaneously. Peptide and DNA were formulated at a final amine to phosphate ratio of 2:1. The DNP was then filtered through a vacuum-driven sterile filter with a 0.2 μm polyethersulfone membrane. The filtered DNP was then concentrated 20- to 30-fold using VIVASPIN centrifugal concentrators (molecular weight cut off 100k). The concentrated DNA was then diluted 20- to 30-fold with sterile 0.9% NaCl for injection (Baxter, Deerfield, IL) and concentrated again 20- to 30-fold to remove excess peptide and exchange water with physiologic saline. The final concentration of DNA was ≈ 4.0 mg/mL. After formulation, the DNPs underwent several quality control tests, including sedimentation, turbidity, gel electrophoresis, transmission electron microscopy, and fluorescamine assays, as described in Ziady and colleagues and Liu and colleagues.11,17 Also, endotoxin levels were checked using an ENDOSAFE Portable Test System manufactured by Charles River Laboratories (Spencerville, OH). The estimated number of transfecting nanoparticles was as follows: pUL3 = 9.5 × 10¹¹ particles/μL; pUL = 7.2 × 10¹¹ particles/μL.
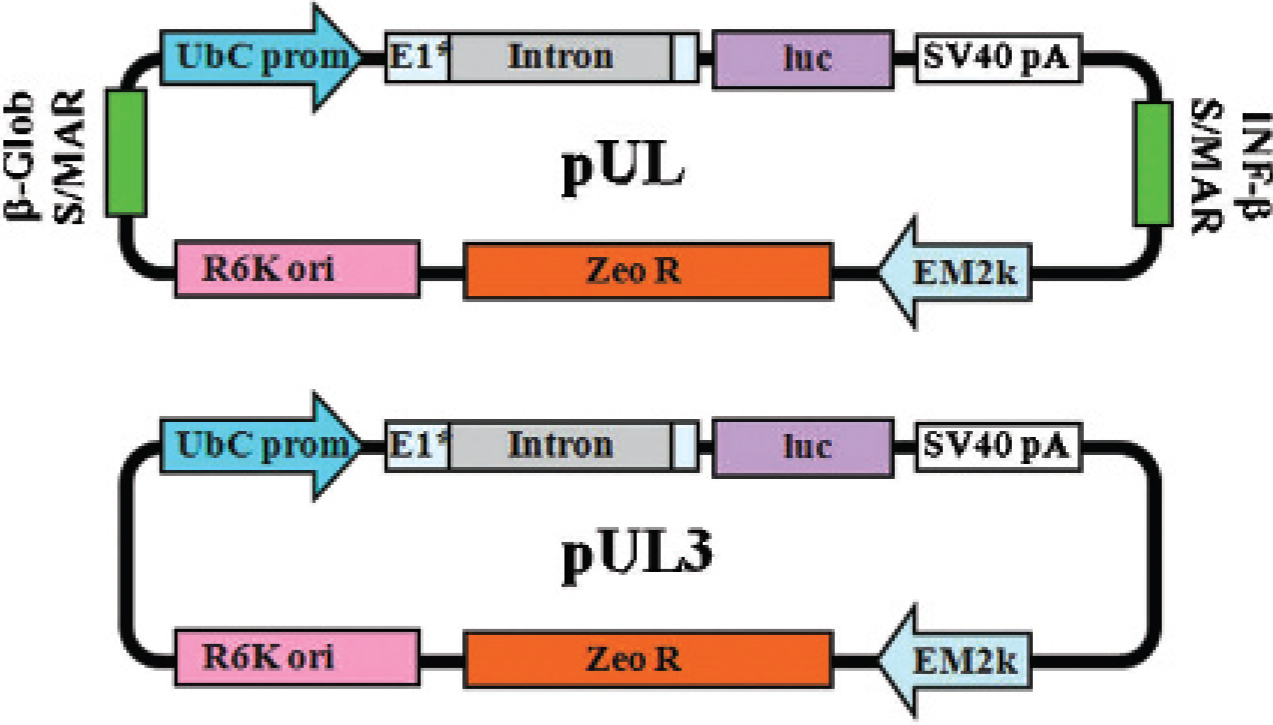
Plasmid maps for pUL and pUL3.
Animals
Male Sprague-Dawley rats at ages 4 to 5 months were obtained from Harlan Laboratories (Indianapolis, IN) and used exclusively in this study. Rats were maintained on alfalfa-free rat chow while housed at the Case Western Reserve University animal facility. All rat procedures were conducted in strict compliance with approved institutional protocols and in accordance with the provisions for animal care and use described in the Guide for the Care and Use of Laboratory Animals. 18 Male BALB/c mice at ages of 6 to 8 weeks (> 20 g in weight) were purchased from Harlan Laboratories. Mice were single-caged in a humidity- and temperature-controlled room with a 12-hour light/dark cycle. All procedures were performed during the light cycle and were approved by the Institutional Animal Care and Use Committee at Medtronic, Inc.
Stereotactic Microinjection of DNPs or DNA Alone into Brain
DNPs or DNA plasmids alone were suspended in sterile saline and loaded into a sterile 30-gauge Hamilton syringe needle. Injections were made stereotactically into the brain of isoflurane-anesthetized rats at a rate of 0.5 μL/min for 4 minutes per site. DNPs or DNA alone were delivered to the brain using three needle tracts for injections made into the striatum and cortex or two needle tracts into a supranigral region. For each tract, the injector was lowered to the deepest dorsoventral coordinate (DV1), a 2.0 μL deposit of DNPs or DNA alone was made at this site, the injector was then retracted to the second site (DV2), and a second 2.0 μL deposit was made at this site. All stereotactic adjustments were made with the skull in the flat position: anteroposterior (AP) and mediolateral (ML) adjustments were made from the intersection of the sagittal and coronal sutures (bregma), and dorsoventral (DV) adjustments were made from the top of the skull. See Table 1 for stereotactic coordinates.
Similar to the injections into the rat brain, stereotactic injections were made into the mouse striatum. DNPs were suspended in sterile saline and loaded into a 33-gauge needle connected to a pump-driven Hamilton microsyringe. Mice were given the analgesic buprenorphine (Buprenex) (0.05 mg/kg, subcutaneously) followed a minimum of 30 minutes later by anesthetic (ketamine, 110.0 mg/kg; xylazine 16.5 mg/kg, intraperitoneally). Stereotactic injections into the mouse striatum were performed at a rate of 0.5 μL/min for 12 minutes; 6.0 μL of DNPs or DNA alone was deposited within the left striatum. The stereotactic coordinates used for these injections were relative to bregma and the top of the skull (AP +0.5 mm; ML −1.75 mm; DV −3.6 mm).
In Vivo and Ex Vivo BLI
Rats were dosed at the University of Kentucky and then transported to the Case Center for Imaging Research (Case Western Reserve University). Rats were imaged in an IVIS 200 system (Xenogen, Alameda, CA). Anesthesia was induced in an induction chamber with 2.5% isoflurane in 100% oxygen at a flow rate of 1 L/min and maintained in the IVIS with a 2.0% mixture at 0.5 L/min. The rats were injected with
Stereotactic Coordinates

AP = anteroposterior; DV = dorsoventral; ML = mediolateral.
*Same for tract 1, 2, or 3.
Mice were imaged in a Xenogen IVIS Lumina system (Caliper Life Sciences, Hopkinton, MA). The mice were injected with
The average time to complete the combined in vivo and ex vivo imaging was 26 ± 1.5 minutes post—luciferin injection; the longest rat took 29 minutes to complete both imaging sessions.
Tissue Dissection for Ex Vivo BLI
Immediately following the in vivo BLI session, rats were overdosed with Fatal-Plus (a mixture of sodium pentobarbital, propylene glycol, ethyl alcohol, and benzyl alcohol) and decapitated; the brains were quickly removed and then placed into an ice-chilled, stainless steel brain matrix (RMB-4000C, ASI Instruments, Warren, MI) with the ventral surface of the brain facing upward. Tissue was dissected as follows with the approximate AP stereotactic coordinates listed in parentheses. For striatal and cortical tissue dissections containing the injection sites, an initial coronal cut was targeted at the level of the optic chiasm (≈AP −0.5), and a second cut was made 3.0 mm anterior to the initial cut (≈AP +2.5). The 3.0 mm thick coronal slab formed by these two cuts was removed from the brain matrix and then placed in a Petri dish with the anterior coronal plane face down. Sterile 0.9% saline was dripped on the tissue section before placing the tissue sections into the IVIS Imager. For ventral midbrain (SN) dissections containing the injection sites, we made an initial coronal cut ≈3.5 mm posterior to the optic chiasm (≈AP −4.0), and a second coronal cut was made 2.0 mm posterior (≈AP −6.0) to the initial cut. The 2.0 mm coronal tissue slab that was formed between these two cuts was removed from the brain matrix and placed in a Petri dish with the anterior coronal plane face down; tissue was prepared for imaging as described above.
Statistical Analyses
The α level of significance was set at p < .05. Analysis of variance (ANOVA) or t-tests were used for statistical analyses; the choice of test was dependent on the experimental design. Means are reported with their corresponding standard error of the mean (SEM). For the rat studies, the time course study for in vivo BLI used repeated measures ANOVA, whereas analyses at specific time points and all ex vivo analyses used two-way ANOVA: treatment (DNP, DNA alone, or saline) was one factor and brain hemisphere (left or right) or brain structure (striatum or cortex) was the second factor.
Results
Plasmid maps for the DNPs used in this study are shown in Figure 1. These plasmids use the highly active polyubiquitin C promoter, a CpG-depleted luciferase transgene, a CpG-depleted prokaryotic backbone, and, in the case of pUL, scaffold-matrix attachment domains flanking the eukaryotic cassette.

Time course of in vivo bioluminescence imaging (BLI) data for animals receiving intrastriatal injections of pUL3 DNA alone, pUL DNA alone, pUL DNA nanoparticles (DNPs), pUL3 DNPs, or saline. BLI sessions were performed 1, 2, 3, and 8 weeks after intrastriatal injections. At day 0, rats were injected with an equivalent volume (12.0 μL) of either pUL3 DNA (4.2 μg/μL; n = 5), pUL DNA (4.3 μg/μL; n = 5), pUL3 DNPs (3.9 μg/μL; n = 4), pUL DNPs (4.1 μg/μL; n = 4), or saline (n = 4) into the left striatum as described in the Materials and Methods section. Symbols represent mean BLI values (± SEM) calculated for each region of interest (ROI) for each treatment group integrated over a 10-minute exposure period. *p < .05 vs saline, pUL3 DNA alone, or pUL DNA alone.
Time Course of Transgene Activity in the Rat Striatum
Figure 2 summarizes the time course of in vivo BLI over an 8-week period following an intracerebral injection of saline, pUL3 DNA alone, pUL DNA alone, pUL DNPs, or pUL3 DNPs into the left striatum. The average BLI signal for rats receiving DNPs into the striatum was 25- to 35-fold higher than the BLI signal for animals receiving an equal volume of saline, which was essentially background signaling. A two-way repeated measures ANOVA revealed a significant effect of treatment [F(4,79) = 7.69, p < .001] but no significant treatment X days interaction [F(12,79) = 1.34, p = .23]. In this experiment, we observed that two slightly different luciferase expression plasmids (pUL and pUL3) compacted into nanoparticles and directly injected into the striatum generated similar expression profiles in terms of BLI signaling over an 8-week period. Likewise, the plasmids alone generated similar expression profiles that were not statistically different from saline at any time points and were statistically lower than either of the DNPs at all time points.

Graph summarizing in vivo bioluminescence imaging (BLI) for animals receiving intrastriatal or intranigral injections of pUL3 DNA alone, pUL3 DNA nanoparticles (DNPs), or saline 8 weeks postinjection. At day 0, rats were injected with an equivalent volume (12.0 μL) of either pUL3 DNPs (3.9 μg/μL; n = 7), pUL3 DNA (4.2 μg/μL; n = 7), or an equivalent volume of saline into the left striatum (n = 5) or left substantia nigra (n = 5). The inset shows typical in vivo BLIs for pUL3 DNP injections into the striatum or substantia nigra: a pseudocolor image is superimposed on a grayscale image of the rat body and represents photons emitted by live cells following the luciferin/luciferase light reaction that occurs within transfected brain cells and detected by the IVIS 200 imaging system; the color scale bar on the right shows the photon counts as photons/s/cm2/steradians (p/s/cm2/sr). Symbols represent mean BLI values (± SEM) calculated for each region of interest (ROI) for each treatment group; data were integrated over a 10-minute exposure period. *p < .05 vs saline or pUL3 DNA alone (striatal injections);^p < .05 vs saline or pUL3 DNA alone (nigral injections).
Transgene Activity in the Rat Striatum and SN at 8 Weeks: In Vivo and Ex Vivo BLI
Figure 3 summarizes in vivo BLI analyses in the striatum and substantia nigra at the eighth postinjection week. For striatal injections, ANOVA revealed a significant treatment effect [F(2,16) = 7.32, p = .006] and post hoc mean comparisons showed that the signals were significantly higher for animals receiving DNPs when compared to the signal values for rats injected with DNA alone or saline. At 8 weeks postinjection, in vivo BLI for animals receiving pUL3 DNPs into the SN (1.39 × 10⁵ ± 3.53 × 10⁴) was statistically greater than that for rats receiving pUL3 DNA alone in the SN (1.81 × 10⁴ ± 1.51 × 10³); t(6) = 2.57, p < .05. At this same time point, some of the rats that were tested for in vivo BLI were then immediately euthanized, and the brains were quickly removed and sectioned, as shown in Figure 4. Brain sections were imaged ex vivo for 2 minutes. Figure 5 shows typical examples of imaged brain tissue 8 weeks after intrastriatal or intranigral injections of pUL3 DNA alone or pUL3 DNPs. These data were analyzed using a two-way ANOVA: treatment (DNPs, plasmid, saline) was one factor and brain hemisphere (left, right) was the second factor. For striatal measurements, ANOVA revealed a significant treatment effect [F(2,18) = 3.97, p = .037] and a significant treatment X brain hemisphere interaction [F(2,20) = 3.83, p = .041]. Statistical analysis of ex vivo BLI signals indicated that pUL3 DNP treatment produced significantly higher signals (280-fold) in brain tissue than pUL3 DNA alone or saline treatment in the striatum. For measurements in the SN, ANOVA revealed a significant treatment effect [F(2,12) = 75.21, p < .001] and a significant treatment X brain hemisphere interaction [F(2,12) = 76.10, p < .001], where there was about an 84-fold higher signal in the pUL3 DNP–treated SN when compared to pUL3 alone or saline treatment (Figure 6 and Table 2). Of note, ex vivo BLI magnitude ratios between DNP and DNA alone more closely match luciferase tissue lysate activity ratios 10 and appear to give a better representation of actual luciferase activity than in vivo BLI measurements.
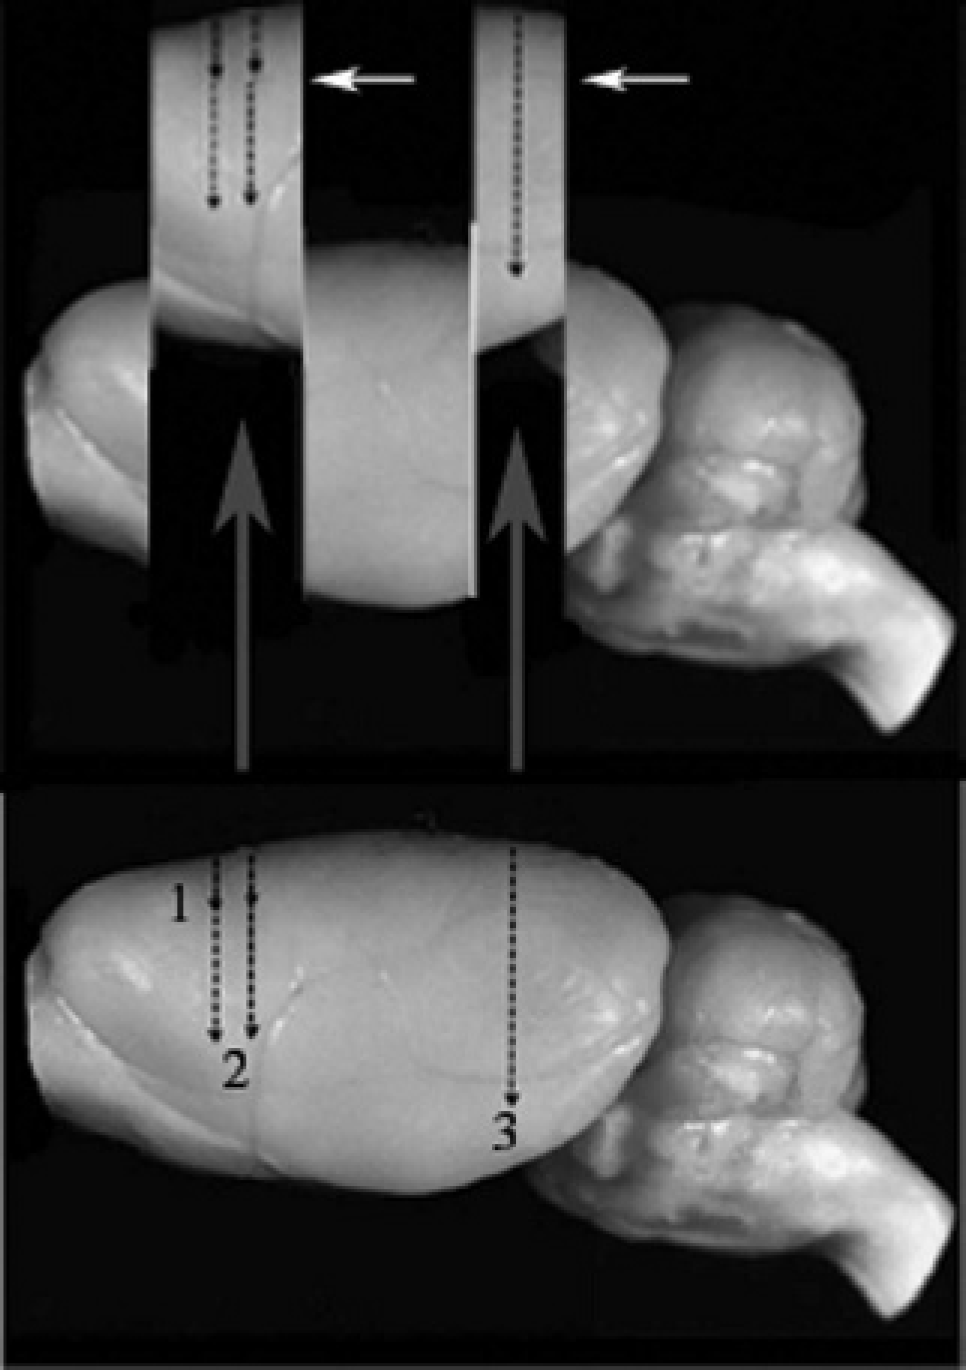
Diagram showing how brain slices were obtained for ex vivo bioluminescence imaging (BLI) analysis. The bottom image shows the lateral view of an intact rat brain, and black arrows indicate the three target sites for injections; numbers indicate (1) cortical injection sites, (2) striatal injection sites, and (3) nigral injection sites. Brains were rapidly removed after the initial in vivo BLI session and sectioned as shown in the upper diagram. Sections were placed in a Petri dish with the anterior surface facing down and the posterior surface (white arrow) facing the camera. Signals were integrated over a 2-minute exposure period.
In some rats receiving injections of pUL3 DNPs into the SN, we observed detectable BLI signals emanating from the eyes. Figure 7 shows several examples of in vivo BLI signals in the contralateral eye at 2 weeks (see Figure 7B) or 8 weeks postinjection (see Figure 7C) and in both eyes at 2 weeks postinjection (see Figure 7D); this phenomenon was observed only in rats receiving DNP injections into the ventral midbrain region.
Transgene Activity in the Rat Striatum and Cortex at 11 Weeks: In Vivo and Ex Vivo BLI
Figure 8 shows in vivo BLI analyses at 11 weeks postinjection. These data were analyzed using a two-way ANOVA: treatment (DNPs, plasmid, saline) was one factor and brain structure (striatum, cortex) was the second factor. ANOVA revealed a significant treatment effect [F(2,17) = 8.17, p = .003] and a significant treatment X brain structure interaction [F(2,17) = 3.57, p = .05]. Despite equivalent amounts of DNPs injected into the cortex and striatum, we detected significantly higher in vivo BLI values (compared to DNA alone) for rats receiving intracortical injections (34-fold) than for rats receiving intrastriatal injections (7-fold). Moreover, the DNP cortical signal was 6-fold higher than the striatal signal. Although some rats in the pUL3 DNA alone group showed detectable in vivo BLI signals at 11 weeks, as a group, their signals were not significantly different from those of saline-treated rats. Figure 9 shows the best individual in vivo BLIs for each treatment group (pUL3 DNA alone or pUL DNP) in the cortex at 11 weeks postinjection.
Ex vivo BLI was also performed on dissected brain sections at the eleventh postinjection week. These data were analyzed using a two-way ANOVA: treatment (DNPs, plasmid, saline) was one factor and brain hemisphere (left, right) was the second factor. ANOVA revealed a significant treatment effect [F(2,20) = 3.66, p = .044] and a significant treatment X brain hemisphere interaction [F(2,20) = 3.58, p = .048]. As shown in Figure 10, BLI signals emanating from the striatum of rats treated with pUL DNPs were 76-fold greater than BLI signals emanating from the striatum of rats treated with pUL3 DNA alone. Similar to the in vivo BLI results at this same time point, some rats in the pUL3 DNA alone treatment group showed detectable ex vivo BLI signals, but as a group, their signals were not significantly different from those of saline-treated rats. Whereas in vivo BLI flux was significantly greater for cortical injections of pUL DNPs than striatal injections of pUL DNPs, ex vivo BLI flux for striatal injections of pUL DNPs (1.01 × 10⁵ ± 1.00 × 10⁴) was not significantly different from cortical injections of pUL DNPs (1.81 × 10⁵ ± 5.44 × 10⁴); t(7) = 0.70, p = .51.
Transgene Activity in the Mouse Striatum during a 1-Year Period
Mice received unilateral injections of pUL DNPs, and in vivo BLI was performed on a weekly basis for the first 28 weeks and on a monthly basis for the remaining 24 weeks; imaging of the mouse receiving intrastriatal injections of plasmid alone was performed only 8 days postinjection. Figure 11 summarizes in vivo BLI data during this 1-year period. During the first postinjection week, we observed significantly higher BLI signals in mice receiving injections of pUL DNPs when compared to mice receiving DNA plasmid alone, and this is consistent with our rat studies. A fairly stable level of luciferase activity was observed in mice receiving pUL DNPs throughout the 1-year period. Luciferase enzyme activity assays were performed on striatal tissue at the end of the 1-year period, and we observed significantly higher luciferase enzyme activity (39,140.1 ± 13,830.7 RLU/mg tissue) in tissue obtained from the injected side when compared to luciferase enzyme activity (955.7 ± 619.7 RLU/mg tissue) in the noninjected side [t(4) = 2.76, p = .026].

Ex vivo bioluminescence imaging of typical brain sections containing injection sites for intrastriatal or intranigral injections of pUL3 DNA alone or pUL3 DNA nanoparticles (DNPs) at 8 weeks postinjection. A pseudocolor image is superimposed on a grayscale image of the coronal brain section and represents photons emitted by cells following the luciferin/luciferase light reaction that occurs within transfected brain cells and detected by the IVIS 200 imaging system; the color scale bar on the right shows the photon counts (photons/s/cm2/sr). A circular region of interest (ROI) (red circle) was centered over the left striatum (ROI 2) or right substantia nigra (ROI 1) of the coronal brain section, and photon emissions were quantified within the ROI. Data for saline treatment are not shown.

Graph summarizing 8-week ex vivo bioluminescence imaging (BLI) values calculated for the injected side of the brain or on the side receiving no injection for rats dosed with pUL3 DNA alone, pUL3 DNA nanoparticles (DNPs), or saline. At day 0, rats were injected with an equivalent volume of either pUL3 DNPs (3.9 μg/μL), pUL3 DNA (4.2 μg/μL), or saline into the left striatum (12.0 μL; n = 5) or right substantia nigra (8.0 μL; n = 4). Symbols represent mean BLI values (± SEM) calculated for each region of interest (ROI) for each treatment group; data were integrated over a 2-minute exposure period. *p < .01 vs pUL3 DNPs no injection (striatum), pUL3 DNA alone for the injection and no injection (striatum), and saline injection and no injection (striatum); #p < .001 vs pUL3 DNPs no injection (substantia nigra), pUL3 DNA alone for injection and no injection (substantia nigra), and saline injection and no injection (substantia nigra).
Discussion
This study demonstrates that DNPs injected into brain confer stable and long-term transgene expression in brain as detected by in vivo and ex vivo BLI, and based on our previously published data for tissue luciferase activity, 10 ex vivo BLI measurements may provide more accurate estimates of true tissue luciferase activities. This type of nonviral vector is one of the first to achieve sustained levels of transgene expression in brain sufficient for detection by in vivo BLI for a protracted period following a single administration. 10 Previous studies with lipid-based non-viral vectors failed to detect persistent luciferase activity in the brain. For example, using formulated DNA/lipid lipoplexes containing a luciferase expression cassette, Hauck and colleagues demonstrated that gene delivery into the cistern magna or lateral ventricle resulted in detectable transgene activity by in vivo BLI. 19 However, transgene activity became undetectable by BLI within 2 weeks of injection; direct intracerebral injection of these lipoplexes resulted in very low in vivo BLI signals that lasted only a few days. In our study, transgene luciferase activity continued at a stable level for > 365 days following a single intracerebral injection. In the present study, we showed that pUL DNPs, which contain a plasmid identical to pUL3 with the only exception that it also contains scaffold-matrix attachment regions, behave similarly to pUL3 DNPs when injected into brain in terms of transgene activity measured by BLI, at least for an 8- to 11-week period. Moreover, ex vivo BLI of brain slices obtained from transfected rats revealed that gene delivery to the cortex, striatum, or SN achieved high-level, site-specific transgene activity in brain structures targeted by our injections of DNPs containing pUL or pUL3.
Although in vivo BLI is a useful tool for the analysis of gene expression in the same experimental subject at multiple time points, resolution is limited owing to the transmission and scattering of light as it passes through tissues. To address this principle, we used two approaches: first, we counted the entire light signal observed in each sample to decrease signal loss, and, second, we conducted ex vivo analyses to enhance our resolution. Although we observed significantly greater in vivo BLI flux emanating from the cortex when compared to photon emissions from the striatum in rats treated with DNPs, we did not observe a significant difference between ex vivo BLI flux emanating from these two sites. The same dose of pUL or pUL3 DNPs was injected into each of these sites, so the discrepancy between the in vivo and ex vivo measurements may be due to the attenuation of the BLI signal as it passes through tissue. Our ex vivo analysis indicated that the hot spots for photon emissions were at the site of injection, so this means that photon emissions from transfected striatal sites traveled through ≈4.0 mm more brain tissue than emissions from transfected cortical sites for our in vivo measurements. On the other hand, for our ex vivo BLI measurements, photon emissions from the cortex and striatum traveled through nearly equivalently tissue thicknesses because of the manner in which the brain tissue was dissected, and this may explain why equivalent injection doses into these two brain sites yielded statistically similar ex vivo BLI signals. Moreover, we observed significantly higher ratios of luciferase activity generated by DNP compared to DNA alone when ex vivo imaging is compared to in vivo imaging (summarized in Table 2). Whereas in vivo BLI facilitates evaluation of longevity of transgene expression in the same cohort of animals, ex vivo imaging is better suited for more precise comparisons of vector systems. Importantly, our analysis of matched sets of in vivo and ex vivo BLIs permits semiquantitative comparisons of these alternative imaging measurements. Further, as candidate therapeutic gene expression is evaluated for brain clinical indications, an expression plasmid encoding a luciferase fusion gene may guide early steps in plasmid optimization. An evaluation of both in vivo and ex vivo BLI should be quite helpful in optimizing the duration and levels of fusion gene expression, respectively.
Summary of BLI Measurements

BLI = bioluminescence imaging; DNA = deoxyribonucleic acid; DNPs = DNA nanoparticles; ND = not determined.
The SN is a smaller brain structure than the other two target sites examined in this study, and for this reason, we chose a smaller injection volume (8.0 μL) that was distributed within two injector tracts instead of the three tracts (12.0 μL) used for striatal and cortical injections. Even though the SN was the deepest brain structure tested in these experiments, a detectable in vivo BLI signal was observed, and analysis revealed that photon emissions from animals receiving pUL3 DNP treatment were statistically greater than photon emissions from animals receiving pUL3 DNA alone. However, the average in vivo BLI flux emanating from the SN was approximately one-fourth the signal observed from the striatum. Similarly, we observed an 85% reduction in the ex vivo SN BLI signal intensity when compared to the ex vivo BLI signal emanating from the striatum (see Figure 6 and Table 2). Although tissue attenuation may have contributed to this decreased signal, we must also consider that two-thirds of the amount of DNPs was injected into the SN site compared to the amount injected into the striatum or cortex. Therefore, a direct comparison of BLI data between the SN and striatum or cortex should not be made until DNA dose-response relationships at both injection sites are better defined.

Bioluminescence imaging (BLI) detection of luciferase activity in the eyes of rats receiving injections of pUL3 DNA nanoparticles (DNPs) into the ventral midbrain. A, Diagram of the left hemisphere of rat brain showing the targeted injection sites. Large arrows show the two injector tracts for pUL3 DNPs; note that the medial injector tract passes through the optic tract (opt) and nucleus of the optic tract (OT), whereas the lateral injector passes through opt. B and C, In vivo BLI of the same rat taken at 2 weeks (B) or 8 weeks (C) postinjection showing detectable signals in the contralateral eye (small black arrows). D, In vivo BLI showing detectable signals in both the ipsilateral and contralateral eyes 2 weeks postinjection in a different rat. Pseudocolor images showing light detection were made 60% transparent to view underlying structures in B, C, and D. snc = substantia nigra, pars compacta; snr = substantia nigra, pars reticulata.
It is interesting to note in Table 2 that BLI signals for DNA alone were approximately 10 times higher for in vivo BLI when compared to ex vivo BLI. This may be attributable to the difference in the area for each measurement: for striatal measurements, the area of the ROI for in vivo BLI was 1.5 cm2, whereas the area of the ROI for ex vivo BLI was 0.145 cm2. Therefore, if in vivo and ex vivo BLI signals for the striatum were normalized for ROI area, signals for DNA alone would be approximately the same for in vivo and ex vivo BLI, whereas signals for DNPs would be approximately 10-fold higher for ex vivo BLI when compared to in vivo BLI.
Although our ex vivo BLI studies confirmed that transgene activity was confined to the targeted brain sites, we did observe significant in vivo BLI signals emanating from the eyes of rats that received injections of pUL3 DNPs into the ventral midbrain but not in rats receiving injections of DNPs into the striatum or cortex. As shown in Figure 7A, when targeting the SN in the ventral midbrain, both needle tracts pass through the optic tract and/or nucleus of the optic tract. It is conceivable that some pUL3 DNPs may have reached these sites owing to a backflow of particles along the needle tract; in a previous study where the injector needle passed through the corpus callosum and injections were targeted several millimeters ventral to the corpus callosum, we observed significant transgene activity within the fiber tracts of the corpus callosum that was most likely due to a backflow of nanoparticles to this fiber tract. 10 A similar phenomenon may have occurred in the present study that resulted in the retrograde transport of some pUL3 DNPs to the ocular retinal ganglion cells. An earlier study by Garcia-Valenzuela and colleagues demonstrated that when plasmid DNA encoding for luciferase or β-galactosidase was condensed into DNPs and then injected into the tectal region of the brain, detectable reporter gene activity was observed in the retina 20 days later. 20 In our studies, luciferase activity was detected in both the ipsilateral and contralateral eyes; this is not surprising given that the optic tract contains projections from both the ipsilateral and contralateral eyes.
No obvious toxicity was observed in this study or in previous reports that examined toxicity in animals10,12,21 and humans 13 treated with CK30PEG10k nanoparticles. Plank and colleagues demonstrated that the activation of complement by polylysine is a function of the chain length of polylysine. 22 In this same study, it was shown that unbound, long-chain (> 50 mer) polylysine activated complement, but that activation was substantially decreased for unbound short-chain (< 50 mer) polylysine; this is one reason why we chose to use a small-chain 30-mer lysine polymer in our nanoparticle formulation. Second, it was shown that the toxicity of polylysine is reduced when it is bound to other moieties, including DNA: polylysine/DNA complexes with neutral or slightly negative charge did not activate complement at all.22,23 This is significant because our DNPs are charge neutral or slightly positive. Moreover, conjugation of PEG and/or transferrin to unbound polylysine or polylysine/DNA complexes had a further protective effect against the activation of complement. 22 A recent study by Yang and colleagues demonstrated that diblock copolypeptide hydrogels with polylysine side chains (180 mer) could be implanted into the striatum with minimal or no toxicity. 24 All rats and mice appeared healthy at all time points, and we lost only one rat soon after the stereotactic injection of DNPs; this loss was most likely due to surgical procedures and not related to the treatment. Therefore, all indications are that our system is minimally toxic in vivo. Coupled with extended transgene expression, their minimal toxicity profile enhances the potential application of DNPs in brain gene therapy.

Graph summarizing in vivo bioluminescence imaging (BLI) for rats receiving intrastriatal or intracortical injections of pUL3 DNA alone, pUL DNA nanoparticles (DNPs), or saline 11 weeks postinjection. At day 0, rats were injected with an equivalent volume (12.0 μL) of either pUL DNPs (4.1 μg/μL) into the striatum (n = 4) or cortex (n = 4), pUL3 DNA (4.2 μg/μL) into the striatum (n = 4) or cortex (n = 4), or an equivalent volume of saline into striatum (n = 3) or cortex (n = 3). Symbols represent mean BLI values (± SEM) calculated for each region of interest (ROI) for each treatment group; data were integrated over a 10-minute exposure period. Because there was no significant difference between the performance of pUL and pUL3 as DNPs or plasmid alone (see Figure 2) and pUL plasmid was unavailable for this experiment, we used pUL3 DNA alone as a control. *p < .05 vs saline (striatum) or pUL3 DNA alone (striatum); #p < .05 vs pUL DNPs (striatum);^p < .05 vs saline (cortex) or pUL3 DNA alone (cortex).
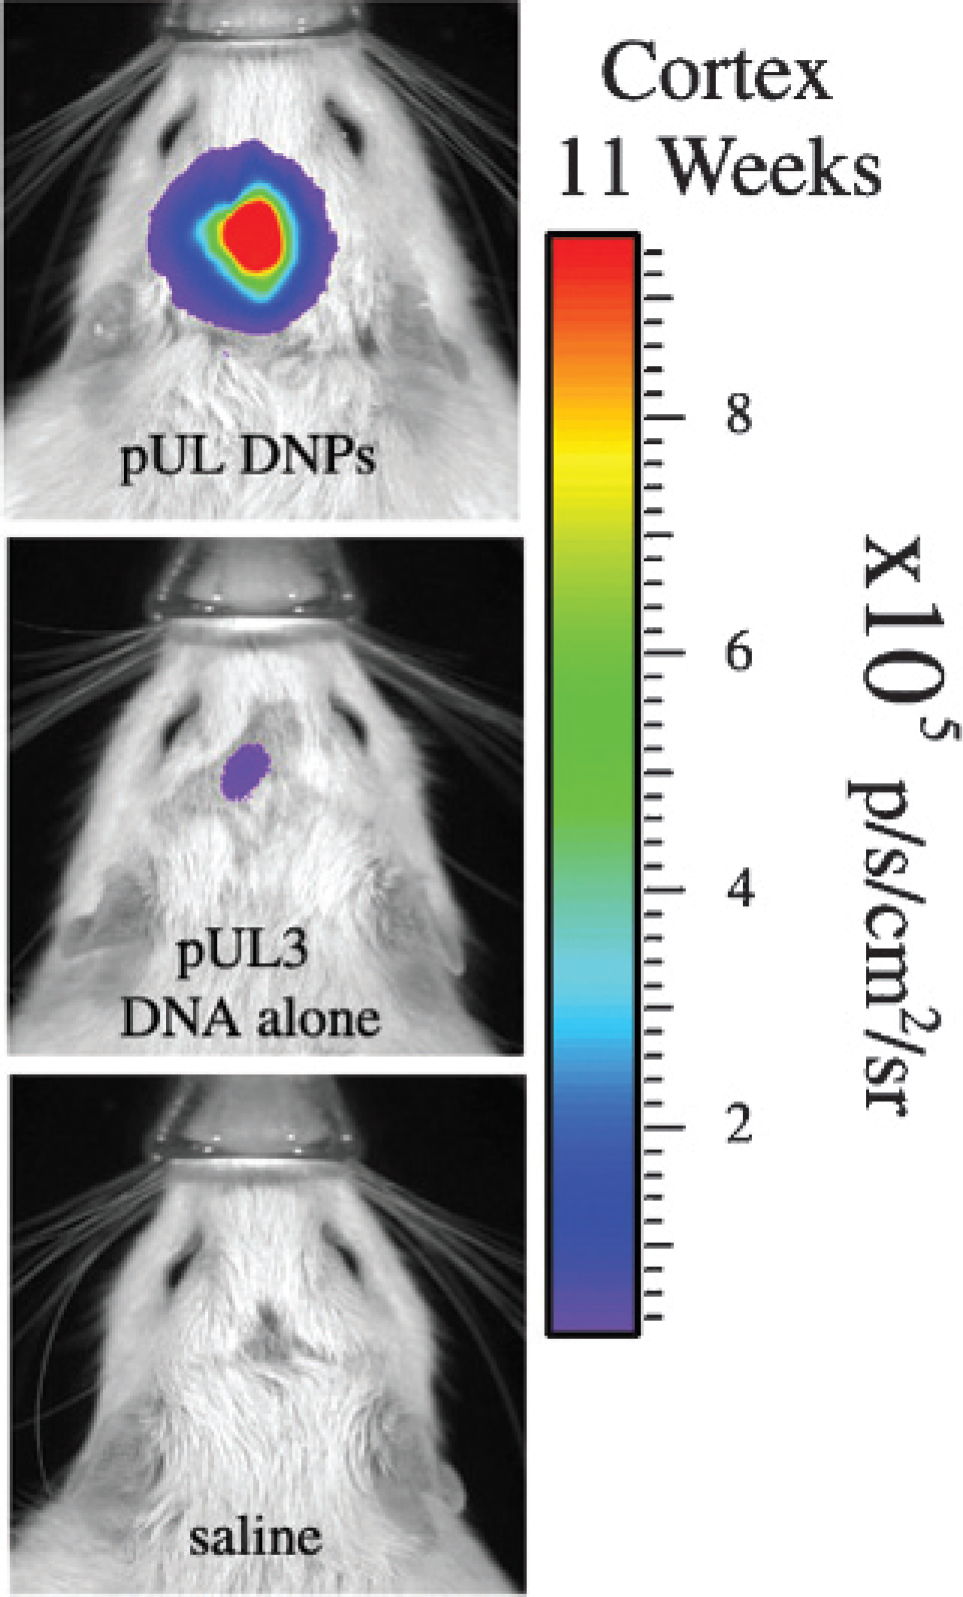
In vivo bioluminescence imaging (BLI) showing the best individual images for rats dosed with pUL3 DNA alone, pUL DNA nanoparticles (DNPs), or saline at 11 weeks postinjection. Each panel is composed of a pseudocolor image superimposed on a grayscale image of the rat body, and pseudocoloring represents photons emitted by live cells following the luciferin/luciferase light reaction that occurs within transfected brain cells and detected by the IVIS 200 imaging system; the color scale bar on the right shows the photon counts (photons/s/cm2/sr).
In conclusion, intracerebral injections of CK30PEG10k nanoparticles containing a luciferase expression plasmid can result in long-term transgene activity in brain as measured by BLI. Imaging shows stable and robust luciferase activity in brain for at least 1 year postinjection (longest time point evaluated), and imaging of ex vivo brain slices confirms that the signals originate from the targeted injection site. This study also compares matched sets of in vivo and ex vivo BLIs, which facilitates use of this modality in optimizing gene therapy vector systems for clinical development.

Graph summarizing 11-week ex vivo bioluminescence imaging (BLI) values calculated for the injected side of the brain or the side receiving no injection for rats dosed with pUL3 DNA alone, pUL DNA nanoparticles (DNPs), or saline in the rat striatum. At day 0, rats received 12.0 μL injections of pUL DNPs (4.1 μg/μL; n = 5), pUL3 DNA (4.2 μg/μL; n = 5), or saline (n = 3) into the left striatum. Inset images show typical ex vivo BLI for each treatment group: a pseudocolor image is superimposed on a grayscale image of the rat brain and represents photons emitted by live cells following the luciferin/luciferase light reaction that occurs within transfected brain cells and detected by the IVIS 200 imaging system; the color scale bar on the right shows the photon counts (photon/s/cm2/sr). Symbols represent mean BLI values (± SEM) calculated for each region of interest (ROI) for each treatment group; data were integrated over a 2-minute exposure period. *p < .01 vs pUL DNPs (no injection), pUL3 DNA alone (injection or no injection), and saline (injection or no injection).

Graph summarizing in vivo bioluminescence imaging (BLI) data during a 1-year period in mice receiving unilateral intrastriatal injections of pUL DNA alone or pUL DNA nanoparticles (DNPs). At day 0, mice received 6.0 μL injections of pUL DNPs (4.4 μg/μL; n = 3); one mouse that received injections of pUL DNA alone (4.0 μg/μL; n = 1) into the left striatum is shown for comparative purposes. The insets on the graph are in vivo BLIs of mice taken at 10, 63, 113, 188, and 364 days after intrastriatal injections of pUL DNPs and at 8 days after an injection of pUL DNA alone.
Footnotes
Acknowledgments
We thank Katie J. Green and Joseph Molter for technical assistance.
Financial disclosure of authors: This research was supported in part by grants from the National Institutes of Health and National Institute of Neurological Disorders and Stroke (NS50311, D.M.Y., NS66250, D.M.Y. and A.G.Z.), the Michael J. Fox Foundation for Parkinson's Research (D.M.Y., M.J.C.), the Jelm Foundation (D.M.Y.), and the State of Ohio Biomedical Research and Technology Transfer fund (A.G.Z., M.J.C.). Dr. Ziady is an inventor on patents relating to DNPs that have been licensed by Case Western Reserve University to Copernicus Therapeutics, Inc. A portion of this work was funded by Medtronic, Inc., and Copernicus Therapeutics, Inc.
M.RW. and M.D.K. are employees of Medtronic, Inc., and T.H.K., L.P., and M.J.C. are employees of Copernicus Therapeutics, Inc., and each own limited company stock in their respective companies.
Financial disclosure of reviewers: None reported.