
Abstract
We assessed lymph drainage in living mice by an integrated imaging method using fluorescence imaging (FLI) and magnetic resonance imaging (MRI). Mice were subcutaneously injected with quantum dots and gadofluorine 8 into the right rear footpad. They were fixed on a transparent flat plate and underwent FLI and MRI successively. Small markers were attached to the mouse surface for spatial coregistration, and image fusion of FLIs and MRIs was performed. Two-dimensional fluorescence reflectance imaging was used for FLI. FLI and MRI provided generally consistent results and demonstrated lymphatic flow to the popliteal, sacral, and iliac lymph nodes in most mice and to the renal, inguinal, and lumbar-aortic lymph nodes in some mice. On the fusion images, the locations of the lymph nodes in the mouse trunk were in good agreement between FLI and MRI, indicating successful spatial registration even for the deep structures. The popliteal node tended to be visualized a little farther caudally in FLI than in MRI, presumably because the overlying tissues were thicker in the cranial portion. Integrated FLI/MRI lymphography with image fusion appears to be a useful tool for analysis of the murine lymphatic system.
THE LYMPHATIC SYSTEM plays a crucial role as a pathway of metastatic spread of malignant tumors and is also an essential component of the immune system. Although mice are the laboratory animals used most commonly in animal experiments, the lymphatic drainage pattern in mice still remains to be investigated. Because the murine lymph nodes are very small, it is difficult to identify them by the naked eye, which may be an obstacle to the evaluation of lymphatic drainage in mice.
There are many imaging methods for in vivo evaluation of the lymphatic system, including x-ray lymphangiography, ultrasonography, computed tomography, magnetic resonance imaging (MRI), lymphoscintigraphy, positron emission tomography, optical imaging, and photoacoustic imaging,1–3 and analysis of small animals can be supplemented by noninvasive in vivo imaging technologies. In vivo fluorescence imaging (FLI) allows assessment of the lymphatic pathway in both animals and humans. Quantum dots are stable, bright fluorophores with tunable fluorescence emission and broad excitation spectra.4,5 They are retained in the lymph node for a long time and can be used for sentinel lymph node mapping.6–9 Unlike observation by the naked eye, complete exposure of the target structure is not needed for fluorescence-guided detection during surgery. Although light suffers from severe scattering and absorption in the tissues, light in the 600 to 900 nm wavelength range can travel relatively long distances in vivo. 10 FLI using quantum dots emitting far-red or near-infrared (NIR) light allows detection of lymph nodes that receive lymph flow from the injection site, even in intact mice.11,12 The drawbacks of FLI lymphography in intact mice include low spatial resolution, lack of anatomic references, and difficulty in the assessment of deep lymph nodes. Possible toxicities of quantum dots disturb their application to human clinical practice, and currently only a few fluorescent dyes, such as indocyanine green, are used in humans.
MRI offers high-resolution tomographic images and allows the assessment of detailed, three-dimensional (3D) anatomy even in mice. Gadofluorine 8 is a macrocyclic gadolinium chelate with micelle-forming ability and is retained in the lymph nodes efficiently.13–15 Following local injection of lymphographic agents such as gadofluorine 8, MRI permits evaluation of the lymphatic pathway and provides morphologic information on the lymphatic system, including the size and shape of the lymph nodes and their location relative to other organs. The drawbacks of MRI include poor availability for small-animal experiments and difficulties in data acquisition and image interpretation. Moreover, MRI-guided lymph node sampling is difficult to perform.
Multimodality imaging is a combination of two or more imaging modalities with different properties and is expected to enhance the capabilities of each. FLI and MRI may play complementary roles in lymphography, and agents that enable the visualization of lymph nodes by both FLI and MRI have been developed.16–19 Image fusion following successive data acquisition facilitates detailed comparison between images obtained by the different modalities. A convenient method of image fusion of two-dimensional (2D) bioluminescence imaging and 3D MRI has been reported. 20 In the present study, we extended this method to the fusion of 2D FLI and 3D MRI. FLI with quantum dots and MRI with gadofluorine 8 were performed successively in intact mice, and lymph drainage from the right rear footpad was assessed, including the deep abdominal regions, using FLI, MRI, and fusion imaging. For FLI, we used a conventional fluorescence reflectance imaging technique in which the application of excitation light and detection of emission light were performed on the same side of the animal. 21 This technique can provide an overview of the distribution and amounts of fluorescent agents in a short time. The purpose of this study was to determine the feasibility and potential utility of integrated FLI/MRI lymphography with image fusion. We also sought to assess the validity of the fusion of 2D optical imaging and 3D MRI in evaluating deep structures.
Materials and Methods
Animals
The female BALB/c mice (10–12 weeks old) used for the experiments were obtained from SLC Japan (Hamamatsu, Japan) and kept in a specific pathogen–free (SPF) facility. They were usually given a pelleted regular rodent diet (CA-1, CLEA Japan, Tokyo, Japan) and water ad libitum, except for dietary preparation before imaging studies. Because fur degrades image quality in FLI, it was removed with a depilatory mousse (Epilat, Kracie, Tokyo, Japan) prior to imaging. The mice were handled in accordance with the guidelines of the Institute of Medical Science, University of Tokyo. The experiments were approved by the institution's Committee for Animal Research.
Fluorescence Imaging
FLI was performed in the green, far-red, and NIR regions using a cooled charge-coupled device (CCD) camera system (IVIS Imaging System 100, Xenogen/Caliper LS, Alameda, CA) equipped with a fluorescence kit (XFO-6, Xenogen/Caliper LS). An excitation filter of 445 to 490 nm passband and an emission filter of 515 to 575 nm passband (Xenogen/Caliper LS) were used for green imaging, an excitation filter of 615 to 665 nm passband and an emission filter of 695 to 770 nm passband (Xenogen/Caliper LS) were used for far-red imaging, and an excitation filter of 672.5 to 747.5 nm passband and an emission filter of 775 to 825 nm passband (Chroma Technology, Rockingham, VT) were used for NIR imaging. Other imaging parameters are described in each section. For image acquisition, the mice were anesthetized by isoflurane inhalation and placed in the light-tight chamber of the CCD camera system. The signal intensity was quantitated using Living Image software version 2.50 (Xenogen/Caliper LS).
Magnetic Resonance Imaging
MRI was performed on a compact MRI system (MRmini, MRTechnology, Tsukuba, Japan) using a 1 T permanent magnet and a solenoid coil with a 30 mm inner diameter.22,23 The MRI and CCD camera systems were placed side by side in a 3 × 8 m2 room in the SPF facility without magnetic shielding. Images were acquired in the coronal plane using a T1-weighted, 3D fast low-angle shot sequence. Scan parameters were as follows: repetition time, 40 ms; echo time, 2.2 ms; flip angle, 51°; in-plane matrix size, 256 × 128; slab partition, 64; number of excitations, 1; acquisition time, 5 minutes 28 seconds. Using zero interpolation, we reconstructed 128 slices and obtained 0.26 mm isotropic voxels with no interslice gap. To confirm appropriate positioning, scout images in the coronal plane were acquired in advance using the following parameters: repetition time, 30 ms; echo time, 2.1 ms; flip angle, 36°; in-plane matrix, 256 × 64; slab partitions, 16; number of excitations, 1; acquisition time, 31 seconds. Under isoflurane anesthesia, mice were fixed in the prone position on a flat, colorless, transparent plate 28 mm wide and 2 mm thick, and the whole body of the mouse and the plate were tightly wrapped together using colorless, transparent tape to reduce respiratory motion.
Dietary Preparation
In mice, gastrointestinal contents show strong signal intensities in far-red or NIR FLI 24 and in T1-weighted MRI, 25 which disturbs assessment of the abdomen. Dietary preparation with potato has been shown to reduce gastrointestinal hyperintensity in MRI. 25 We investigated whether dietary preparation with potato could depress signals in the gastrointestinal system in both MRI and FLI. Six mice fed with the regular rodent diet underwent baseline FLI and MRI. After the completion of baseline imaging, the mice were moved to new cages and given potato. Wire racks were placed at the bottom of the cages to prevent the intake of feces. Potatoes were peeled, cut into small pieces, and autoclaved to bring them into the SPF facility. FLI and MRI were performed again 24 hours after the dietary change.
For FLI, ventral images were acquired in the far-red and NIR regions. The field of view (FOV) was 25 cm, and binning was 4. The exposure time was 1 second for far-red imaging and 10 seconds for NIR imaging. A region of interest was set in the abdomen, and the mean signal intensities (p/s/cm2/sr) were calculated. From MRI source images, ventral maximum intensity projection images were generated using ImageJ software (National Institutes of Health, Bethesda, MD). The degree of gastrointestinal hyperintensity was assessed using the generated images, based on the extent of areas in the abdomen showing apparently higher signal intensity than fat, and were graded as severe, moderate, mild, or negligible. 25 Two radiologists experienced in small-animal imaging performed independent visual evaluations.
FLI/MRI Lymphography
Integrated FLI/MRI was performed in nine mice to assess lymphatic drainage from the right rear footpad. After feeding with autoclaved potato for 1 day, mice were injected subcutaneously with Qdot 800 ITK Carboxyl Quantum Dots (QD800, Invitrogen, Grand Island, NY) in the dorsal side of the right rear footpad using a microsyringe, and a gentle massage was applied to the injection site for about 15 seconds. The emission peak of QD800 was 800 nm, in the NIR region. The QD800 solution was diluted with phosphate-buffered saline, and 20 pmol QD800 per mouse was injected in a volume of 10 μL.

Fixation of the mouse for integrated FLI/MRI lymphography. The mouse was fixed to an imaging holder that consisted primarily of a flat, transparent plate, and a smaller plate was attached tightly to the dorsal side of the abdomen for compression (A). Isoflurane was provided through the nose cone. Two small supports for ventral imaging are also seen in A. For ventral imaging, the holder and mouse were turned over and the projections at the ends of the holder were put on the supports (B). The right rear foot, the injection site, was covered with black tape in the actual experiments.
About 3 hours later, gadofluorine 8 (0.5 μmol gadolinium per mouse in 10 μL), provided by Bayer Schering Pharma AG (Berlin, Germany), was injected similarly in the right rear footpad under isoflurane anesthesia, and preparation for image acquisition was started. Three small registration markers each were attached to both the ventral and dorsal sides of the mouse abdomen. The marker contained 0.8 μM Qdot 525 ITK carboxyl Quantum Dots (Invitrogen), with peak emission of 525 nm, and 10 mM gadolinium diethylenetriaminepentaacetic acid (Gd-DTPA) (Bayer Yakuhin, Osaka, Japan). The marker was visible on FLI in the green region and on MRI. Mice with the markers were fixed on the flat, colorless, transparent plate of the imaging holder for integrated imaging (Figure 1). 20 The right rear foot was covered with black, opaque tape to remove strong fluorescent signals from the injection site. Additionally, a 50 × 24 × 1 mm flat, colorless, transparent plate was placed on the dorsal side of the abdomen and attached tightly with tape to compress the abdomen. This procedure decreased the body thickness of the mouse at the midsagittal portion and thus improved visualization of the deep lymph nodes around the abdominal aorta by FLI. 12
The imaging holder carrying the mouse was inserted into the solenoid coil for MRI, horizontally and parallel to the long axis of the coil, and MRI of the abdomen was performed about 10 minutes after the injection of gadofluorine 8. Immediately after the completion of MRI, the mouse was transferred into the imaging chamber of the CCD camera system, and a green image (marker image), an NIR image (lymph image), and a photographic image were acquired successively in the dorsal projection, with the mouse's position unchanged. Because spatial registration between optical imaging and MRI is more accurate in the central portion of the imaging field than at the periphery portion, 20 we attempted to set the abdomen of the mouse in the center. A black plate with small pieces of black tape was placed on the imaging table to indicate the central portion of the imaging field and to avoid variable rotation in mouse setting. The FOV was 20 cm, and binning was 2. The exposure time was 2 seconds for green imaging and 5 seconds for NIR imaging. Thereafter, the holder and mouse were turned over, and FLI in the ventral projection was performed similarly.
Ex vivo FLI was performed about 24 hours after QD800 injection. Mice were sacrificed, and the tissues corresponding to FLI foci, indicative of lymph node accumulation, were excised. The excised tissues were imaged together with the remaining body to confirm that the excised tissues were the sources of the focal signals.
The FLI marker and lymph images were exported as PNG files using the Living Image software for further image processing. 20 We displayed FLI lymph images using the overlay and blend functions of the software. Whereas the overlay function displays opaque fluorescence images overlaid on photographic images, the blend function fuses transparent fluorescence images with photographic images. The fluorescence and photographic images were presented with rainbow color and gray scales, respectively. The maximum value of the rainbow color scale was determined visually by the operator, and the same value was used for the overlay and blend images. The minimum value was typically set at 10% and −5% of the maximum value for the overlay and blend images, respectively. The FLI marker image was displayed with a grayscale. The maximum value was determined visually to optimize visualization of the registration markers, and the minimum was set at −10% of the maximum.
Coregistration and fusion of FLI and MRI were achieved using an in-house macro (written by Y.M.) for the ImageJ software. 20 The right side of the mouse appeared on the right and left in dorsal and ventral FLIs, respectively, and the right and left in MRI were reversed if needed. The operator determined the coordinates of the center of each marker in the FLI marker image and MRI coronal images. For MRI, only the in-plane coordinates were determined on the slice where the center of each marker was visualized. Spatial registration was performed automatically by scaling and translation of the FLI marker image so that the coordinates of the three markers agreed best (using the least squares method) between FLI and MRI. Adjustment of rotation was attained in data acquisition and was omitted in image processing. The same scaling and translation were applied to the corresponding FLI lymph images, and the registered FLI lymph images were fused with all MRI slices to obtain a stack of fusion images.
Results
Dietary Preparation
In all mice fed with a regular rodent diet, extensive hyperintense areas in the gastrointestinal system were observed in both FLI and MRI (Figure 2). After dietary preparation with potato, the gastrointestinal signals decreased in both FLI and MRI and did not differ largely from signals in the surrounding structures. The mean abdominal signals in far-red FLI were 1.36 × 10⁹ ± 1.67 × 10⁸ p/s/cm2/sr (mean ± SD) and 2.39 × 10⁸ ± 1.16 × 10⁸ p/s/cm2/sr before and after dietary preparation, respectively. The mean abdominal signals in NIR FLI were 1.71 × 10⁸ ± 2.06 × 10⁷ p/s/cm2/sr and 3.36 × 10⁷ ± 1.17 × 10⁷ p/s/cm2/sr before and after dietary preparation, respectively. In MRI, the degree of gastrointestinal hyperintensity was graded as severe in all six mice at baseline. It was graded as mild in two mice and as negligible in four mice after dietary preparation. No discrepant judgments occurred between the two radiologists.
FLI/MRI Lymphography
The results of the FLI/MRI lymphography are summarized in Table 1. In one mouse, in vivo FLI after the injection of QD800 in the right rear footpad demonstrated a hyperintense area only in the right lateral margin of the pelvis on both dorsal and ventral images. Ex vivo FLI confirmed that the FLI focus corresponded to the right inguinal lymph node, and no other lymph nodes exhibited high QD800 accumulation. In the other eight mice, in vivo FLI signals were shown in the right knee, predominantly on the dorsal view, and these were demonstrated by ex vivo FLI to derive from the right popliteal lymph node (Figure 3A). Two distinct FLI foci were also seen in the right parasagittal region of the lower abdomen in the eight mice; one was shown on the dorsal view and the other, located more cranially, was shown on the ventral view. Ex vivo FLI demonstrated that the former was derived from the right sacral lymph node (Figure 3B) and the latter from the right iliac lymph node (Figure 3C). In two of the eight mice, another focus was demonstrated a little more cranially than the iliac node by in vivo and ex vivo FLIs and was ascribed to QD800 accumulation in the lumbar-aortic lymph node (Figure 4). In four of the eight mice, an unclear, dimly lit area was seen in the right parasagittal region of the upper abdomen on the dorsal view when the maximum value of the display scale was reduced. Ex vivo FLI demonstrated that the signal corresponded to the right renal lymph node (Figure 3D). In vivo FLI visualized the right inguinal node in one of the eight mice, and ex vivo FLI demonstrated signals from the right inguinal node in that mouse and another mouse.

Effect of dietary preparation with potato. Ventral images of FLI performed in the NIR region at baseline (A) and after preparation (B) and maximum intensity projection images of MRI performed at baseline (C) and after preparation (D) are presented. A definite reduction in gastrointestinal signals after dietary preparation was seen for both FLI and MRI.
Demonstration of FLI Hyperintensity and MRI Enhancement for Each Lymph Node Region

FLI = fluorescence imaging; MRI = magnetic resonance imaging.
- = absent; + = present; +* = present on ex vivo FLI but not on in vivo FLI. On MRI, unenhanced popliteal and inguinal lymph nodes were shown as hypointense areas but are indicated with a minus sign in this table.
MRI after the injection of gadofluorine 8 in the right rear footpad demonstrated contrast enhancement in all lymph nodes that were visualized by in vivo FLI (see Figure 3 and Figure 4) except one right inguinal node. MRI demonstrated contrast enhancement in one right inguinal node that was detected by ex vivo FLI but not by in vivo FLI and in another right inguinal node that was detected by neither ex vivo nor in vivo FLI. The afferent and efferent lymphatic vessels of the iliac node were seen to varing degrees. The right renal lymph node was shown to be located just medial to the right renal hilum. An enhanced right renal node was demonstrated in one mouse, with no corresponding focus on in vivo or ex vivo FLI. Additionally, complex-shaped hyperintense areas were often seen medial to the upper pole of the left kidney, although no FLI focus at the corresponding location was demonstrated on either in vivo or ex vivo FLI.
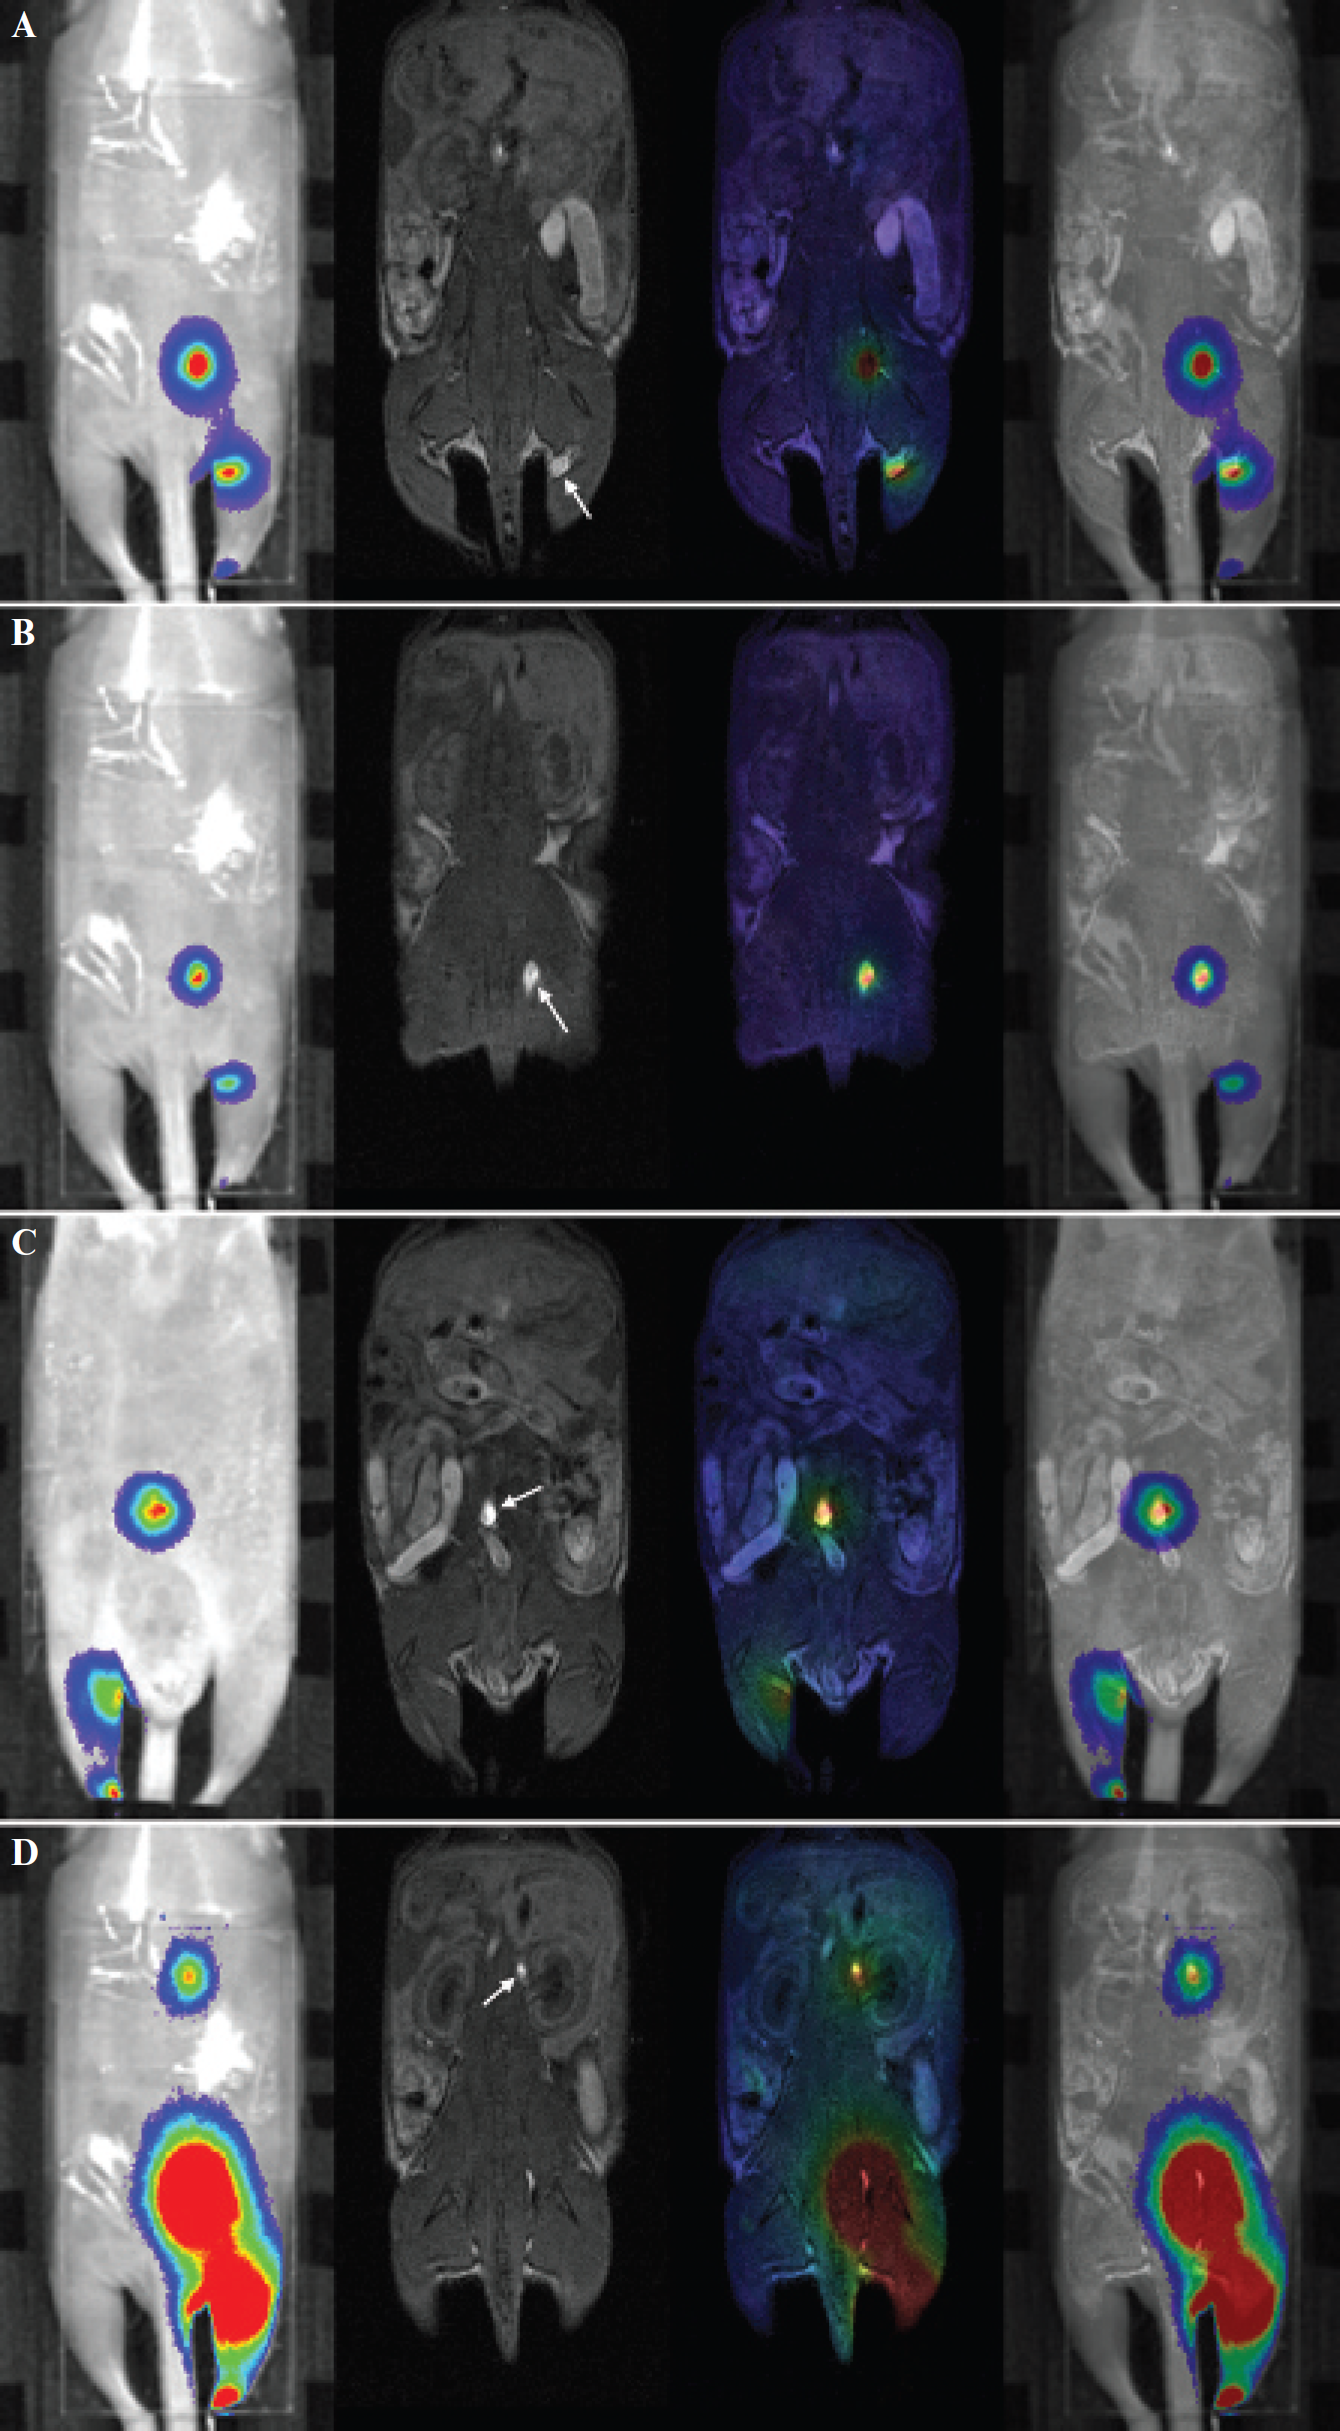
Representative images of integrated FLI/MRI in a mouse, demonstrating the popliteal (A), sacral (B), iliac (C), and renal (D) lymph nodes. The lymph node of interest is indicated by an arrow in each panel. From the left to the right in each panel, the FLI lymph image overlaid on the photographic image (the dorsal view for A, B, and D and the ventral view for C), an MRI coronal image, a fusion image of blend FLI and MRI, and a fusion image of overlay FLI and MRI are presented. The slice of MRI showing the enhanced lymph node corresponding to the fluorescent node was selected for presentation. The color scale for FLI was optimized for each panel. Although correspondence in localization between FLI and MRI was good for the sacral, iliac, and renal nodes, the FLI focus was located mildly caudal to the MRI enhancement for the popliteal node.

Integrated FLI/MRI showing the lumbar aortic lymph node (arrow) in addition to the iliac node (arrowhead). The images are presented as in Figure 3.
When the sacral and iliac lymph nodes were evaluated on FLI/MRI fusion images, the locations of the FLI hyperintense areas corresponded well to those of the enhanced areas in MRI (see Figure 3). Whereas the MRI-enhanced areas were small and distinct, the FLI hyperintense areas were large and not well demarcated, which prevented detailed, quantitative assessment of the accuracy of spatial registration between FLI and MRI. However, when the MRI slices presenting the enhanced areas were assessed, the most intense areas in FLI were shown to correspond to the enhanced areas, suggesting successful registration. In two mice with visible lumbar-aortic lymph nodes, good correspondence between FLI signal and MRI enhancement improved confidence in the image interpretation that the lumbar-aortic node, in addition to the iliac node, received lymphatic flow from the right rear footpad (see Figure 4). Unenhanced inguinal nodes were identified as hypointense areas surrounded by hyperintense fat. The locations of the two inguinal nodes visualized by in vivo FLI corresponded well to those of the enhanced or hypointense area in MRI, suggesting inguinal nodes. The FLI foci representing the right popliteal node tended to be located a little caudally to the MRI enhancement. Although unclear visualization hampered assessment of the registration accuracy, especially for the right renal node, no discrepancy in the location of the node was evident between FLI and MRI. The assessment using the fusion images confirmed that the FLI signal in the upper abdomen corresponded to the right renal node but not to the enhanced areas near the left kidney.
Discussion
In this study, we performed FLI using quantum dots and MRI using gadofluorine 8 successively and generated fusion images to assess the lymph drainage pattern from the right rear footpad of mice. Both FLI and MRI permitted the evaluation of lymph drainage and gave generally consistent results. FLI and MRI demonstrated lymphatic flow to the ipsilateral popliteal, sacral, and iliac lymph nodes in most mice and sometimes to the ipsilateral renal, inguinal, and lumbar-aortic lymph nodes. It has been shown that quantum dots are efficiently taken up and retained by the first draining lymph node. 26 In mice, communication between afferent and efferent lymphatic vessels allows some lymph to bypass the node, 27 which may be responsible for the visualization of multiple lymph node regions. Both FLI and MRI demonstrated lymph drainage only to the inguinal node in one mouse, which may be attributable to variation in the lymph drainage pattern among mice or a latent pathologic process. Concordance in lymph drainage patterns demonstrated by two different techniques appears to improve the reliability of the results. Investigation of the murine lymphatic system using a multimodality imaging approach is expected to aid research in the fields of immunology and oncology using mice.
Both types of discrepancies between FLI and MRI, positive FLI combined with negative MRI and negative FLI combined with positive MRI, were noted for the inguinal lymph node, which cannot be explained by differences in sensitivity. Lymph flow to the inguinal node may be variable among injections, and reproducibility using the same imaging technique should be assessed. In one mouse, the right renal node was enhanced in MRI but was not demonstrated in FLI. The failure of FLI visualization was not due to attenuation of the light in the tissues because even ex vivo FLI did not show the node. The failure may be attributable to variation in drainage among injections or different kinetics between QD800 and gadofluorine 8. MRI showed lymphatic vessels in addition to lymph nodes, and the enhanced structure may be lymphatic vessels but not a renal node. The cause of discrepancies between FLI and MRI remains to be studied. One injection of a bimodal agent, an agent visible on both FLI and MRI, is preferable to two separate injections of two agents to reduce discrepant results,16–19 and integrated FLI/MRI using a bimodal agent should be a subject for future investigation.
Because the MRI and CCD camera systems used in this study were placed close together in the same room, successive data acquisitions of MRI and FLI were readily performed with the mice fixed to an imaging holder and kept anesthetized. The MRI unit can provide high-resolution anatomic images with a practical scan time, despite its relatively low magnetic field. 23 Small markers containing quantum dots for green imaging and Gd-DTPA were placed on the mouse surface, and spatial registration between FLI and MRI was attained by scaling and translation, referring to the coordinates of the markers. After registration, FLI lymph images were fused with all MRI slices, and the observer viewed all fused images serially. We used 2D fluorescence reflectance imaging for FLI. Because the depth of the FLI focus was not measurable on a 2D image, the observer had to select the MRI slice that corresponded to the FLI focus. However, the location within a slice was identified with the aid of image fusion, which facilitated the comparison between FLI and MRI findings. A system for FLI tomography is commercially available, and fusion of FLI tomography with MRI has been reported. 28 Although the use of high-resolution FLI tomography should be ideal for detailed assessment, our results suggest that image fusion with MRI is useful even for conventional 2D FLI.
On the fusion images, the locations of the lymph nodes in the mouse trunk were in good agreement between FLI and MRI, indicating successful spatial registration. 2D FLI presents the light signals that originate from the fluorescent substances within the body and reach the body surface after complex propagation through the tissues. Light suffers from severe scattering and absorption in tissues, and the surface signals are not necessarily detected just above the fluorescent source. The good agreement between FLI and MRI indicates that such deviation is limited in the assessment of abdominal and pelvic lymph nodes and that fusion of 2D optical imaging and 3D MRI is feasible with acceptable accuracy even for deep structures. We reduced the mouse thickness by compression, 12 which may have contributed to the successful results, at least in part.
In two mice, the lumbar-aortic lymph node was visualized in addition to the iliac lymph node; however, the judgment was not definite when FLI and MRI were interpreted separately. In MRI, the lumbar-aortic node was not discriminated from the lymph vessel confidently because the lymph vessel was also enhanced and the lumbar-aortic node was slender. In FLI, separation between the two adjacent sources was not sufficient, and lack of an anatomic reference prevented identification of the lymph regions. Image fusion indicated the correspondence in locations of the two presumptive lymph nodes between FLI and MRI, and the lymphatic flow to the iliac and lumbar-aortic nodes was judged confidently. Additionally, irregular enhanced areas were demonstrated near the kidneys by MRI, and image fusion showed that only the enhanced areas near the right kidney corresponded to FLI foci. The enhanced areas near the left kidney appeared to represent not lymph nodes but lymph vessels, such as cysterna chyli. Image fusion is considered to allow detailed comparison of location between the two modalities and to facilitate detailed, confident interpretation of the results of each modality. Image interpretation of MRI is more difficult than that of FLI, and unexpected enhanced lymph nodes may be missed. Image fusion allows the use of FLI as a guide for interpretation of MRI and appears to be useful, especially for an observer inexperienced in small-animal MRI.
The accuracy in registration was poorer for the popliteal lymph nodes than for the other nodes in the trunk, and FLI foci tended to be located a little caudal to the enhanced areas in MRI. FLI signals appeared to be attenuated more severely in the cranial portions than in the caudal portions owing to the presence of thicker overlying tissues (pelvis vs limb), presumably resulting in a caudal shift of the FLI foci. Such misregistration attributable to the difference in thickness or optical properties of the tissue should be taken into consideration in image interpretation. It would be beneficial to make the thickness of the tissue overlying the fluorescent source small and uniform. Static magnetic field inhomogeneities and gradient field nonlinearities can cause geometric distortion in MRI. 29 In optical imaging, the camera-object distance differs depending on the position on the imaging table and the object height, resulting in different magnification in a given image. 30 Such image distortion and consequent misregistration are larger for the peripheral portions of the imaging field of the MRI and CCD camera systems than for the central portions, 20 and we attempted to set the mice in the central portions. Incorporation of distortion correction would improve accuracy in registration and remains to be investigated. Manual determination of marker coordinates also causes inaccuracy, as well as operator burden, and automatic data processing is desirable.
Hyperintense signals in the gastrointestinal system were observed in far-red or NIR FLI and in T1-weighted MRI in mice fed with the regular rodent diet. Such gastrointestinal hyperintensity can hide fluorescent lymph nodes in the abdomen. In MRI, the hyperintensity may degrade image quality 25 and mimic enhanced structures. Feeding a purified diet reduces gastrointestinal hyperintensity in FLI 24 but not in MRI. 25 Gastrointestinal hyperintensity in MRI can be reduced by feeding potato or sweet potato for 1 day. 25 In this study, we searched for a method to reduce gastrointestinal signals in both FLI and MRI. We tested dietary preparation with potato because preliminary experiments revealed weak fluorescence from potato (data not shown). Gastrointestinal signals in mice were effectively depressed in both FLI and MRI after 1-day feeding with potato. This dietary preparation is simple and appears to be suitable for integrated FLI/MRI.
In summary, we performed integrated FLI/MRI in intact mice to assess the lymphatic drainage from the right rear footpad. Integrated FLI/MRI lymphography, supplemented by image fusion, was feasible and provided consistent results between FLI and MRI. The locations of FLI hyperintensity corresponded well with those of MRI enhancement, supporting the validity of the fusion of 2D optical imaging and 3D MRI in evaluating deep structures. Integrated FLI/MRI lymphography with image fusion is expected to contribute to the analysis of the murine lymphatic system and to aid in understanding experiments using mice in the fields of oncology and immunology. Its spread may depend on the availability of MRI system installed close to the CCD camera system. The use of a bimodal agent visible on both FLI and MRI in integrated FLI/MRI lymphography would provide further benefits.
Footnotes
Acknowledgments
Financial disclosure of authors: This work was supported, in part, by a Grant-in-Aid for Scientific Research from the Ministry of Education, Culture, Sports, Science and Technology of Japan (18390329). Tomoyuki Haishi works for MRTechnology, Inc., the vendor of the MRI system used here.
Financial disclosure of reviewers: None reported.