
Abstract
The purpose of this article is to present a user-friendly tool for quantifying the iron content of superparamagnetic labeled cells before cell tracking by magnetic resonance imaging (MRI). Iron quantification was evaluated by using Prussian blue staining and spectrophotometry. White blood cells were labeled with superparamagnetic iron oxide (SPIO) nanoparticles. Labeling was confirmed by light microscopy. Subsequently, the cells were embedded in a phantom and scanned on a 3 T magnetic resonance tomography (MRT) whole-body system. Mean peak wavelengths Λpeak was determined at A720nm (range 719–722 nm). Linearity was proven for the measuring range 0.5 to 10 μg Fe/mL (r = .9958; p = 2.2 × 10⁻¹²). The limit of detection was 0.01 μg Fe/mL (0.1785 mM), and the limit of quantification was 0.04 μg Fe/mL (0.714 mM). Accuracy was demonstrated by comparison with atomic absorption spectrometry. Precision and robustness were also proven. On T2-weighted images, signal intensity varied according to the iron concentration of SPIO-labeled cells. Absorption spectrophotometry is both a highly sensitive and user-friendly technique that is feasible for quantifying the iron content of magnetically labeled cells. The presented data suggest that spectrophotometry is a promising tool for promoting the implementation of magnetic resonance-based cell tracking in routine clinical applications (from bench to bedside).
MAGNETIC RESONANCE IMAGING (MRI) provides excellent anatomic details with high spatial resolution and high contrast. Besides routine clinical applications, MRI is also a powerful tool in molecular imaging for a broad range of applications, such as monitoring of gene therapy, target-specific imaging, functional cellular imaging, and cell tracking.1–13 The latter is an interesting tool for noninvasively imaging cell migration in real time in vivo that will improve different clinical and scientific applications, including (stem) cell therapy, monitoring of T-cell homing, and metastasis of malignant cells.6–14 Magnetic resonance (MR) cell tracking is based on ex vivo labeling with superparamagnetic iron oxide (SPIO) nanoparticles, for example. In the past, great success has been achieved by using either transfection agents or transmembrane location molecules (eg, HIV tat peptide) to enhance nanoparticle accumulation within cells.15–17 But the methods for iron quantification have not been optimized. Before magnetic cells are (re)injected for MR cell-tracking approaches, measurement of the iron content per cell is an elementary step to ensure sufficient uptake of nanoparticles. Currently, iron content is quantified by various methods, such as atomic absorption spectroscopy (AAS), inductive coupled plasma atomic emission spectrometry, magnetophoresis, and electron spin resonance.7,10,15,18 These techniques are time-consuming and need expensive equipment that is rarely available in radiologic units. Therefore, the purpose of the present investigation was development and evaluation of a user-friendly spectrophotometric method based on the Prussian blue reaction.
Materials and Methods
Iron Compounds and Nanoparticles
For magnetic labeling, the following compounds were used:
Ferrucarbotran (SHU 555 A, Resovist, Schering AG, Berlin, Germany) SPIO nanoparticles
Ferumoxide (Endorem, Guerbet, Aulnaysous-Bois, France) SPIO nanoparticles
Given that the iron (Fe) content in commercially available SPIO preparations can differ from the values on the label at ± 10%, iron powder dissolved in an acid solution of 3:1 hydrochloric (HC1) to nitric acid (HNO3) was used as a reference.
Cell Preparation and Magnetic Cell Labeling
Peripheral mononuclear blood cells (PBMCs) were separated from anticoagulated whole blood provided by healthy donors by density gradient (1.077 g/mL) centrifugation. Blood samples collected in ethylenediaminetetraacetic acid tubes were 1:1 diluted in phosphate-buffered saline (10 mmol/L sodium phosphate, 2.7 mmol/L potassium chloride, and 137 mmol/L sodium chloride, pH 7.4; containing 0.4% wt/vol trisodium citrate), carefully set on Biocoll separation solution (Biochrom, Berlin, Germany), and spun down at room temperature and at 3,000 rpm (revolutions per minute) for 25 minutes and were afterward harvested from the plasma/separation medium interface. Two × 106 PBMC/mL were cultured in RPMI 1640 medium supplemented with 5% heat-inactivated fetal calf serum, penicillin, and streptomycin (Sigma, Steinheim, Germany) for the indicated times at 37°C and 5% CO2 in a humidified atmosphere. Nanoparticles were added at concentrations ranging from 125 to 280 μg Fe/mL. Afterward, the cells were washed twice to remove the not engulfed nanoparticles. Cell viability was assessed by trypan blue (Sigma) exclusion. Cell counting was done by using light microscopy and a hemocytometer or an automatic cell counter (Sysmex XE2100, Sysmex Europe, Norderstedt, Germany).
Cytoplasmic accumulation of SPIO in PBMCs was visualized by light microscopy. Both unstained and Prussian blue-stained samples counterstained with nuclear fast red were visualized by light microscopy (DM 5000, Leica, Wetzlar, Germany).
For spectrophotometric measurements, 900 µUL of 2 N HC1 was added to 100 µUL of cell sediment obtained by centrifugation (2,000 rpm). Cells were either lysed at 80°C for 30 minutes or left at room temperature (untreated cells). Thereafter, the samples were centrifuged (2,000 rpm) to obtain clear supernatants.
Spectrophotometry
Potassium hexacyanoferrate (II) (Sigma) solution, 80 mg in 1 mL distilled water, was freshly prepared. Absorption spectrophotometry was done 20 minutes after mixing 1 volume of potassium hexacyanoferrate (II) with 3 volumes of sample in 2 N HC1 (Merck GmbH, Darmstadt, Germany), resulting in a final concentration of 2% potassium hexacyanoferrate (II) (weight/volume) and 1.5 N HC1. Samples were prepared in the following way: standard: 100 mg iron powder (Sigma-Aldrich, Taufkirchen, Germany) was dissolved in 10 mL acid (1 volume of 65% nitric acid plus 3 volumes of 37% hydrochloric acid). The solution was diluted with distilled water to 100 mL; 1 mL of the diluted iron solution was further diluted with 2 N HC1 to 100 mL, resulting in an iron concentration of 10 μg/mL. Resovist or Endorem was diluted with 2 N HC1. Supernatants of cell lysates in 2 N HC1 did not require further treatment before mixing with potassium hexacyanoferrate (II) solution. Measurement of absorption was performed with a spectrophotometer, either a Lambda 12 (PerkinElmer, Rodgau, Germany) or an UltroSpec 500 plus (Amersham Biosciences Europe GmbH, Freiburg, Germany). Samples were measured in 1 mL cuvettes (Greiner, Labortechnik, Kremsmünster, Austria).
Wave scans (absorption spectrum) were done to identify the peak wavelengths Λpeak. The evaluation (eg, detection of linearity, limit of detection, determination of accuracy) was done as described previously. 19 Briefly, linearity was evaluated by plotting a standard curve (see Results). Linearity is defined to produce results within the given range of concentrations that are directly proportional to the concentration of the analytes. This mathematical equation is called calibration function.
Limit of detection has been calculated as xLD = 3 s0, and limit of quantification has been calculated as xLQ = 9 s0. In this equation, s0 is the standard deviation of a 10-fold measurement of a blank or of a sample with a very low concentration of the analyte.
The accuracy of an analytical method describes the closeness of the mean test results obtained by the method to the true value (concentration) of the analyte. Accuracy has been determined by comparing the results with a second validated method, namely AAS, which is currently one of the gold standards for quantifying iron. Furthermore, a correlation between spectrophotometry and MR relaxometry has also been done.
The recovery rate Rc in percent has been calculated as follows:

The precision describes the closeness of agreement (degree of scatter) between a series of measurements obtained from multiple sampling of the same homogeneous sample under the prescribed conditions. The precision of the measurement has been determined by measurement of three samples prepared with identical concentration on 6 days.
The robustness or stability of an analytic system shows the deviations of the results under suboptimal conditions. Experiments for this approach were done with different incubation times (0–60 minutes), at different wavelengths, with different concentrations of the eluents, and in the presence of nonlysed cells.
Atomic Absorption Spectrometry
AAS was done with a SpectrAA Plus 10 atomic absorption flame spectrometer (Varian Deutschland GmbH, Darmstadt, Germany). For Fe measurements, atomic absorption was measured at 248.3 nm and calibrated with 10 standards, containing 0.5 to 10 μg Fe/mL. All measurements were performed twice in a peak height mode.
MR Examinations
MRI was performed using a clinical 3.0 T MR scanner (Archieva 3.0T, Philips Medical Systems, Best, The Netherlands) and a transmit/receive head coil for high-resolution MRI. Test tubes containing the cells were placed in a water-containing phantom. R1 relaxation rates of iron oxide-labeled cells and unlabeled controls were measured by an inversion recovery series of eight PRESS-localized unsuppressed 1H spectra with varying inversion delay (TI) and repetition time/echo time (TR/TE) of 3000/32 ms. The T1 relaxation times of the labeled cells were subsequently derived from a nonlinear least-squares fit to the measured intensities of the spectral water peak. The R2 relaxation rates of the cells were measured by a Hahn spin-echo series of eight unsuppressed 1H spectra with varying TE and a TR of 1,500 ms. R2 relaxation rates were calculated from the negative slope of the logarithm of the signal intensities. Additionally, a turbo spin-echo (TSE) sequence with TR/TE1, TE2 2000/20, 60 ms, a turbo factor of 3, and a slice thickness of 5 mm was applied for a direct pixel-by-pixel calculation of T2 maps in comparison to the R2 determination by MR spectroscopic relaxometry.
Statistical Analysis
The presented data show mean values ± standard deviation. The normal distribution of the investigated subsets was proved by the Kolmogorov-Smirnov test. The significance of differences between means was calculated using the Student t-test. Mann-Whitney nonparametric tests were used for comparison of the variables with skewed distribution. Correlations between values were calculated using the Pearson correlation. Fisher exact test was used to calculate significant differences in small groups. Linear regression was performed, and the correlation coefficient r was determined. Differences between values were considered statistically significant at p < .05.
Results
Determination of Peak Wavelength »peak
After Prussian blue staining, the peak wavelengths »peak of all measured iron compounds had a mean value of 720 nm (± 3.2 nm). A minimum of 10 measurements for each sample were performed. The obtained differences were particle size dependent, without a hint of statistical significance. Given that the particles were dissolved in HC1, no difference may be expected, and none was observed. The following measurements were done at A720nm if not otherwise indicated.
Linearity of the Standard/Calibration Curve and Measuring Range
Linearity between the results of the spectrophotometry measurements and the real iron content could be demonstrated (regression was y = 0.1468 x, correlation coefficient r was .9958 [p = 2.2 × 10⁻¹²]) (Figure 1A). The specific measuring range was derived from linearity studies and ranges from 0.5 to 10 μg Fe/mL. The measuring range has been validated with respect to its linearity, accuracy, and precision.

A, Standard curve (SPIO [Resovist]) obtained by spectrophotometry measured at A720 nm. The graph shows the linearity of the standard curve. B, Standard curve (SPIO [Resovist]) obtained by NMR relaxometry at 3 T (T2-weighted TSE sequence). Sample dilution has been done using water.
In addition, a standard curve was created by MR relaxometry at 3 T and calculation was done using T2 maps from double-echo TSE sequences (Figure 1B).
Limit of Detection and Limit of Quantification
Limit of detection was calculated as 0.00189, which is equivalent to 0.01 μg Fe/mL, and limit of quantification (LQ) was calculated as 0.00567, which is equivalent to 0.04 μg Fe/mL.
Accuracy
First, accuracy was demonstrated by comparing the results of spectrophometry and AAS measurements. Thereby, a correlation coefficient of r = .98284 could obtained. This was statistically significant (p = 1.78 × 10⁻¹³) (Figure 2A). Of special note is the fact that for AAS measurements, a minimal volume of approximately 5 mL was necessary, whereas only 0.5 mL was necessary for spectrophotometric measurements.

A, Correlation between spectrophotometry and AAS resulted in a correlation coefficient of r = .98175 (p = 2.4 × 10⁻⁷). B, The bars (white = AAS; gray = spectrophotometry) show the accuracy of the iron concentration expressed as Δ percentage (measured value/expected result). Although the results obtained by both methods produce similar results, the results obtained by spectrophotometry were closer to 100% than those obtained by AAS. 1 = Endorem 3.36 μg Fe/mL; 2 = Endorem 4.0 μg Fe/mL; 3 = Resovist 5.6 μg Fe/mL; 4 = Resovist 5.6 μg Fe/mL.
Measured results obtained by AAS differed significantly from expected values (p < .05), whereas those obtained by spectrophotometry did not differ significantly from expected values (p > .05). The deviation from expected values, calculated as (measured value/expected result) X 100, obtained by AAS and spectrophotometry is shown in Figure 2B.
The correlation between MR relaxometry and spectrophotometry showed the following significant results: (1) T2 results and absorption spectrophotometric measurements (r = -.73757; p = .01837) and (2) R2 results and absorption spectrophotometric results (r = .99512; p = 1.4 × 10⁻⁷).
Recovery
When using SPIO particles in the sample, the mean (± SD) of the recovery rate was 107.2% ± 6.12% for Resovist and 110.4% ± 4.52% for Endorem. The recovery rate of both series did not differ significantly from reference values.
Precision
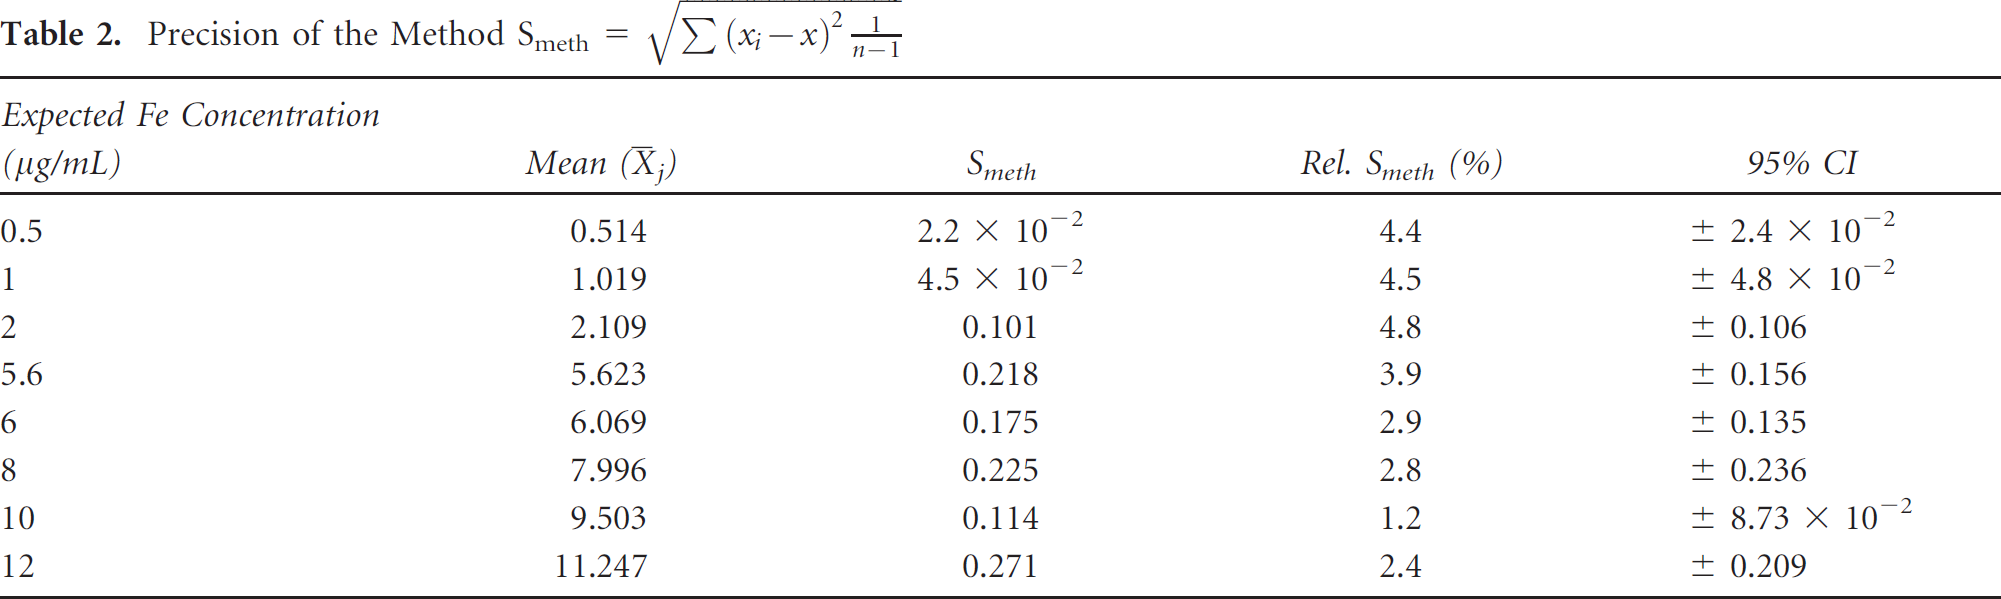
Precision indicates how close together or how repeatable the results are. A precise method will give very nearly the same result each time it is used. There are several ways to demonstrate the precision of results. The simplest way is using the range (the difference between the highest and lowest results) often reported as a ± deviation from the average. The results are shown in Table 1 and Table 2.
Precision of Measurement

Calculation of the total standard deviation st has been done as follows:
Precision of the Method
Robustness/Stability
Immediately after mixing the necessary components, the kinetic measurement was started and was finished 60 minutes later. The colored complex developed within the first 10 to 15 minutes. The absorption value did not change significantly up to 60 minutes (Figure 3). All measurements were done after 20 minutes of incubation.
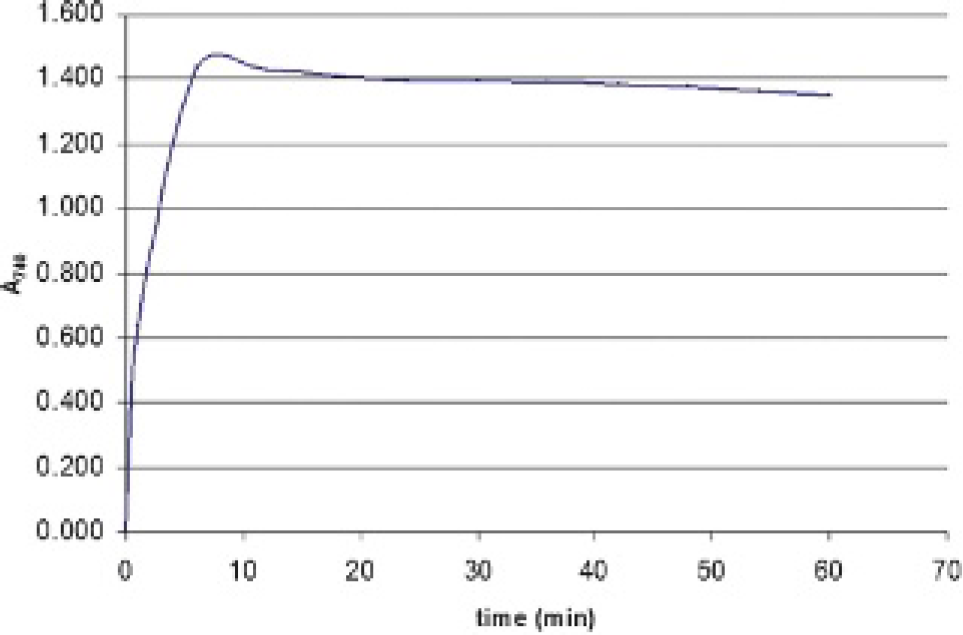
Kinetic measurements at A740nm starting immediately after mixing the reagents up to 60 minutes afterward. The kinetic curve shows rapid development of the colored complex within the first 10 minutes, followed by a nonsignificant decline. All subsequent measurements had been done after 20 minutes.
To demonstrate the influence of the wavelength, measurements at the following different wavelengths were performed: »peak ± 10 nm, »peak ± 20 nm, and »peak ± 30 nm. As shown in Figure 4, the greater the distance to »peak, the flatter the slope of the curve is.

Measurements at different wavelengths show their influence on the gradient of the standard curves. Results obtained by measurement at the peak wavelength »peak produced the steepest slope of the curve. The greater the distance from the peak wavelength »peak, the flatter the resultant slope is.
The concentration of the eluents (HCl and 2% freshly prepared potassium hexacyanoferrate (II)) was changed in the next step to show its influence on the results obtained by spectrophotometry (data not shown).
The opacity of the solution owing to nonlysed cells leads to dispersion of the emitted light beam and thereby to a false-positive result (Figure 5). The same was true when air bubbles were present in the cuvette (data not shown).
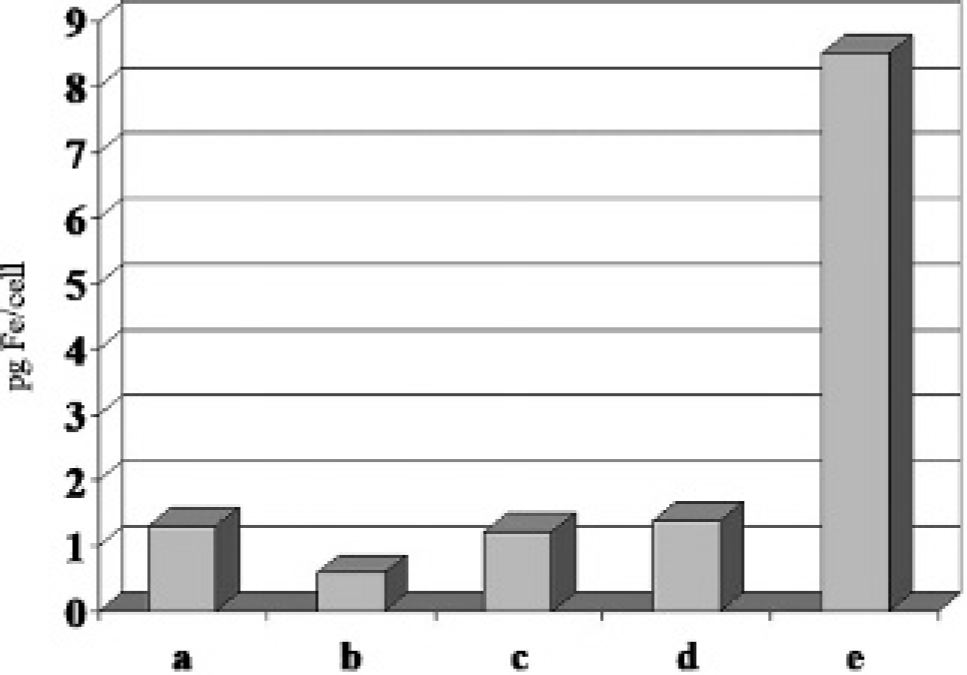
Control samples without SPIO nanoparticles and samples that have been labeled with SPIO (Resovist) 140 μg Fe/mL cell culture under standard conditions at indicated times at 37°C: (a) control sample without SPIO nanoparticles and nonlysed cell suspension; (b) control sample without SPIO nanoparticles and lysed cell suspension; (c) cell culture of 30 minutes; (d) cell culture of 1 hour; (e) cell culture of 2 hours.
MRI versus Spectrophotometry
Finally, MRI results and results obtained by spectrophotometric iron quantification were compared (Figure 6). MRI and relaxometry were used for the estimation of the iron concentration in the cells. SPIO labeling caused a strong T2 effect that increased with the iron content. Iron concentrations below 1.0 μg Fe/mL caused no significant signal intensity loss (see Figure 6).

TSE sequence (TR/TE 3000/25 ms) at 3 T on a 3 T whole-body MR scanner (AchievaX) of the following samples (1–4 cell samples; 5–10 samples containing the indicated concentrations of Fe in water without cells): 1 = 1.0 × 10³ PBMC/µUL without magnetic cell labeling; 2 = 1.0 × 10³ PBMC/µUL SPIO (Resovist) (4.5 μg Fe/mL); 3 = 1.06 × 10³ PBMC/µUL with SPIO (Resovist) (30 μg Fe/mL); 4 = 1.09 × 10³ PBMC/µUL with SPIO (Resovist) (60 μg Fe/mL); 5 = 2.0 μg Fe (Resovist)/mL; 6 = 3.75 μg Fe (Resovist)/mL; 7 = 7.5 μg Fe (Resovist)/mL; 8 = 15.0 μg Fe (Resovist)/mL; 9 = 20.0 μg Fe (Resovist)/mL; 10 = 30.0 μg Fe (Resovist)/mL.
Discussion
Noninvasive MR cell tracking is a promising tool for different applications.1–15 Owing to its strong effects on T2/T2* contrast, iron oxide nanoparticles appear to be the most widely used labeling agents for cell-tracking studies.11–13,20–23 To ensure labeling efficiency before MRI quantification of the cellular iron content in magnetically labeled cells is of great importance.
Current quantification techniques need special experience with expensive laboratory equipment 10 , 15 , 18 that may limit their application under routine conditions. The purpose of this article was to present a user-friendly method using spectrophotometry after Prussian blue staining to quantify the iron content after labeling. Although spectrophotometry was used to quantify iron in a few articles, 3 , 24 none of them evaluated the method. Funovics and colleageus did not use Prussian blue staining; therefore, they measured at 405 nm. 3 Spectrophotometric measurement should be done in stained samples because in unstained samples, the results were not reproducible (data not shown). Although spectrophotometric measurements should not necessarily be done at peak wavelength, especially in cases of low iron concentrations, the measurement at peak wavelength leads to more accurate results than measurements at other wavelengths do. Previously, linearity between the results of the measurements obtained by spectrophotometry and the real iron content was shown by Raynal and colleagues: their iron concentrations ranged between 0 and 220 μg Fe/mL. 24 The fact that commercially available nanoparticles are not suitable as reference material was not mentioned previously. 24 Limit of detection and limit of quantification, accuracy, recovery, precision, and robustness/stability were not analyzed or calculated previously. 3 , 24
The results obtained by AAS and spectrophotometry correlated with each other (see Figure 2A). But although the difference of the spectrophotometric results from the expected results was not significant, this difference was significant when measured by AAS (see Figure 2B). The reason why spectrophotometric data were nearer to the expected results than the results obtained by the gold standard AAS is unknown.
AAS is currently the gold standard for quantifying iron content. In contrast to this established method, the herein described method has the following advantages: the costs for both equipment and sample analysis are lower; the equipment is much smaller and can be established in radiologic units next to the MR scanner; the procedure for quantifying the iron content is very easy, so no special training is necessary; much smaller sample volumes are sufficient for the analysis; and the analysis is time saving compared to AAS.
Conclusion
The presented data show that absorbance spectrophotometry after Prussian blue staining is feasible and could be validated. In contrast to currently used techniques, spectrophotometry is a user-friendly, time-and cost-saving method for quantifying the iron content in cells after magnetic labeling and before MR cell tracking. The possibility of quantifying iron oxide nanoparticles should be established in radiologic units or departments independently of other institutions. This aim seems to be achievable with a noncomplicated method such as spectrophotometry as presented. It is hoped that the use of spectrophotometry will accelerate the progress of stem cell monitoring by MRI in routine clinical applications.
Footnotes
Acknowledgments
The author thanks Dr. W. Block and Dr. F. Traeber, who performed the MR-based examinations image, and Prof. Süwerkrüp for performing the AAS analyses.
Financial disclosure of author and reviewers: None reported.