
Abstract
The reversal effect of multidrug resistance (MDR1) gene expression by adenoviral vector-mediated MDR1 ribonucleic acid interference was assessed in a human colon cancer animal model using bioluminescent imaging with Renilla luciferase (Rluc) gene and coelenterazine, a substrate for Rluc or MDR1 gene expression. A fluorescent microscopic examination demonstrated an increased green fluorescent protein signal in Ad-shMDR1- (recombinant adenovirus that coexpressed MDR1 small hairpin ribonucleic acid [shRNA] and green fluorescent protein) infected HCT-15/Rluc cells in a virus dose-dependent manner. Concurrently, with an increasing administered virus dose (0, 15, 30, 60, and 120 multiplicity of infection), Rluc activity was significantly increased in AdshMDR1-infected HCT-15/Rluc cells in a virus dose-dependent manner. In vivo bioluminescent imaging showed about 7.5-fold higher signal intensity in Ad-shMDR1-infected tumors than in control tumors (p < .05). Immunohistologic analysis demonstrated marked reduction of P-glycoprotein expression in infected tumor but not in control tumor. In conclusion, the reversal of MDR1 gene expression by MDR1 shRNA was successfully evaluated by bioluminescence imaging with Rluc activity using an in vivo animal model with a multidrug resistance cancer xenograft.
Ribonucleic acid interference (RNAi)-based gene therapy has been demonstrated to be a useful method for cancer gene therapy. 2 In addition, there have been reports on the effective inhibition of function of MDR1/Pgp using a viral system that expresses small hairpin ribonucleic acid (shRNA) for MDR1 in a drug-resistance cancer model.3,4 Although these studies have demonstrated the therapeutic effects of viral vectors that express shRNA for MDR1 in in vitro or in vivo models, these studies did not demonstrate effective functionality by the in vivo imaging in an animal model with a multidrug resistance tumor.
Molecular imaging can be used to monitor the expression and effects of therapeutic genes in vivo and be indispensable for the development and evaluation of new methods for cancer gene therapy. 5 If the function of a viral system that expresses MDR1 shRNA can be noninvasively monitored in living organisms, the frequency and dose of virus administration can be determined with ease, in addition to the feasibility of the system. An optical imaging system using the Renilla luciferase (Rluc) gene and coelenterazine has been suggested for direct visualization of Pgp transport function in living subjects because coelenterazine analogues have the structural and physiochemical properties of compounds transported by Pgp. 6
In this study, we attempted to evaluate the reversal of multidrug resistance after transfection of an adenovirus-expressing MDR1 shRNA with the use of in vivo bioluminescence imaging in a human colon cancer model expressing the Renilla luciferase gene.
Materials and Methods
Stable Cells and Animals
The Internal Review Board at Medical College of Kyungpook National University and Kyungpook National University Hospital approved the study for the handling and use of animals in our institute. The human colon cancer cell line HCT-15 was maintained in RPMI 1640 medium containing 10% fetal bovine serum (Hyclone, Logan, UT) and 50 units/mL streptomycin-penicillin (GibcoBRL, Grand Island, NY) at 37°C in a humidified atmosphere containing 5% CO2. Specific pathogen-free 6-week-old male BALB/c nude mice were obtained from SLC (Hamamatsu, Japan). Rluc complementary DNA (cDNA) was amplified from pRL-CMV vector (Promega, Madison, WI) using forward primer 5′-AATTACTCGCTTCCAAGGTGTAC and reverse primer 5′-TACGCTCTAGAGACTCTAGAATTACTGCTCGTTC. Amplification products were treated with XhoI and XbaI restriction enzymes and subcloned downstream of the internal cytomegalovirus (CMV) promoter between XhoI and XbaI sites of pcDNA3 (Invitrogen, Grand Island, NY). pcDNA3-Rluc was transfected into HCT-15 cells using Lipofectamine Plus Reagents (Invitrogen, Carlsbad, CA), according to the manufacturer's instructions. Selection was performed with G418 in RPMI 1640 medium containing 10% fetal bovine serum for 2 weeks. For in vitro imaging of HCT-15/Rluc cells, 1 X 10⁵, 3 X 10⁵, 6 X 10⁵, and 9 X 10⁵ cells were plated onto 24-well plates, and coelenterazine (at a final concentration of 470 nM; Biotium, Hayward, CA) was added to the cells. Rluc activity was determined with IVIS 200 (Xenogen, Caliper, CA).
Construction of an Adenovirus Vector Expressing MDR1 shRNA
The shRNA sequence targeting the human MDR1 gene corresponded to the coding region at positions 79 to 99: 5′-AAGGAAAAGAAACCAACTGTC-3′ (GenBank access number NM_000927). shRNA duplexes with the following sense and antisense sequences were used: 5′-TCGAGCGACAGTTGGTTTCTTTTCCGCGGCCGCAGGAAAAGAAACCAACTGTCTTTTTTCCAAA (sense) and 5′-AGCTTTTGGAAAAAAGACAGTTGGTTTCTTTTCCTGCG GCCGCGGAAAAGAAACCAACTGTCGC (antisense). All of the shRNA duplexes were synthesized by Bioneer (Daejon, Korea) and were annealed. shRNA for targeted MDR1 messenger RNA was cloned into the Xho I and Hind III sites of pRNAT H1-1 vector (GenScript, Piscataway, NJ) using an adenoviral vector system.
Ad-shMDR1 is a recombinant adenovirus that expresses human MDR1 shRNA and the green fluorescent protein (GFP) gene under the control of U6 and the CMV promoter, respectively. The shuttle pRNAT H1-1 vector was homologously recombined with pAdEasy-1 vector into electrocompetent BJ5183 bacteria and was selected on kanamycin LB plates. Complete Ad-shMDR1 virus was recovered by transfection of 10 μg of Pac I digested DNA into human embryonic kidney (HEK) 293 cells by use of a Lipofectamine-based procedure.
All viral stocks were prepared from infected HEK 293 cells by the use of standard procedures. After two-step purification on CsCl gradients, viral stocks were desalted by the use of G50 columns (Pharmacia, Orsay, France) and viral stocks were frozen at −70°C in phosphate-buffered saline (PBS) containing 10% glycerol. Viral titers were calculated by determination of the median tissue culture infective dose or with the use of the adeno-X rapid titer kit (BD Bioscience, Palo Alto, CA). Titers are expressed as either multiplicity of infection (MOI) or as plaque-forming units (PFU)/mL.
Fluorescent Microscopy and Renilla Luciferase Assay
HCT-15/Rluc cells (2 X 10⁴ cells) were seeded onto 96-well plates. HCT-15/Rluc cells were infected with AdshMDR1 at 0, 15, 30, 60, and 120 MOI 1 day later. To determine GFP gene expression, fluorescent microscopy was performed 2 days after infection with the use of a Deltavision RT deconvolution microscope (Applied Precision, Issaquah, WA). Concurrently, coelenterazine was added into live HCT-15/Rluc cells, and Rluc activity was determined using a microplate luminometer (Molecular Devices, Sunnyvale, CA).
HCT-15/Rluc cells (2 X 10⁴ cells) were plated onto 96-well plates. One day later, HCT-15/Rluc cells were treated with PBS or cyclosporine (5 μM). Fifteen minutes after the addition of cyclosporine (a Pgp inhibitor; Sigma, St. Louis, MO), 7 coelenterazine (a luciferase substrate) was added to cells and Rluc activity was determined using a microplate luminometer 7 minutes after the addition of coelenterazine.
Reverse Transcription-Polymerase Chain Reaction Analysis
For reverse transcription-polymerase chain reaction (RT-PCR) analysis of the Rluc gene, total RNA was extracted from cells with TRIzol reagent (Invitrogen) and RNA was quantified by the use of ultraviolet (UV) light absorbance spectroscopy. The reverse transcription reaction was performed using the Superscript First-Strand cDNA Synthesis detection system (Fermentas, Vilnius, Lithuania) in a final volume of 20 μL consisting of 200 ng of random hexamers, 1× reverse transcription buffer, 2.5 mM MgCl2, 1 mM deoxyribonucleotide triphosphate (dNTP) mixture, 10 mM dithiothreitol (DTT), RNase OUT recombinant ribonuclease inhibitor, 50 units Superscript reverse transcriptase, and diethylpyrocarbonate-treated water. After incubation for 60 minutes at 42°C, the reverse transcription reaction was terminated by heating for 15 minutes at 70°C. The newly synthesized cDNA was amplified by polymerase chain reaction (PCR). The reaction mixture contained 2 μL of cDNA template, 1.5 mM MgCl2, 2.5 U Taq polymerase, and 0.3 μM of Rluc primers (sense 5′-TGATCCAGGAGGCGATATGA-3′; antisense 5′-TATGATTCCGAGAAGCACGC-3′). Glyceraldehyde 3-phosphate dehydrogenase (GAPDH) primers (forward: 5′-GCCAAAAGGGTCATCATCTC-3′ reverse: 5′-GTAGAGGCAGGGA TGATGTTC-3′) were used as an internal control. Amplification was performed under the following conditions: 94°C for 3 minutes (initial denaturation); 94°C for 1 minute, 58°C for 1 minute, 72°C for 1 minute 30 seconds (30 cycles); and 72°C for 15 minutes (final extension). PCR products were electrophoresed on 1.5% agarose gels, and the DNA products were visualized by ethidium bromide staining.
For RT-PCR analysis of the MDR1 gene, HCT-15/Rluc cells were infected with 120 MOI of Ad-shMDR1. Two days later, total RNA was extracted from infected cells or noninfected cells using TRIzol reagent (Invitrogen) and RNA was quantified by UV light absorbance spectroscopy. Reverse transcription was performed using the Superscript First-Strand cDNA Synthesis detection system (Fermentas). Briefly, 2 μg of total RNA was reverse transcribed in a final volume of 20 μL containing 200 ng random hexamer primers, 1× reverse transcription buffer, 2.5 mM MgCl2, 1 mM dNTP mixture, 10 mM DTT, 20 units ribonuclease inhibitor, and 50 units Superscript reverse transcriptase. The reaction mixture contained 2 μL of cDNA template, 1.5 mM MgCl2, 2.5 units rTaq polymerase, and 20 pM mdr1 primers (forward: 5′-ATATCAGCAGCCCACATCAT-3′; reverse: 5′-GAAGCACTGGGATGTCCGGT-3′). GAPDH primers (forward: 5′-GCCAAAAGGGTCATCATCTC-3′; reverse: 5′-GTAGAGGCAGGGATGATGTTC-3′) were used as an internal control. PCR products were electrophoresed on 1.5% agarose gels, and PCR fragments were visualized using ethidium bromide staining.
In Vivo Bioluminescent Imaging
A total of 1 X 10⁷ HCT-15/Rluc cells were challenged to right and left thigh of hind leg of nude mice, respectively. When the tumor volume reached approximately 100 mm3, Ad-shMDR1 (1 X 10⁹ PFU) and PBS were injected into tumors in the left and right flanks of the mice, respectively.
One day after viral infection, coelenterazine (20 μg in 100 μL of PBS) was injected into tumor-bearing mice via the tail vein. Bioluminescent imaging was performed with IVIS200 (Xenogen, Caliper, CA) 10 minutes after the injection of coelenterazine.
Histopathologic Analysis
Tumor masses were removed from mice and were preserved in 10% formalin until required. All tumor masses were embedded in paraffin and were sectioned at 5 μm thickness. For immunohistologic analysis of Pgp (Calbiochem, La Jolla, CA), the paraffin sections were incubated for 1 hour with anti-Pgp at 1:100. Sections were then incubated for 30 minutes with a goat antirabbit secondary antibody conjugated to peroxidase (Immunotech, Marseille, France).
Statistical Analysis
Data are presented as the mean ± standard deviation. Inter-group differences were assayed using the two-tailed Student t-test, and p values < .05 were considered statistically significant.
Results
Stable Expression of the Renilla Luciferase Gene in HCT-15/Rluc Cells
A stable human colon cancer cell line expressing the Renilla luciferease gene (HCT-15/Rluc) was successfully established from a human colon cancer cell line (HCT-15) that expresses Pgp intrinsically. Rluc gene expression was detected in HCT-15/Rluc cells by RT-PCR analysis but not in parental cells (Figure 1A). In vitro bioluminescent imaging showed the positive correlation between Rluc activity and cell number (Figure 1B; R2 = .947).

RT-PCR analysis for Rluc gene and bioluminescent imaging of intact HCT-15/Rluc cells. HCT-15 cells were transfected with a plasmid containing the Rluc gene and cells selected with G418 for 2 weeks. A, Total RNA was isolated from HCT-15 cells and HCT-15/Rluc cells, and the Rluc gene was amplified as determined by RT-PCR analysis. B, After selection, various numbers of HCT-15/Rluc cells were plated onto 24-well plates and cells were imaged with an in vivo imaging system. The total photon efflux was quantified using region of interest (ROI) analysis. Bars represent means ± SD. GAPDH = glyceraldehyde 3-phosphate dehydrogenase.
Effect of Cyclosporine on the Reversal of MDR1 in HCT-15/Rluc Cells
To determine the feasibility of the established cancer cell line (HCT-15/Rluc) for the assessment of multidrug resistance activity, intact HCT-15/Rluc cancer cells were treated with 5 μM cyclosporine. As shown in Figure 2, bioluminescence signals were 2.8-fold higher in cyclosporine-treated HCT-15/Rluc cells than in nontreated HCT-15/Rluc cells (p < .05).

Reversal of function of MDR1 by cyclosporine. A, HCT-15/Rluc cells were plated onto 96-well plates. Twenty-four hours later, HCT-15 Rluc cells were treated with cyclosporine (5 μM) for 15 minutes and the Rluc activity of intact HCT-15/Rluc cells was assessed (at 7 minutes after the addition of coelenterazine) using a luminometer. Experiments were performed in triplicate. Bars represent means ± SD. *Statistically significant.
Reversal of MDR1 by Ad-shMDR1
Fluorescent microscopy and an Rluc assay demonstrated increased GFP gene expression and Rluc signals in intact HCT-15/Rluc cells in a virus dose-dependent manner (Figure 3, A and B). In particular, Rluc activity was 6.2fold higher for HCT-15/Rluc cells infected with 120 MOI of Ad-shMDR1 compared to nontreated HCT-15/Rluc cells (see Figure 3B; 140 ± 11 and 875 ± 14 RLU, nontreated HCT-15/Rluc cells, and HCT-15/Rluc cells infected with 120 MOI of Ad-shMDR1, respectively; p < .05). RT-PCR analysis revealed markedly decreased intensity of MDR1 messenger RNA in Ad-shMDR1-infected HCT-15/Rluc cells compared to noninfected HCT-15/Rluc cells (Figure 3C).

Functional inhibition of MDR1 by Ad-shMDR1. A and B, HCT-15/Rluc cells were plated onto 96-well plates and cells were infected with 0, 15, 30, 60, and 120 multiplicity of infection (MOI) of Ad-shMDR1 (recombinant adenovirus that coexpressed MDR1 shRNA and green fluorescent protein [GFP]). Two days later, GFP expression and Rluc activity of intact HCT-15/Rluc cells were analyzed using a fluorescent microscope and a luminometer, respectively. C, HCT-15/Rluc cells were infected with 100 MOI of Ad-shMDR1 and incubated for 2 days. The level of MDR1 messenger RNA was determined using RT-PCR analysis. Experiments were performed in triplicate. Bars represent means ± SD. *Statistically significant compared to mock infection (0 MOI). GAPDH = glyceraldehyde 3-phosphate dehydrogenase.
In Vivo Bioluminescent Imaging of Reversal of MDR1 by Ad-shMDR1 Infection
Animal experiment was performed to investigate the silencing effect of MDR1 gene by Ad-shMDR1 using renilla luciferase reporter gene (Figure 4A). As shown in Figure 4, B and C, in vivo bioluminescent imaging demonstrated about 7.5fold higher signals in Ad-shMDR1-treated tumors (4.7 X 10⁵ ± 9.0 X 10⁴ vs 3.71 X 10⁶ ± 1.0 X 10⁶, before vs after Ad-MDR1 injection; p < .05) than those in PBS-treated tumors (5.82 X 10⁵ ± 9.2 X 10⁴ vs 8.84 X 10⁵ ± 1.0 X 10⁵, before vs after PBS injection; p = not significant).
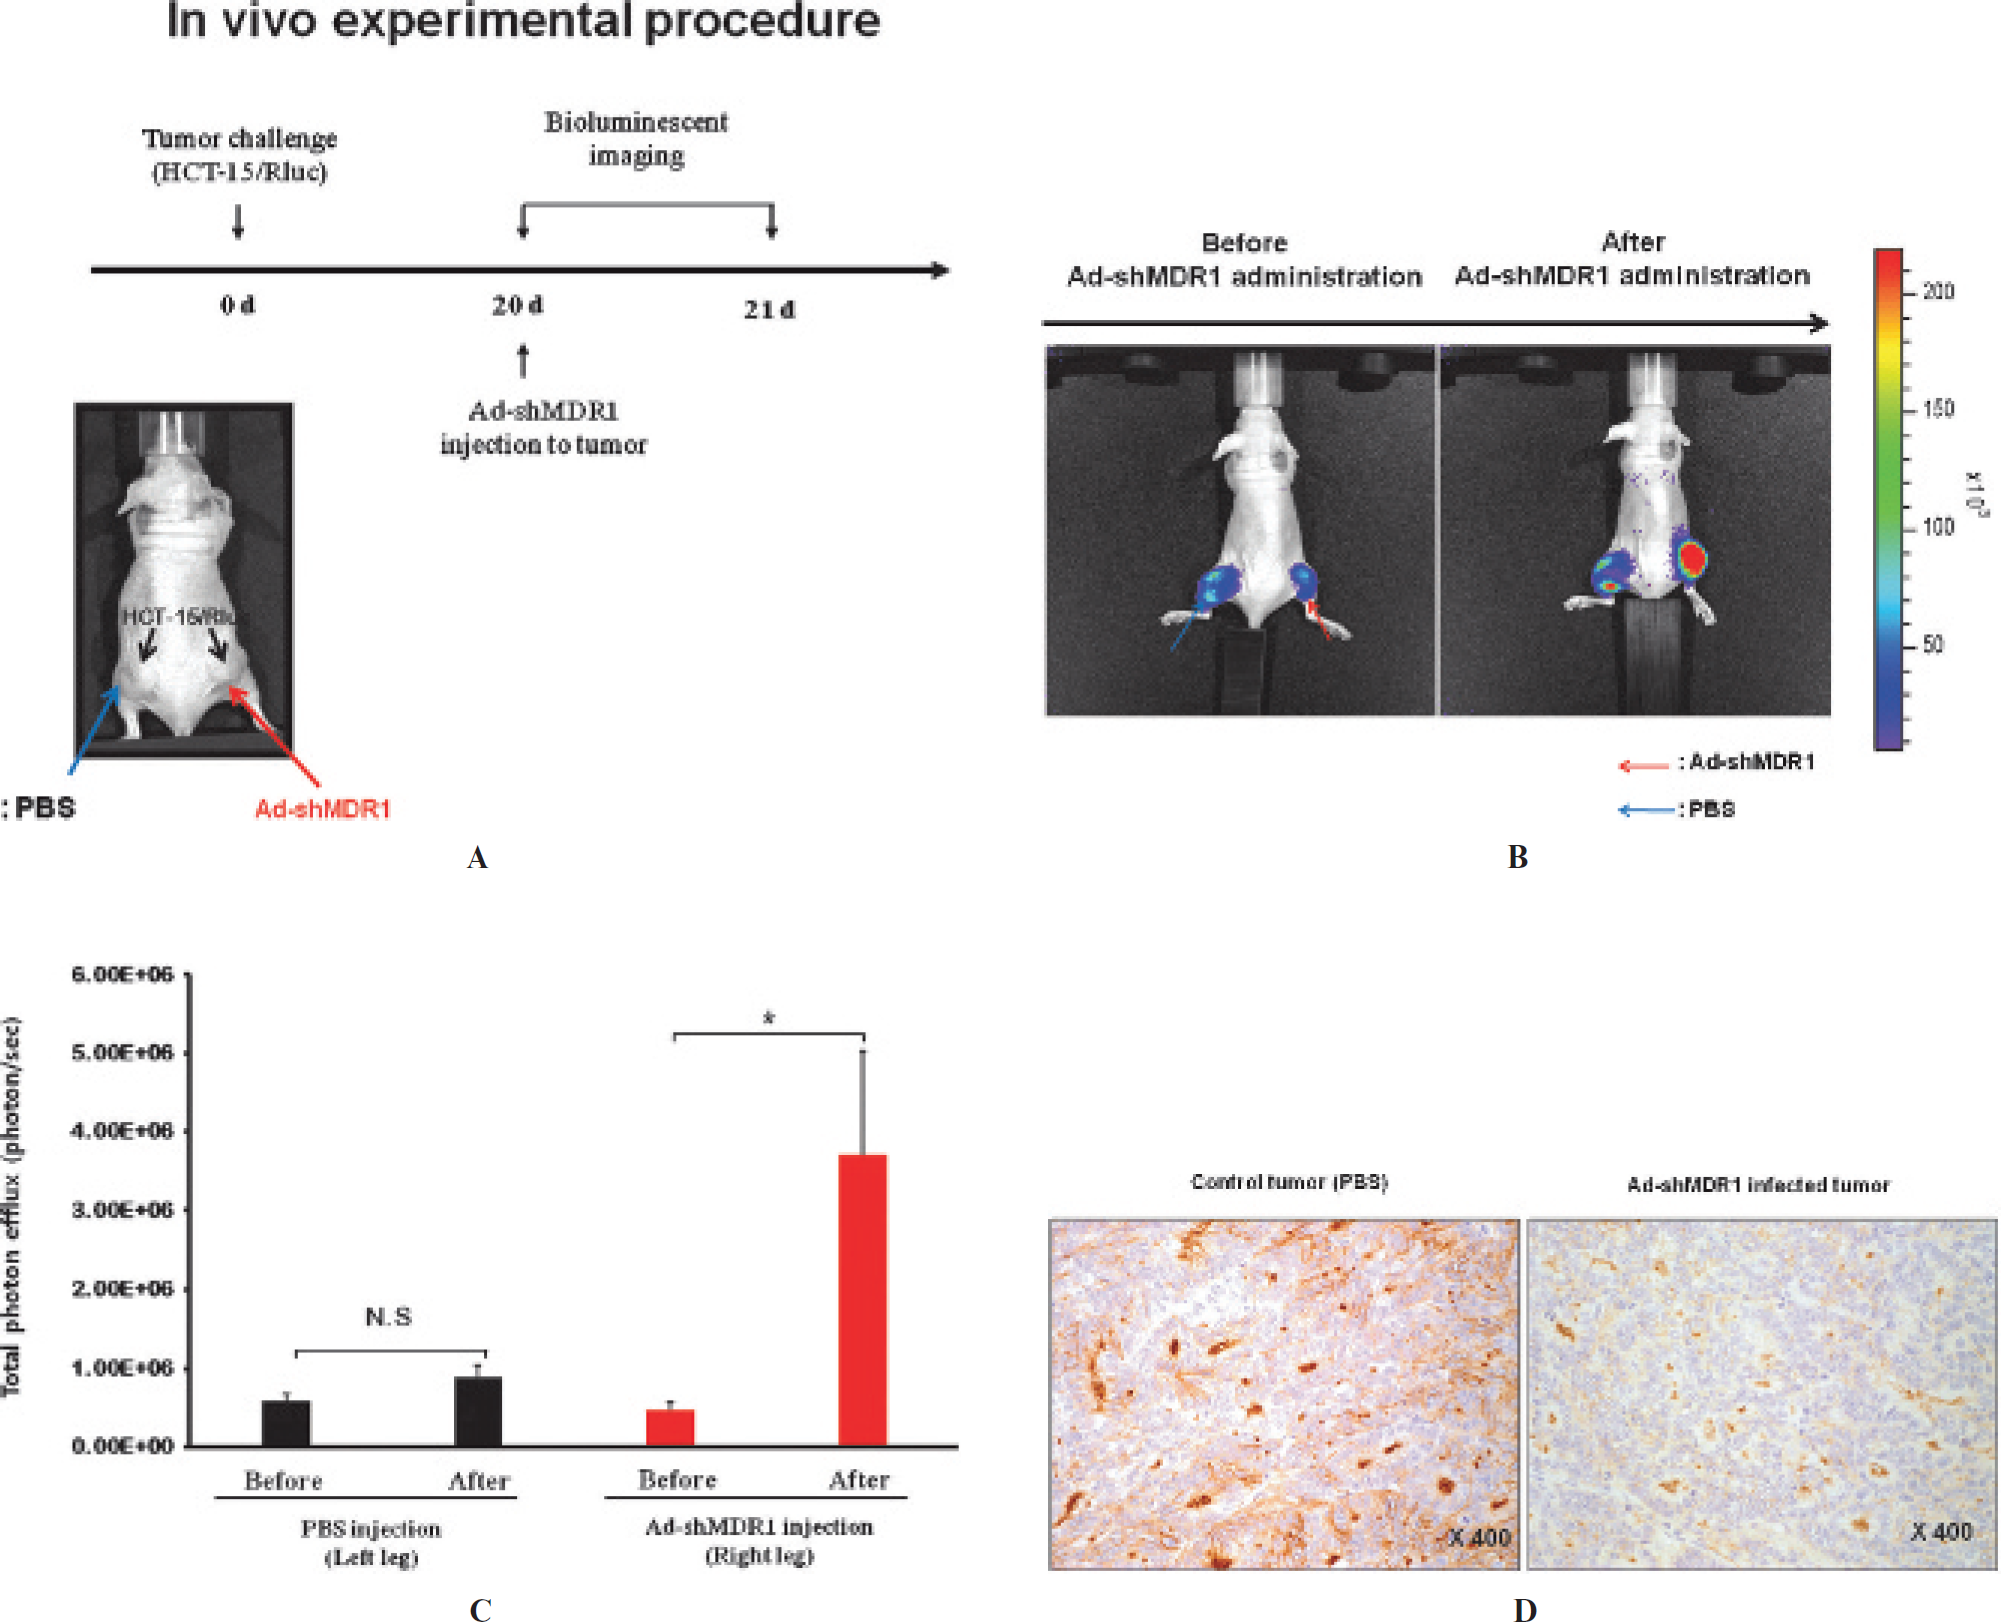
In vivo bioluminescent imaging of reversal effects of MDR1 by Ad-shMDR1. A, HCT-15/Rluc cells were implanted into both thighs of mice. Following establishment of the tumor model, bioluminescent imaging was performed prior to Ad-shMDR1 injection. Subsequently, PBS and Ad-shMDR1 were injected into left and right tumors, respectively. After 24 hours, bioluminescent imaging was performed and the intensity of Rluc signals was quantified using ROI analysis. B, In vivo bioluminescent imaging of reversal of MDR1 by Ad-shMDR1. Red arrows indicate the injection site of Ad-shMDR1. Blue arrows indicate the injection site of PBS. C, Quantification of Rluc signals in tumor regions was performed. D, In the left panel, Pgp expression for nontreated tumors is seen with diffuse positivity in most of the cancer cells and shows a strong cytoplasmic membranous pattern (X400 original magnification). In the right panel, for treated tumors, Pgp expression shows a patchy distribution and weak positivity for the cytoplasmic membranous pattern (X400 original magnification). Experiments were performed in triplicate. N = 5 mice. Bars represent means ± SD. NS = not significant. *Statistically significant.
Immunohistopathologic Analysis in Tumors Infected with Ad-shMDR1
The expression of Pgp was semiquantitatively assessed by the percentage of Pgp-positive cells per total cells (1+ = < 25%, 2 + = 25–50% and 3+ = > 50% positive cells). For noninfected cells, Pgp expression was diffuse with strong positivity (3+) in cancer cells and a mostly strong cytoplasmic membranous pattern (Figure 4D, left panel). For infected cells, patchy distribution (1+) of Pgp expression was observed, with a weak positivity for the cytoplasmic membranous pattern (Figure 4D, right panel).
Discussion
Given that expression of Pgp in cancer cells has a key role in the success of cancer chemotherapy, it is important to determine the expression level of MDR1 in vivo in drug-resistant cancer cells prior to chemotherapy. To overcome chemotherapy failure induced by MDR1/Pgp, the development of new strategies is required to overcome drug resistance. Recently, gene therapy mediated with RNAi has demonstrated the ability to knock down the specific gene of interest in living animal models. In particular, some investigators have reported on the successful reversal of drug resistance in MDR cancer models in vitro and in vivo using adenovirus- or lentivirus-expressing shRNA for MDR1.3,8,9
Although previous studies have shown the therapeutic potential of the use of adenovirus systems that can modulate multidrug resistance, the studies were not able to monitor the modulation effects induced by MDR1 shRNA virus in a living animal model, noninvasively and repetitively. Serial imaging could be performed in living organisms for further applications of MDR1 shRNA virus in clinical models. Several researchers have attempted to develop appropriate methods for determination of the level of MDR1/Pgp expression in drug-resistant cancer cells, especially with the use of in vivo imaging.10–12
Radiolabeled substrates for MDR1/Pgp, such as C-11 methionine, C-11 verapamil, and Tc-99m MIBI, have already been used as a tracer for noninvasive imaging of MDR1/Pgp in living organisms.12,13 However, these substrates can be used only in a laboratory equipped with nuclear medicine instrumentation such as single-photon emission computed tomography (SPECT) or positron emission tomography (PET), and clinical applications of nuclear imaging are also limited by the availability of radiolabeled substrates. Furthermore, these nuclear tracers have shown higher uptake in normal organs, especially in liver and kidney, and high background activity, not allowing tumor localization near to these organs. Therefore, alternative imaging modalities have been required that can be easily performed and have lower background activity in normal organs to observe the function of MDR1/Pgp in certain cancers in the preclinical setting.
Previous studies have shown the potential of bioluminescent imaging (using Renilla luciferase and coelenterazine) to visualize the function of MDR1 in drug-resistant cancer cells. 6 Coelenterazine as a substrate of Renilla luciferase has the physicochemical features of many natural substrates of the adenosine triphosphate (ATP)-dependent transporter superfamily that includes MDR1/Pgp. Thus, bioluminescent imaging using Renilla luciferase and coelenterazine may be a useful tool to evaluate the efficacy of not only adenovirus- (or lentivirus) expressing MDR1 shRNA but also chemical compounds that modulate the function of Pgp in living organisms.
To evaluate the feasibility of Renilla luciferase and coelenterazine system for a new strategy (use of an adenovirus system expressing MDR1 shRNA) to reverse multidrug resistance, we established a stable human colon cancer cell line (HCT-15/Rluc) that expressed the Rluc gene. Modulation of multidrug resistance by cyclosporine, a well-known MDR1/Pgp modulator, was confirmed in stable HCT-15/Rluc cells, suggesting that HCT-15/Rluc cells would be eligible for this purpose (see Figure 2). Several Pgp modulators, including cyclosporine, PSC 833, and GF120918, were known to be effective in the reversal of MDR1/Pgp in multidrug-resistant tumors. 6 In our study, Rluc assay and fluorescent microscopy demonstrated that an adenovirus expressing MDR1 shRNA and GFP reversed the function of MDR1 effectively in intact stable transfectants in our study (see Figure 3). In vivo imaging data clearly showed increased tumoral uptake of coelenterazine, suggesting the reversal of MDR1 after Ad-shMDR1 infection in a living mouse colon cancer model (see Figure 4, B and C). Histopathologic analysis also supported findings compatible with the successful suppression of Pgp expression in Ad-shMDR1-infected tumors (see Figure 4D).
In conclusion, we successfully verified the reversal of MDR1/Pgp after infection with an adenovirus that expresses MDR1 shRNA with bioluminescence imaging and the use of coelenterazine in a living mouse cancer model. These findings suggest that the Rluc imaging system can be diversely used as a noninvasive imaging tool to investigate the modulation of multidrug resistance either by shRNA for the MDR1 gene or by treatment of cells with various chemical agents that affect multidrug-resistant cancer.
Footnotes
Acknowledgment
Financial disclosure of authors: This work was supported by the Korea Healthcare Technology R&D Project, Ministry for Health, Welfare & Family Affairs, Republic of Korea (A081032-0902-0000100) and BK21 (2009).
Financial disclosure of reviewers: None reported.