
Abstract
Positron emission tomography-computed tomography (PET-CT) is superior compared to stand-alone PET in evaluation of malignancies. Few studies have employed high-resolution structural information to correct PET. We designed a semiautomatic algorithm using CT and PET to obtain a partial volume corrected (PVC) standardized uptake value (SUV) and a combined morphologic and functional parameter (multimodal SUV) for lymph node assessment. Lesions were segmented by a semiautomatic algorithm in CT images. Lesion volume was used for PVC and for calculating the multimodal SUV. The method was applied to 47 lymph nodes (30 patients) characterized as suspicious in 18F-fluorodeoxyglucose-PET-CT. In phantoms, PVC improved significantly the measured uptake of the lesion. In patients, 36 lymph nodes could be segmented without problems; in 11 lesions, a manual interaction was necessary. SUVs before PVC (mean 1.29) increased significantly (p < .0005) after PVC (mean 2.8). If SUV 2.5 was used as a threshold value to distinguish between benign and malignant lesions, 11 of the 47 lesions changed from benign to malignant after the PVC. The mean multimodal SUV was 0.39 mL for the benign lesions and 4.47 mL for the malignant lesions. In this work we presented a method for quantitative analysis of lymph nodes in PET-CT. PVC leads to significant differences in SUV.
The standardized uptake value (SUV) is the most frequently used parameter for semiquantitative assessment of PET images. The SUV is the ratio between activity concentration in a region of interest (ROI) and the injected activity normalized to, for example, the body weight or body surface of the patient. 6 Frequently, the maximum SUV within the lesion or the average SUV within a ROI with a fixed size is used. 7 For 18F-fluorodeoxyglucose-PET (FDG-PET), an SUV threshold of 2.5 is widely used to separate between benign and malignant tracer uptake.8,9
When a maximum SUV or an average SUV within a region with fixed size is used, the total tumor activity is not taken into account and, especially for therapy, monitoring changes of lesion size cannot be addressed. Therefore, in 1999, Larson and colleagues used total lesion glycolysis (TLG) as a parameter that takes the size of the lesion and its total metabolic activity into account. 10 In the work of Larson and colleagues, TLG is calculated as the product of the lesion volume as defined by FDG-PET and the average SUV in this volume. A similar strategy was applied by Roedl and colleagues, multiplying the tumor diameter by the mean SUV. 11 The drawback of these methods is that the estimation of the lesion size from PET data is very challenging, especially in small lesions when PET data are influenced owing to partial volume effects. A large number of studies are currently being performed addressing the problem of tumor volume delineation in PET data for application in radiotherapy treatment planning.12,13
One important advantage of combined PET-CT is that CT provides a high-resolution morphologic image in which the size of the lesion can be measured precisely. Consequently, a CT-based determination of the lesion size used to calculate the TLG will help avoid problems with lesion volume definition in PET. The average SUV for the lesion can also be measured within the lesion borders found in CT.
If the lesion is small (< 2 cm) compared to the spatial resolution of the scanner, partial volume effects are likely to occur.14,15 Owing to the finite spatial resolution of the scanner, image blurring is induced so that the image of small structures is larger and shows a reduced uptake owing to “spillout.” This problem appears regularly in the analysis of lymph nodes, which are often below 2 cm in diameter. In these cases, partial volume effects cause false-negative results and so reduce the sensitivity of PET. The partial volume effect depends not only on the size of the lesion of interest but also on the background activity because activity from the neighboring background can “spill into” the voxels of the lesion. To correct for partial volume effects, different approaches are made. The most widely used one is recovery coefficients as correction factors, which are obtained by measuring phantoms with hot spheres of known size and known background. 16 The disadvantage of this method is that for each scanner, phantom measurements with different lesion to background concentrations have to be done and evaluated. Another method used by Hickeson and colleagues in 2002 assumes that the activity in a certain area around the lesion of interest after subtraction of the background must be added to the volume of the lesion itself. 17 Both methods have in common the notion that an exact determination of the size of the lesion is mandatory. Therefore, high-resolution CT data of multimodal imaging are very useful. In our study, partial volume correction was performed based on the method of Hickeson and colleagues, 17 but different from their approach, we applied partial volume correction in full three dimensions and with the advantage of combined PET-CT data. For validation of the partial volume correction, phantom experiments were performed.
For segmentation of the lymph node in the CT in this study, a region grow algorithm was used. Compared to most applications in CT, no fixed Hounsfield values were used as threshold criterion for the region grow, but a variable threshold based on the standard deviation in the already segmented volume was used. For validation, the segmentation algorithm was compared to manually segmented volumes of the lymph nodes.
The algorithm presented in this work combines a semiautomatic lymph node segmentation based on the CT images with a partial volume correction for the FDG uptake. The corrected uptake of the lesion combined with the lesion volume measured in the CT data is used to calculate the multimodal standardized uptake value (mmSUV) as a parameter including functional and morphologic information. In the application, the user selects the lymph node in the CT and obtains the value for the corrected mean uptake of the lymph node and its mmSUV. In this first study, we focused on the methodology and compared SUVs before and after the correction and possible changes in the diagnosis for the patient based on the widely used threshold of SUV 2.5.
Materials and Methods
Phantoms
For validation of the partial volume correction, phantom studies were performed using a torso-shaped Plexiglas phantom (PTW-Freiburg, Freiburg, Germany) with a total volume of 9,600 mL. In the phantom, fillable spheres with an inner diameter (volume) of 10 mm (0.52 mL), 13 mm (1.15 mL), 17 mm (2.57 mL), and 22 mm (5.58 mL) were placed. The main volume of the phantom was filled with FDG solution with different activity concentrations to simulate background. The activity concentrations of the background were chosen for three different measurments 1 to 10, 1 to 8, and 1 to 6 compared to the activity concentration in the spheres, which was about 30 kBq/mL.
Patients
In this study, 30 consecutive patients were included who were transferred to our department for initial staging or restaging with FDG-PET-CT and for whom one or more suspicious lymph nodes were observed in the image analysis. All patients gave written and informed consent for the PET and CT examination.
PET-CT Scanner
Data were acquired with the PET/CT Biograph TruePoint 64 scanner (Siemens Medical Solutions, Erlangen, Germany). The PET component of this tomograph consists of four detector rings, each with 48 block detectors of lutetium oxyorthosilicate (LSO), and is a three dimensions-only tomograph. The transverse field of view is 58.5 cm, whereas the axial field of view is extended to 21.6 cm (TrueV), leading to an 82% increase in efficiency compared to the previous design with three detector rings. The spatial resolution at the center of the field of view was measured as 4.4 mm. 18 The CT component of the tomograph is a 64-slice spiral CT with a 50 cm transverse field of view that can be extended to 70 cm by means of a fitting algorithm.
Data Acquisition
Patients fasted for at least 6 hours before the examination. The blood glucose level was measured for all patients, and the examination was canceled if it was higher than 160 mg/dL. About 90 minutes (range 57–123 minutes) after the injection of 322 to 558 MBq of FDG, depending on the patient's weight, the diagnostic CT examination (120 kV, 180 mA, pitch 1.2, using the dose reduction algorithm Caredose4D) was performed in venous phase 75 seconds after the intravenous injection of the contrast agent (Imeron 300, Bracco Imaging Deutschland GmbH, Konstanz, Germany). CT data were reconstructed in a 512 X 512 voxel matrix per slice with a slice thickness of 1 mm. After the CT acquisition, PET emission data were acquired, reconstruction into 168 to 168 voxel matrices was performed using the attenuation-weighted OSEM algorithm implemented by the manufacturer, and attenuation and scatter corrections were applied, both based on the CT data. Phantom data were acquired with the same acquisition and reconstruction parameters as the patient data. The acquired data were transferred to an external workstation for further processing.
Data Processing
Suspicious lymph nodes were selected in the CT data by one click in the center. The lymph node was then automatically segmented by a three-dimensional region grow algorithm: the region grow started with the voxel marked by the user plus six surrounding neighboring voxels. The segmented volume was then expanded in all three directions until all neighboring voxels were included whose Hounsfield units fell into the following interval:

where mean(HF) is the mean value of the Hounsfield units in the segmented volume and stdv(HF) is the standard deviation of the Hounsfield values in this volume.
Then the segmented volume was displayed in the CT data and, if necessary, the possibility of manually adjusting the segmented volume was provided by changing the multiplier m in the region grow algorithm by a slider.
To validate the segmentation algorithm, all lesions were manually segmented on a TrueD workstation (Siemens Medical Solutions) by an experienced radiologist and volume was measured.
After the lymph node was segmented, volume (Vollymph node) and maximum diameter were calculated. Then the segmented volume was projected into the PET data. The mean uptake value in the corresponding PET voxels was measured (SUVmean). For the partial volume correction, two additional volumes surrounding the lymph node were created: Vol1 by extending the lymph node volume by 7 mm (approximately the PET spatial resolution) and Vol2, which is Vol1 extended by another 7 mm (Figure 1). In both cases, the extension of the volumes was done in all three dimensions. The background activity concentration (Abg) was measured as mean uptake in the voxels that belonged only to Vol2 but not to Vol1. Then the mean activity concentration (Amean) in Vol1 (including the segmented lymph node volume) was measured. By subtracting the background activity concentration from Amean in Vol1, multiplied by the volume of Vol1, the total activity within the lesion was determined. In the next step, this total lesion activity was divided by the volume of the lymph node (Vollymph node) measured in the CT. The obtained activity concentration was the partial volume corrected average activity concentration of the lymph node:


Supraclavicular lymph node (patient 2) overview (left). The segmented volume (yellow) is surrounded by Vol1 used for the partial volume correction and Vol2 (red) used for the estimation of the background activity.
If the background activity concentration was higher or equal compared to the mean uncorrected activity concentration in the lymph node, no partial volume correction was applied. To obtain the corrected standardized uptake value (SUVcorr), this corrected activity concentration was multiplied by the body weight of the patient and divided by the decay-corrected injected dose.
Finally, the mmSUV was calculated using the SUVcorr and the volume of the lymph node segmented in the CT:

For all analyzed lesions, the SUVmean and SUVcorr were compared and checked for a potential change in diagnosis using an SUV greater than 2.5 as the criterion for malignancy.
Complete data processing and analysis were done with in-house programmed software developed with IDL (Interactive Data Language, ITT Visual Information Solution, Boulder, CO).
Results
In the phantom studies, the average measured activity concentration in the spheres was 16.5 kBq/mL without partial volume correction and increased significantly (p < .0001) to 28.3 kBq/mL after the correction when averaged over all measurements (different lesion to background ratios and sphere size). Hence, the error for the measured activity concentration compared to the activity concentration filled into the spheres (30 kBq/mL) reduced from 45% to 6%, and, on average, the real activity concentration was reproduced up to 94%. For the smallest sphere, the increase was strongest from 10.7 to 25.9 kBq/mL (average over the measurements with the different signal to background ratios), whereas for the largest sphere, the mean activity concentration increased from 21.6 to 29.2 kBq/mL. The average over the three different lesion to background ratios can be seen in Figure 2.
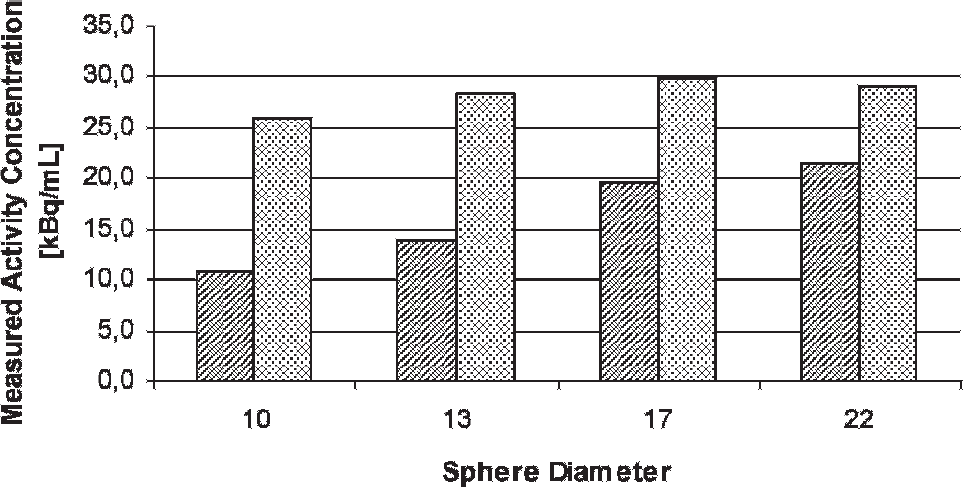
Results of the partial volume correction applied to the phantom studies. The bars show the measured mean activity concentration in the spheres of the different diameters (10, 13, 17, and 22 mm) before (lined bars) and after the partial volume correction (dotted bars). The values are the averaged values of the three experiments with different lesion to background ratios (1 to 10, 1 to 8, and 1 to 6). The activity concentration filled into the lesions was 30 kBq/mL.
In total, 47 lesions in 30 patients were analyzed (Table 1). The semiautomatic segmentation of lymph node volumes showed optimum results in 36 lesions; in 11 lesions, a manual adjustment was necessary: for 2 cervical lesions that were closely attached to other structures with similar density; in one case, the thyroid gland, which was located directly adjacent to the lymph node; for 5 lesions located in the mediastinum with structures with similar density close by, including other lymph nodes; and for four para-aortic lesions in the abdomen close to other structures with similar CT density. Manual adjustment did not take more than 30 seconds for any of the cases.
Analyzed Lymph Nodes, SUVs before and after Partial Volume Correction, Multimodal SUV, Diameter and Volume Determined in CT Data by Segmentation, and Volume Determined by Manual Segmentation

CT = computed tomography; mmSUV = multimodal standardized uptake value; SUV = standardized uptake value; SUVcorr = standardized uptake value after partial volume correction; SUVmean = standardized uptake value before partial volume correction. In case of lesions marked with an asterisk, manual interaction was necessary in the segmentation step.
Semiautomatically segmented volumes were compared to the manually segmented volumes (see Table 1). The mean difference was 11%. There was no significant difference between manual and semiautomatic segmentation (p > .05 with paired t-test).
The SUVs before correction (mean 1.29, range 0.1–4.0) were significantly (p < .0005 with paired t-test) different from the SUVs after the partial volume correction (mean 2.8, range 0.1–13.5). Two examples can be found in Figure 3. The values for each lesion can be found in Table 1. In 19 of the 47 lesions, the SUV was increased by more than 100% after the partial volume correction; in 3 lesions, the increase ranged between 0 and 100%, and in 25 cases, our algorithm did not lead to a change in the SUV. If a threshold of SUV 2.5 for decision making between benign and malignant lesions was applied, for 11 of the 47 lesions (23.4%), the staging changed from benign to malignant owing to the partial volume correction. Before the correction, the SUVmean was 1.10 (SD 0.72) for benign lesions and 3.33 (SD 0.54) for malignant lesions. After the correction, SUVcorr was 0.96 (SD 0.64) and 6.34 (SD 2.86) for the benign and malignant lesions, respectively.
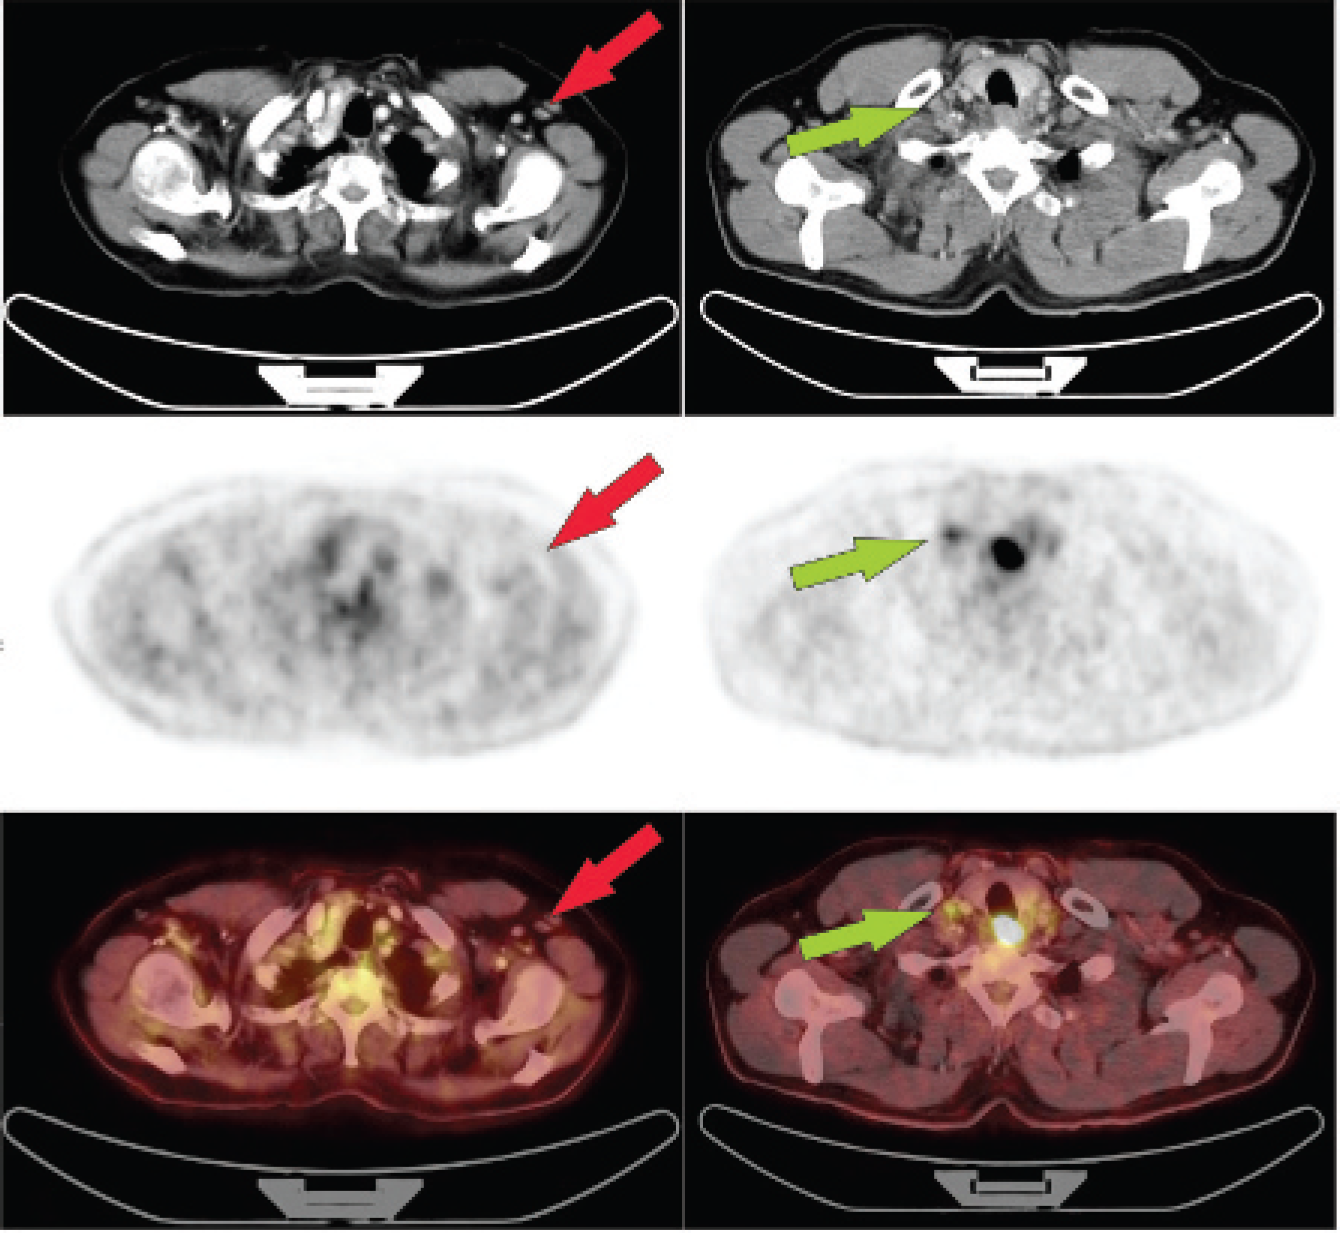
Left side: Example (patient 1) of a lymph node (red arrow) for which the partial volume correction did not change the SUVs. The patient is a 62-year-old woman with mammary carcinoma 4 years ago. The results of the algorithm were SUVcorr = 0.2 and mmSUV = 0.08 mL; the lesion was classified as an unspecific enlarged lymph node. Right side: Patient with carcinoma of the cervical esophagus (patient 8). A lymph node close to the primary tumor (green arrow) showed enhanced FDG uptake; the SUVmean was 1.4 before the partial volume correction, and after it, SUVcorr = 5.6.
The mean mmSUV measured (SUV 2.5 criteria) was 0.39 ± 0.53 cm3 for the benign lesions and 4.47 ± 4.05 cm3 for the malignant lesions.
Discussion
It is known that the partial volume effect mainly depends on the size and signal to background ratio of the lesion. Whereas the latter can be obtained from the PET data, the size of the lesion is very difficult to measure in the PET images. In combined imaging, the lesion size can be obtained from the high-resolution CT data. Hickeson and colleagues used the approaches already without having combined PET-CT acquisitions; they measured the lesion size in separately acquired CT images and used this for partial volume correction. 17 Compared to the study by Hickeson and colleagues, we used PET-CT data, where PET and CT data are acquired sequentially within several minutes. Although this procedure considerably improves the alignment between the two data sets, there may still be a misalignment owing to patient or organ movement, for example, caused by respiratory movement in the lung or to bowel movement in the abdomen, which is a limitation of the algorithm.
Because of limited computational power, Hickeson and colleagues applied the correction algorithm only in one transaxial plane (the one with the highest uptake in the PET data and the one with the maximal lesion size in the CT). 17 In this study, the partial volume correction was done on the three-dimensional data set and not limited to one transaxial plane. Hence, not only the activity was taken into account, which spilled out of the lesion within one plane, but also the partial volume effects along the longitudinal axis. The method used for partial volume correction by Hickeson and colleagues 17 and in our study is based on the fact that no signal is lost owing to the partial volume effect. The activity uptake of the lesion is distributed only in a greater volume, as it should be. So the total activity of the lesion is determined within an extended volume around the lesion, which is delineated in the CT. As in this extended volume background activity is also present, the average background activity concentration must be determined too. Like Hickeson and colleagues, 17 we therefore used in our algorithm another volume around the already extended volume of the lesion, with a distance from the original lesion of about one to two times the spatial resolution of the PET scanner. With this information, we can determine the total activity uptake of the lesion and assign it to the lesion volume measured in the CT images. This method of partial volume correction has the advantage of being quite independent of the scanner; only the spatial resolution is used for deciding how to extend the lesion volume. The effect of the partial volume correction was tested in a phantom study with four different sphere sizes similar to the lymph nodes and three different lesion to background ratios. The phantom study showed a close correlation between the corrected measured activities and the true ones.
A limitation of this method is that a homogeneous radiotracer uptake in the lymph node is assumed. This should be true for small lesions, where the partial volume correction is important. Inhomogeneities such as central necrosis normally appear only in larger lymph node metastasis, where partial volume correction is not that important.
Another method of partial volume correction is the use of recovery coefficients. 16 These are correction factors that are obtained by phantom measurements taking into account different lesion volumes and signal to background ratios. The disadvantage is that the recovery coefficients are strongly dependent on the scanner type and even the reconstruction procedure and that a lot of phantom measurements have to be performed. Recently, Teo and colleagues introduced another method for correction of partial volume effects applied to phantom and oncologic patient data. 19 Their iterative postreconstruction method showed a good result and has the advantage of not requiring high-resolution imaging information. Several other methods, especially for application in brain PET, can be found in the literature. An overview can be found in the review by Rousset and colleagues. 20 A recently published study by Soret and colleagues showed the influence of different partial volume correction algorithms on the result in oncologic PET. 15 In the article by Soret and colleagues, it was found that corrected SUVs had only a small dependence on the method that is used for partial volume correction. 15
To estimate the size of the lymph node in CT data, a semiautomatic region grow algorithm is used. The volume found by this segmentation algorithm was compared to the volume measured by manual assessment. Also, in single cases, large differences were found, but there was no significant difference between the lymph node volumes obtained manually and the semiautomatic algorithm. In our implemented semiautomatic algorithm, the user can choose the lymph node of interest with one click. In our study population, we analyzed lymph nodes in various areas (eg, mediastinal, mesenterial, cervical, axillar), which showed that the algorithm can be applied for all of these locations. In 11 of the 47 lesions, manual adjustment of the segmentation was necessary in our interface. Most manual adjustments were necessary for the mediastinum, where various isodense structures can be found in close proximity. Although this manual interaction does not require more than 30 seconds for one lesion, an improvement in the semiautomatic segmentation might be of interest. New devices of combined PET and magnetic resonance imaging (MRI)21,22 may be helpful for that. Weissleder and colleagues showed the use of lymphotrophic nanoparticle-enhanced MRI for assessing lymph nodes.23,24 Using combined PET-MRI with enhanced contrast for lymph nodes, the segmentation may be improved and manual interaction may therefore become unnecessary. By an additional quantification of the nanoparticle uptake in the lymph node, further information about a potential malignancy can be obtained. 24 Using combined PET-MRI devices may also solve the issue of misalignment between functional and morphologic imaging as some concepts of these devices will allow simultaneous data acquisition. 22
One limitation of the lymph node segmentation in CT data is that contrast-enhanced diagnostic CT using intravenous contrast medium is mandatory. So-called “low-dose CTs,” which are acquired only for attenuation correction and rough anatomic allocation of PET findings, do not provide sufficient contrast of lymph nodes for the segmentation.
We found that the partial volume correction implemented in our semiautomatic algorithm increased the average SUV of the lymph nodes in 19 of 47 cases by more than 100% and up to a factor of 4.7 in one case. The greatest differences in the change in the lesion uptake owing to partial volume correction can be explained first with the different lesion size. This was also found in the phantom experiment, where the smallest lesions had the highest increase in uptake. But the lesion uptake and the background uptake are also important. If there is no uptake in the lesion, there can also be no spillout owing to partial volume effects, and, hence, there is no additional activity in the surrounding background that can be assigned to the lesion by our correction algorithm.
The increase in the SUV would have led to a change of state from benign to malignant in 11 (23.4%) cases if a threshold of SUV 2.5 was applied to the mean SUVs of the lymph nodes. This SUV of 2.5 was widely accepted as the threshold for separating benign and malignant lesions.8,9 Problems appear as the threshold was established in larger lesions with negligible partial volume effect. Thus, the treshold would need to be adapted for smaller lesions in which the partial volume effect is significant. In case a partial volume correction valid in this small lesion is applied, the threshold can be kept at 2.5. This was the approach taken in our study. We used the same threshold for uncorrected and corrected SUVs because we were interested in the number of lesions categorized differently depending on the partial volume correction. Of course, a fixed SUV threshold for differentiation between malignant and benign lesions can be controversial. It may well be that the threshold also depends on the tumor entity in question. As our study was a feasibility study for the semiautomatic algorithm, we included consecutive patients, whether or not we had histopathologic findings or follow-up information. Hence, it was beyond the scope of this study to analyze how the sensitivity and specificity were influenced using our algorithm and whether an SUV of 2.5 is the optimal threshold or which threshold might be applicable for the corrected SUV. The definition of optimal thresholds appropriate for different tumor entities will be part of further prospective studies. But glancing at the results of Hickeson and colleagues, who reported an improved differentiation of malignant from benign lesions with diameters smaller than 2 cm, 17 the described algorithm should lead to a similar improvement, especially as the partial volume correction is done not only in one plane but in full three dimensions, as discussed before.
Another advantage of our quantification method is that an averaged SUV is determined, which is less influenced by statistical noise than the maximum uptake corrected for partial volume effects used in other studies. 25 The uncorrected SUV measured for comparison is also determined as the average value within the volume of the lesion defined by CT. An averaged SUV was suggested by Weber and colleagues in 1999. 26 They used a circular ROI with a fixed size that was placed manually around the voxel of maximum activity concentration. With this method, the ROI might not include the whole lesion or might include voxels that are not part of the lesion. Additionally, a bias may appear owing to the fact that different users may place the region in different ways. Compared to this, the maximum SUV has the advantage of being independent of a user, which justifies the fact that it is still widely used. In our case, the mean SUV is also less user independent because the volume in which it is determined is segmented by the region grow algorithm.
Partial volume correction can reduce the number of false-negative results as the uptake values are increased; however, it cannot reduce false-positive results or may even increase their number. False-positive results are caused by the low specificity of FDG. Inflammatory processes also lead to increased FDG uptake, for example, in tuberculosis, 27 or invasive aspergillosis, as was the case for patient 5. The SUV is a semiquantitative measure and is obtained from an acquisition over some minutes at one certain point of time and does not give the opportunity to distinguish between inflammatory processes and malignancies. But if the dynamic of the FDG metabolism is taken into account, it is possible to improve such a differentiation. 28 Also, using not a full dynamic acquisition but a shortened one such as dual-time point imaging may reduce the number of false-positive findings. Several studies investigated the application of dual-time point FDG-PET-CT; they showed promising results for improving specificity29,30 and give the possibility of separating inflammatory processes from malignancies. The presented algorithm can easily be extended to include PET acquisitions of more time points. As the lesion volume is segmented in the CT data, it can be projected to several PET data sets, and automatic data analysis can be performed. This will be part of further studies.
In addition to the use of lesion volume measured in morphologic imaging modalities for partial volume correction, our algorithm gives the opportunity to calculate combined volumetric and metabolic parameters. Several years ago, Larson and colleagues used TLG as an index for assessment of therapy response. 10 For lesion volume definition, Larson and colleagues used only the PET data, leading to the problems discussed before. Another combination of lesion size and uptake is the “diameter-SUV” index (tumor diameter multiplied by the mean SUV), which was found by Roedl and colleagues to have the highest accuracy in predicting disease-free survival after neoadjuvant chemotherapy in a study including 49 patients with esophageal squamous cell carcinoma. 11 On the other hand, Benz and colleagues found the combined parameters to be less accurate in predicting tumor response than the SUVs alone for soft tissue sarcomas. 31 Consequently, the optimal parameter depends on the tumor entity and must therefore be investigated in further studies for different types of malignancies. In our algorithm, we used the lesion volume measured semiautomatically in CT and the mean partial volume corrected SUV in this volume to calculate a parameter that we called mmSUV. This parameter is concordant with the TLG introduced by Larson and colleagues 10 but we decided to introduce the new name as the SUV is only a semiquantitative parameter and does not necessarily represent the glycolysis rate and because the partial volume correction is included.
Especially for therapy monitoring, the mmSUV measured with the proposed algorithm prevents interobserver variability, which is often a problem in such studies and gives the opportunity for a high standardization that up to now has been established only for lymphoma. 32 Such standardization will be of special interest for further multicenter trials. Both the SUVcorr and the mmSUV may be potential predictive parameters for early therapy assessment. The mmSUV as a combination of lesion size and glucose metabolism is a particularly promising parameter.
Conclusion
We demonstrated the feasibility of a semiautomatic algorithm for quantification of suspicious lymph nodes in combined PET-CT. We used the advantages of combined functional and morphologic imaging to improve the quantification of the PET data and to determine a combined parameter, the mmSUV. The increase in the uptake signal was significant owing to the partial volume correction implemented in the algorithm, up to a factor of 4.7 in one case. Therefore, partial volume correction is essential for small structures such as lymph nodes. How far this improved signal can reduce false-negative results in PET must be shown in future prospective studies with correlation to histopathologic findings. But the results of Hickeson and colleagues showed that partial volume correction will improve the sensitivity of PET for small lesions, whereas semiautomatic volume segmentation will reduce interobserver variability and lead to a more standardized method of data analysis. 17 Hence, the algorithm described is an optimal basis for further studies using PET-CT for staging or therapy monitoring.
Footnotes
Acknowledgments
We acknowledge the excellent technical assistance of Brigitte Dzewas, Helga Fernolendt, Coletta Kruschke, and Anna Winter from the PET-CT staff. We are grateful to Marianne Angelberger for editorial assistance.
Financial disclosure of authors: This work was supported in part by a research grant from Siemens Medical Solutions, Erlangen, Germany.
Financial disclosure of reviewers: None reported.