
Abstract
The objective of this study was to quantify enzymatic activity on the surface of T cells by magnetic resonance imaging (MRI) using R2 and R2* relaxometry. Lymphoma cells expressing adenosine diphosphate (ADP)-ribosyltransferase 2 (ART2) were incubated with increasing doses of its substrate etheno–nicotinamide adenine dinucleotide (NAD), resulting in increasing amounts of surface protein ADP-ribosylation. Etheno-ADP-ribosylated proteins were detected with monoclonal antibody 1G4 and superparamagnetic iron oxide conjugated secondary antibodies (Ab-SPIO). Labeling efficiency was determined with R2 and R2* relaxometry on a clinical 3.0 T scanner. Parallel aliquots of cells were analyzed by flow cytometry. Cell-bound SPIO conjugates were detected by immunofluorescence and electron microscopy and quantified by atomic absorption spectroscopy. To mimic an inflammatory site in vivo, Ab-SPIO-labeled cells were injected subcutaneously in mice and analyzed by MRI. Immunofluorescence and electron microscopy confirmed cell-surface localization of Ab-SPIO. MRI of Ab-SPIO-labeled cells showed a corresponding signal reduction. Increases in R2 and R2* determined by magnetic resonance relaxometry correlated linearly with the expression level of ART2 and the concentration of the ART2 substrate etheno-NAD. R2 and R2* increases correlated linearly with the results from flow cytometry and atomic absorption spectroscopy analyses. Quantitative R2 and R2* mapping enable noninvasive determination of enzymatic activity on T cells and holds promise for characterization of inflammatory sites in vivo by MRI.
In vivo applications of SPIO-conjugated antibodies may be hampered by inefficient delivery to the target site owing to the large molecular size of the conjugates. 2 However, inflammatory sites, characterized by increased vascular permeability, have been successfully imaged in vivo by MRI after intravenous application of SPIO-conjugated antibodies.13,14 We report the use adenosine disphosphate (ADP)-ribosyltransferase 2 (ART2) as a model antigen for MRI of enzymatic activity on T cells to characterize inflammatory sites in vivo. Toxin-related ART2 is an ectoenzyme expressed on murine T cells that catalyzes the transfer of ADP-ribose groups from nicotinamide adenine dinucleotide (NAD) onto target proteins on the cell surface.15–20 The substrate NAD is released at sites of inflammation from lysed cells.21–23 The subsequent ART2-catalyzed ADP-ribosylation of cell-surface proteins alters T-cell functions24–27 and can even induce apoptosis of T cells. 20 Activity of ART2 can be monitored by flow cytometry using the NAD analogue etheno-NAD as substrate and ethenoadenosine-specific monoclonal antibody 1G4 for detecting etheno-ADP-ribosylated proteins on the T-cell surface.16,28
For clinical and experimental applications, a reliable method for titrating the expression level of a specific protein on the cell surface would be desirable. This would allow an estimation of the minimal amount of receptors required for sufficient signal change for imaging and determination of the maximal possible achievable signal with a given SPIO conjugate. The purpose of our study was to prospectively determine and quantify ART2-mediated SPIO-labeling efficiency of T cells by using R2 and R2* mapping.
Material and Methods
Cells and Cell Culture
Untransfected DC27.10, ART2-transfected DC27.10, 16 and endogenously ART2-expressing MD27 mouse lymphoma cells were cultured at 37°C/5% CO2 in RPMI medium supplemented with 10% fetal bovine serum. Cell lines were kindly provided by Dr. Bernhard Fleischer (Hamburg, Germany).
Detection of ART2 and Etheno-ADP-Ribosylated Cell-Surface Proteins
Cells were incubated with 2 μM etheno-NAD, concentrations as indicated, or without etheno-NAD in RPMI medium at 37°C for 20 minutes, washed, and stained with antiethenoadenosine monoclonal antibody 1G4 (mouse IgG1, kindly provided by R. Santella, New York) 28 or anti-ART2 monoclonal antibody Nika102 (rat IgG2a) 18 for 20 minutes at 4°C. Cells were washed twice in phosphate-buffered saline (PBS) prior to magnetic or fluorescence labeling. Anti-ART4 monoclonal antibody B63 (rat IgG2a) was used as an isotype control for ART2 expression analysis experiments.
Flow Cytometry
Antibody-stained cells (1 × 10 6 ) were washed twice and incubated for 20 minutes with antimouse IgG or antirat IgG fluorescein isothiocyanate (FITC)-conjugated secondary antibodies (Dianova, Hamburg, Germany). Flow cytometry was performed with a FACSCalibur using CellQuest Pro software (Becton Dickinson, Heidelberg, Germany). Dead cells were excluded from analysis by staining with propidium iodide.
Magnetic Cell Labeling
Antibody-stained cells (2 × 10 7 ) were incubated for 20 minutes with antimouse IgG or antirat IgG SPIO-conjugated secondary antibodies (Ab-SPIO) (Microbeads, Miltenyi Biotec, Bergisch Gladbach, Germany). The hydrodynamic diameter of dextran-coated SPIO is approximately 50 nm.
Fluorescence Microscopy
Cells (1 × 10 6 ) labeled with 1G4 antibody and secondary SPIO conjugates were incubated with FITC-conjugated antidextran antibody (StemCell Technologies Inc, Vancouver, BC) for 20 minutes, washed twice, and fixed with 2% paraformaldehyde. Nuclei were counterstained with Hoechst 33342 for 10 minutes at room temperature. Cells were centrifuged onto microscope slides using a cytospin centrifuge and mounted in fluorescence mounting medium (DAKO, Hamburg, Germany). Cells were visualized using a Zeiss Axiovert microscope (Jena, Germany) with a 100× oil-immersion objective lens (numerical aperture 1.25), and images were captured using AxioVision software (Zeiss).
Transmission Electron Microscopy
Cells (2 × 10 7 ) labeled with 1G4 and SPIO conjugates were drawn into Carbocell microtubes by capillary action, washed in PBS, and fixed with 2.5% glutaraldehyde in PBS for 30 minutes at room temperature. Subsequently, tubes were washed with PBS, postfixed for 30 minutes with 1% OsO4 in PBS, washed with ddH2O, and stained with 1% uranyl acetate in water. The samples were gradually dehydrated with ethanol and embedded in EPON resin for sectioning. Ultrathin sections of 50 to 70 nm were prepared using a Reichert-Jung Ultracut microtome (Reichert-Jung Optische Werke AG, Wien, Austria). The electron micrographs were obtained with a Gatan Multiscan 794 charge-coupled device camera (Model 794, Gatan Inc., Pleasanton, CA) attached to a Philips CM 120 transmission electron microscope (Eindhoven, Philips Inc., the Netherlands) at 80 kV.
Atomic Absorption Spectrometry
Cell-bound iron was quantified by atomic absorption spectrometry (AAS) with a Perkin Elmer spectrophotometer 2100 (Norwalk, CT) using the device-specific software AAWinLab. The iron content of a dilution of 1 × 10 7 cells was determined and the average iron content per cell was calculated (mean ± SD).
Cell Phantoms for In Vitro Imaging
Phantoms of cells (2 × 10 7 ) were prepared in 300 μL test tubes on a layer of 140 μL of 10% polyacrylamide gel. To obtain homogeneous gel surfaces, the polyacrylamide solution was covered by 70% ethanol during polymerization. Subsequently, ethanol was carefully removed and replaced by 160 μL of cell suspension. Cells were kept for 2 hours at 4°C for sedimentation.
In Vitro MRI and Magnetic Resonance Relaxometry
MRI was performed on a whole-body 3.0 T magnetic resonance (MR) scanner (Intera 3T, Philips, Best, the Netherlands). All measurements were conducted with a small-animal solenoid coil (Philips Research Laboratories, Hamburg, Germany). Test tubes were positioned in the coil using a custom-made rack of acrylic glass containing water at room temperature. A T2*-weighted multislice sequence in sagittal orientation was used for detailed plane positioning of axial T2 and T2* relaxometry sequences (Table 1). Image data of T2 and T2* relaxometry were analyzed using an interactive data language (IDL)-based software tool (RelaxFit, Philips Research Laboratories). The program employed a monoexponential fit to estimate T2 and T2* relaxation times and calculation of reciprocal R2 and R2* relaxation rates in a region of interest (50 ± 10 pixels) within the cell pellets. Results were presented graphically as T2 and T2* parametric maps.
In Vivo MRI and MR Relaxometry
BALB/c mice were obtained from Jackson Laboratories (Bar Harbor, ME). All mice were maintained under standard conditions in the animal quarter of the University Hospital Hamburg-Eppendorf. Experiments were performed according to European regulations. All investigated mice were male and their ages were between 10 and 12 weeks.
For in vivo experiments, BALB/c mice were anesthetized by means of intraperitoneal injection of ketamine (125 mg per kilogram of body weight) and xylazine (12.5 mg/kg). Ab-SPIO-labeled cells, with iron concentrations as indicated, were resuspended in 900 μL 0.2% agarose gel. For comparative analysis, corresponding amounts of free SPIO were also suspended in 900 μL agarose. One part (500 μL) was subcutaneously injected into the flanks of the mice, whereas the other part (400 μL) was transferred for control into test tubes and analyzed in vitro. MRI was performed within 5 minutes after injection. Anatomic details of the mice were visualized with a coronal T2-weighted MR sequence. An axial T2-weighted sequence was used for overlay with T2 and T2* parametric maps of the injection site acquired with axial relaxometry (see Table 1). Regions of interest (50 ± 10 pixels) were centered over the injected pellets to determine mean R2 and R2* values.
Detailed Parameters of the MRI Sequences Applied in the Experiments

FOV = field of view; MRI = magnetic resonance imaging; NA = not available; NSA = number of signal averages; RFOV = recalculated field of view; TE = echo time; TR = repetition time.
Statistical Analysis
All data are presented as mean values ± standard deviations. Linear correlation analyses were performed to compare the MR data with flow cytometry results and AAS measurements.
Results
ART2 Expression and ART2 Activity Analyses by Flow Cytometry and In Vitro MRI
Flow cytometry revealed an intermediate ART2 cell-surface expression level on MD27 cells that endogenously express ART2 and a high expression level on ART2-transfected DC27.10 cells (Figure 1A). Untransfected DC27.10 cells did not show any detectable ART2 expression. To test whether these differences in ART2 expression levels could also be quantified by MRI, Ab-SPIO-labeled cells were analyzed by R2 and R2* relaxometry (Figure 1B). T2*-weighted images showed clear signal reduction for MD27 cells and ART2-transfected DC27.10 cells but not in untransfected cells. These qualitative observations were confirmed by quantitative relaxometric measurements and visualized on T2 and T2* parametric maps (see Figure 1B).
Flow cytometry depicted intermediate and strong ART enzyme activity on MD27 cells and ART2-transfected cells (Figure 2A), corresponding to their level of ART2 expression (see Figure 1A). Untransfected cells did not show any detectable ART activity, consistent with the lack of ART2 expression on these cells (see Figure 2A). Comparable results were obtained with parallel MRI analyses of Ab-SPIO-labeled cells, confirming that ART2 enzyme activity can be visualized and quantified by MRI (Figure 2B).
Immunofluorescence and Electron Microscopy of Ab-SPIO-Labeled Cells
Immunofluorescence analysis confirmed Ab-SPIO localization on the surface of cells displaying ART2 activity (Figure 3). Cells incubated with etheno-NAD showed homogeneous staining indicating a homogeneous distribution of ART2 target proteins (see Figure 3A). In contrast, control cells not exposed to the ART substrate did not show any detectable bound Ab-SPIO (see Figure 3B). To directly visualize cell-bound SPIO, cells displaying ART activity were analyzed by transmission electron microscopy (TEM) (Figure 4). Consistent with the immunofluorescence data, only etheno-NAD-treated cells showed SPIO on the cell surface (see Figure 4A). Interestingly, SPIO often appeared to be preferentially attached to protrusions from the cell surface. Note that no SPIO were detected inside cells.

Flow cytometry and in vitro MRI of ART2 expression on three different cell lines. Indicated cells were stained with Nika102 antibody. A, One part of the cells was stained with secondary fluorochrome-conjugated antibodies and subjected to flow cytometry. Mean fluorescence intensities are plotted as diagrams (filled lines). Dashed lines and solid lines indicate untreated cells and isotype control, respectively. B, The other part of the Nika102-labeled cells was stained with secondary Ab-SPIO and placed on gel beds in test tubes. Sagittal T2*-weighted sequences (B, upper panel) and axial T2*-multiecho and T2-multiecho relaxation time maps were generated (B, lower panels). Untreated cells and isotype controls were analyzed for control. Parameters of MRI sequences are listed in Table 1.
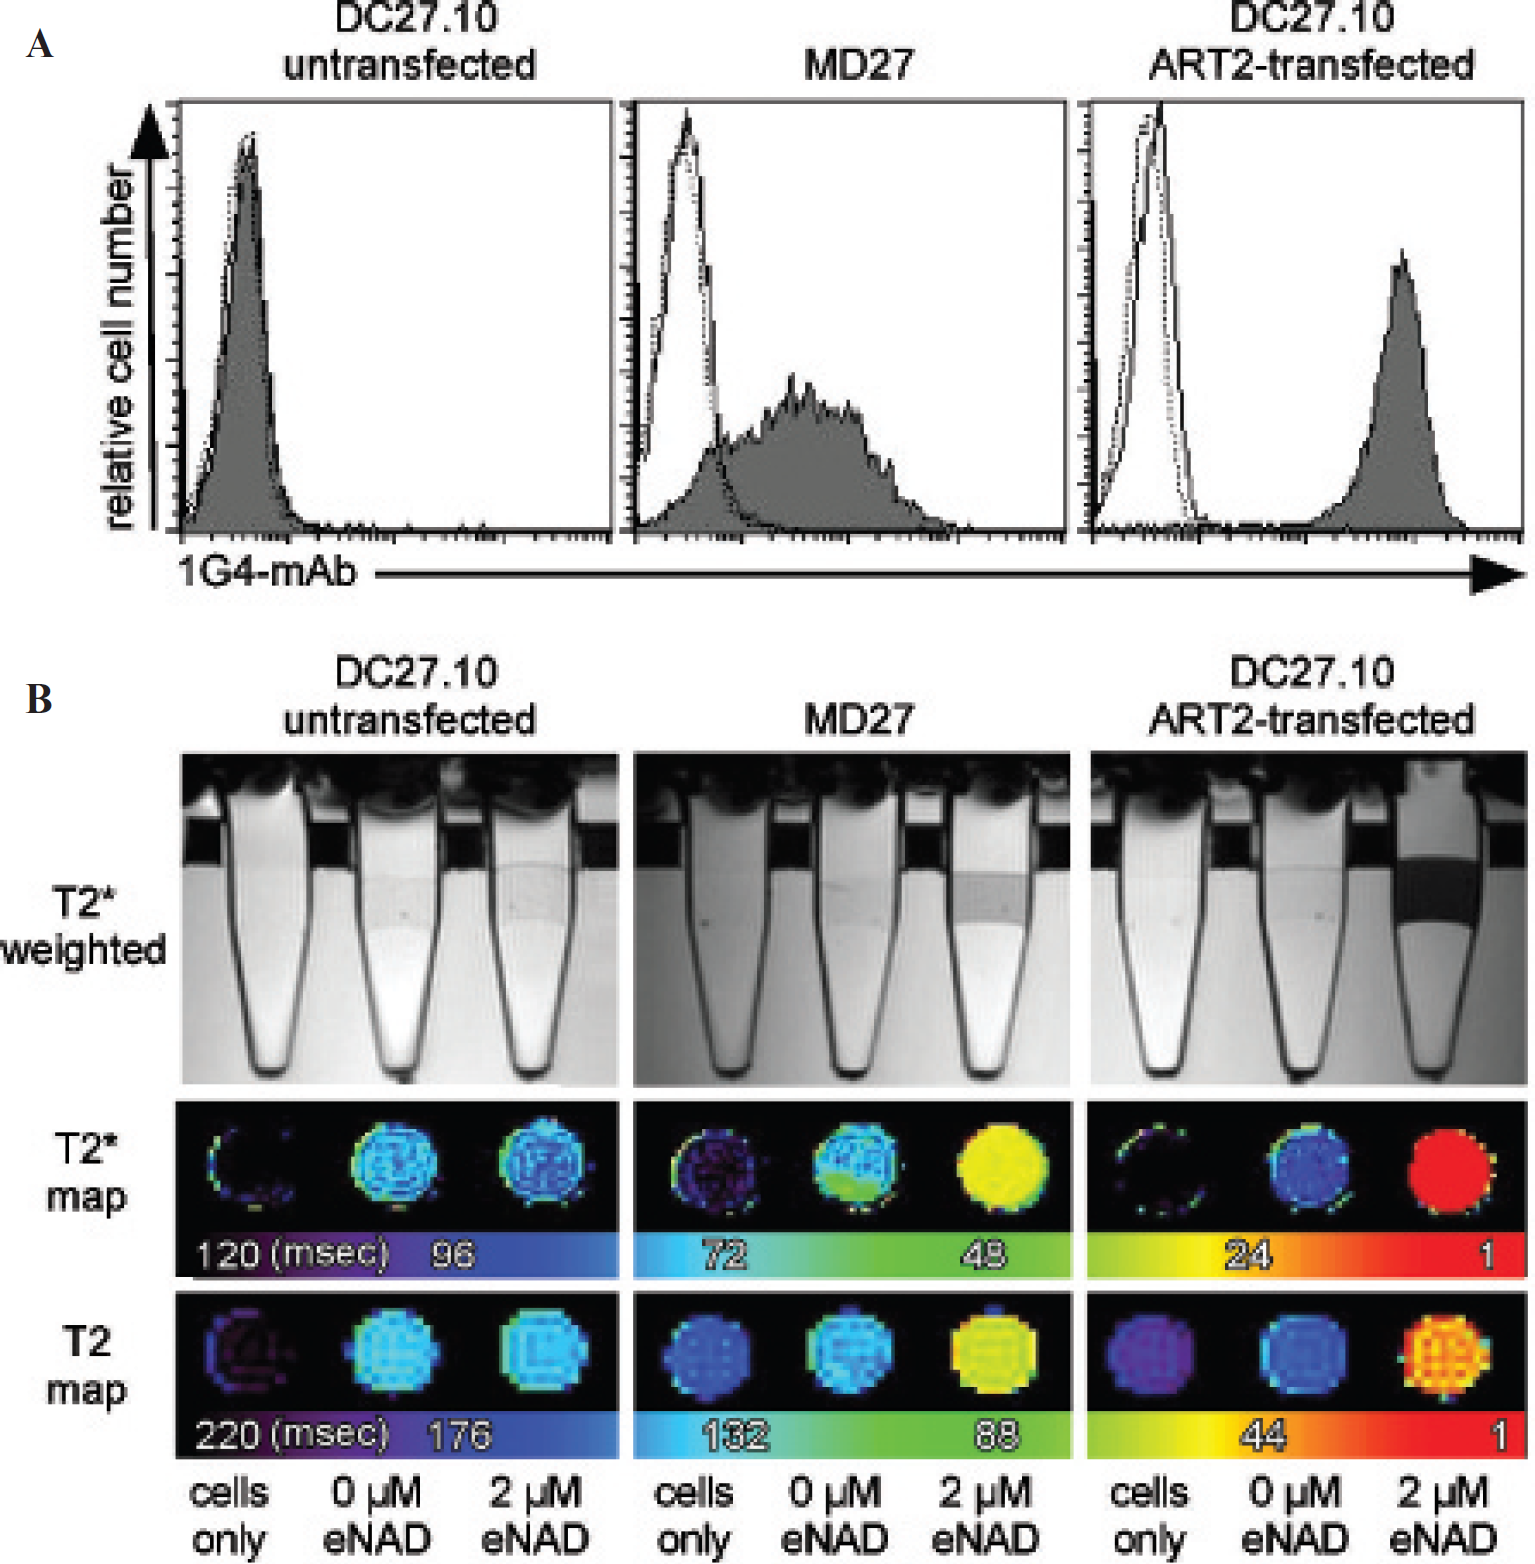
Flow cytometry and in vitro MRI of ART2 activity. Indicated cells were incubated without or with etheno-NAD and stained with 1G4 antibody. A, One part of the cells was stained with secondary fluorochrome-conjugated antibodies and subjected to flow cytometry. Mean fluorescence intensities are plotted as diagrams (filled lines). Dashed lines and solid lines indicate cells alone and etheno-NAD untreated cells, respectively. B, The other part of the 1G4-labeled cells was stained with secondary Ab-SPIO and placed on gel beds in Eppendorf tubes. Sagittal T2*-weighted sequences (B, upper panel) and axial T2* and T2 relaxation time maps were generated (B, lower panels). Parameters of MRI sequences are listed in Table 1. Cells alone and etheno-NAD-untreated cells were analyzed for control. Note that fluorescence intensities and loss of signal depend on the expression of ART2 and correspond to its expression levels (see Figure 1).
Comparison of Flow Cytometry and AAS Analysis with Quantitative MRI Analyses
R2 and R2* of MD27 cells with intermediate ART2 expression incubated with increasing doses of etheno-NAD revealed an increasing signal reduction in T2*-weighted images (Figure 5A). Quantification revealed a sigmoidal dose response for both R2 and R2*, with half-maximal R2(*) at 0.6 μM etheno-NAD and saturating response above 10 μM etheno-NAD (Figure 5B). R2* rates were higher than those for R2, with maximal values of 135 ± 14 s−1 for R2* and 50 ± 12 s−1 for R2 at 40 μM etheno-NAD. The dose-response curves for R2* and R2 showed linear correlations (r 2 = .99, r 2 = .97, respectively) with that obtained by flow cytometry (Figure 5, C and D).
For quantitative determination of maximal achievable ART2-dependent cell-surface SPIO labeling, ART2-transfected DC27.10 cells with high ART2 expression were labeled with increasing doses of etheno-NAD and 1G4-SPIO (Figure 6). MRI analyses showed sigmoidal dose responses similar to those for MD27 cells with maximal R2* of 158 ± 12 s−1 and maximal R2 of 38 ± 12 s−1 at 10 μM etheno-NAD (see Figure 6, A and B). AAS of unlabeled cells revealed a physiologic cellular iron content of 9.3 ± 2.5 fg per cell (not shown). Saturating cell-bound iron levels were reached at 5 to 10 μM etheno-NAD with a maximal iron load of 84.1 ± 13.8 fg per cell (see Figure 6C). Quantitative spectrometric measurements of iron content of labeled cells revealed a linear relationship with both R2 (r 2 = .87) and R2* (r 2 = .90) (see Figure 6D).
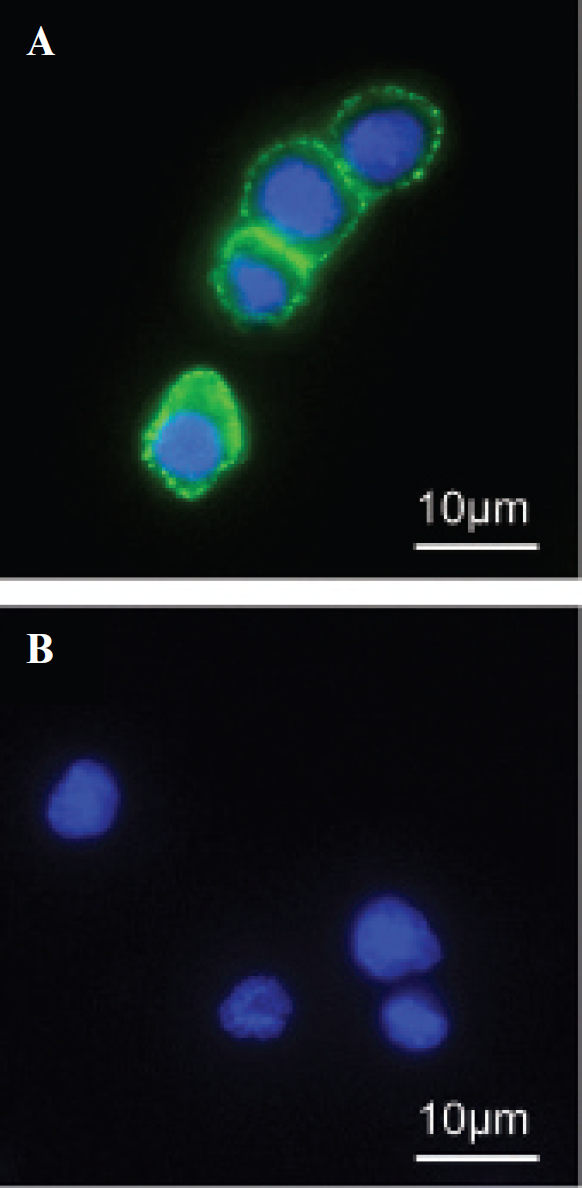
Immunofluorescence of ART2-dependent cell surface labeling with SPIO. ART2-transfected DC27.10 cells were incubated with (A) or without etheno-NAD (B) and labeled with the 1G4 antibody and secondary SPIO antibodies. Dextran-coated SPIO particles were detected with an antidextran-FITC antibody and nuclei were counterstained with Hoechst 33342. Note that only cells preincubated with the ART2 subtrate etheno-NAD show cell-surface labeling with SPIO particles, which have a homogeneous distribution.
In Vivo MRI of ART2 Activity
ART2-transfected DC27.10 cells (5 × 10 7 ) incubated without or with 0.1, 1, and 10 μM etheno-NAD were labeled with Ab-SPIO and injected in agarose into the left flank of four mice (Figure 7). In vivo MRI revealed clearly detectable, albeit inhomogeneously distributed signal reduction for etheno-NAD-treated cells but not for untreated cells (see Figure 7A). The degree of signal reduction increased with concentration of etheno-NAD. High spatial resolution T2 and T2* maps of cell-bound SPIO (see Figure 7B) showed higher R2* values (maximal 143 ± 62 s−1) than R2 values (maximal 10 ± 9 s−1) (see Figure 7B), consistent with the in vitro studies.
MRI of free Ab-SPIO with corresponding amounts of total iron injected into the contralateral flanks showed homogeneous signal reduction that increased with increasing amounts of iron (see Figure 7A). R2* values for free Ab-SPIO (maximal 77 ± 6 s−1) were lower than for cell-bound SPIO (maximal 143 ± 62 s−1) with the corresponding amount of iron (see Figure 7B). In contrast, R2 values for free SPIO (maximal 32 ± 2 s−1) were higher than for cell-bound SPIO (maximal 10 ± 9 s−1).

Transmission electron microscopy (TEM) of SPIO-labeled cells. ART2-positive DC27.10 cells were incubated with (A) or without etheno-NAD (B) and labeled with 1G4 antibody and Ab-SPIO as in Figure 2. Cells were fixed and subjected to TEM. In neither case were the SPIO detected intracellular, and only on cells preincubated with etheno-NAD were iron oxide particles detected at the cell surface. Interestingly, SPIO were often found sticking to cellular protrusions.
A portion of the prepared free SPIO and cell-bound SPIO were transferred to test tubes and analyzed in vitro (Figure 8). The results showed increasing R2 and R2* values with increasing SPIO concentrations (see Figure 8A). R2* values for free Ab-SPIO again were lower than for cell-bound SPIO, whereas R2 values for free SPIO again were higher than for cell-bound SPIO (see Figure 8A, panel 1 vs panel 2). Interestingly, R2* values for cell-bound SPIO in test tubes were lower than those for cell-bound SPIO in vivo (see panel 2 in Figure 8A vs B), whereas R2 values for free Ab-SPIO in test tubes were higher than those for free Ab-SPIO in vivo (see panel 1 in Figure 8A vs B).
To determine the detection limits of the enzyme-based labeling strategy and to validate the quantitative measurements under clinical conditions, different amounts of cells (2 × 10 6 , 1 × 10 7 , and 5 × 10 7 ) incubated with 1 μM etheno-NAD and subsequent SPIO labeling were injected in the flanks of two mice (Figure 9). Adriouch and colleagues showed that the NAD substrate concentration in inflammatory exudates can reach up to 10 μM and found up to 4 × 10 7 cells at the peak of the inflammatory reaction. 22 Our results show that even the lowest numbers of cells (2 × 10 6 ) incubated with 1 μM etheno-NAD and subsequent Ab-SPIO labeling can be detected by MRI. R2* and R2 relaxation measurements allowed quantification of labeled cells. R2* values ranged from 153 ± 49 s−1 for 5 × 10 7 cells over 89 ± 26 s−1 for 1 × 10 7 cells to 63 ± 26 s−1 for 2 × 10 6 cells. R2 values also correlated with the cell numbers and were again lower than R2* values.

Dose response of ART2 activity analyzed by flow cytometry and in vitro MRI. MD27 cells with intermediate ART2 expression were incubated without or with the indicated concentrations of etheno-NAD and stained with 1G4-antibody. A, One part of 1G4-labeled cells was stained with secondary AB-SPIO and subjected to MRI. Sagittal T2*-weighted sequences (A, upper panel) and axial T2*- and T2-weighted relaxation time maps were acquired (A, lower panels). Untreated cells were analyzed for control. B, Calculated R2 and R2* values correlate with the etheno-NAD concentration. C, The other part of the cells was stained with secondary fluorescence-conjugated antibodies and subjected to flow cytometry. Mean fluorescence intensities are plotted. Interestingly, both graphs for R2 and R2* and fluorescence intensities show a sigmoidal behavior, which is typical for enzymatic reactions. D, Graphs of quantitative data evaluation show a linear relationship between mean fluorescence intensities and both R2* and R2. Note that changes in R2* are higher than changes in R2. Parameters of MRI sequences are listed in Table 1.
Discussion
Our study provides the first demonstration of a quantitative and noninvasive imaging technique to monitor a leukocyte cell-surface ectoenzyme in vitro and in an in vivo model. Indeed, 2 million cells incubated with low substrate concentrations could be visualized with the 3.0 T clinical MR unit. Importantly, the substrate concentrations (1 μM) and cell numbers (2 × 10 6 ) are well in the range of in vivo NAD concentrations and cell numbers that have been encountered in inflammatory exudates.22,23,29
Adriouch and colleagues showed that the NAD concentration in inflammatory exudates reaches a peak of 10 μM during the early phase of the inflammatory response, resulting in efficient cell-surface ADP-ribosylation and subsequent alteration of T-cell functions. 22 The concentration of extracellular NAD correlates with the degree of cell damage in inflammatory tissues. Therefore, the degree of cell-surface ADP-ribosylation could serve as a parameter for the status of an inflammatory process. Given that individuals are known to respond differently to inflammatory therapy, molecular imaging of NAD release in vivo by this technique could allow an individualized and quantitative assessment of the timing, dose, and efficacy of a particular therapy.
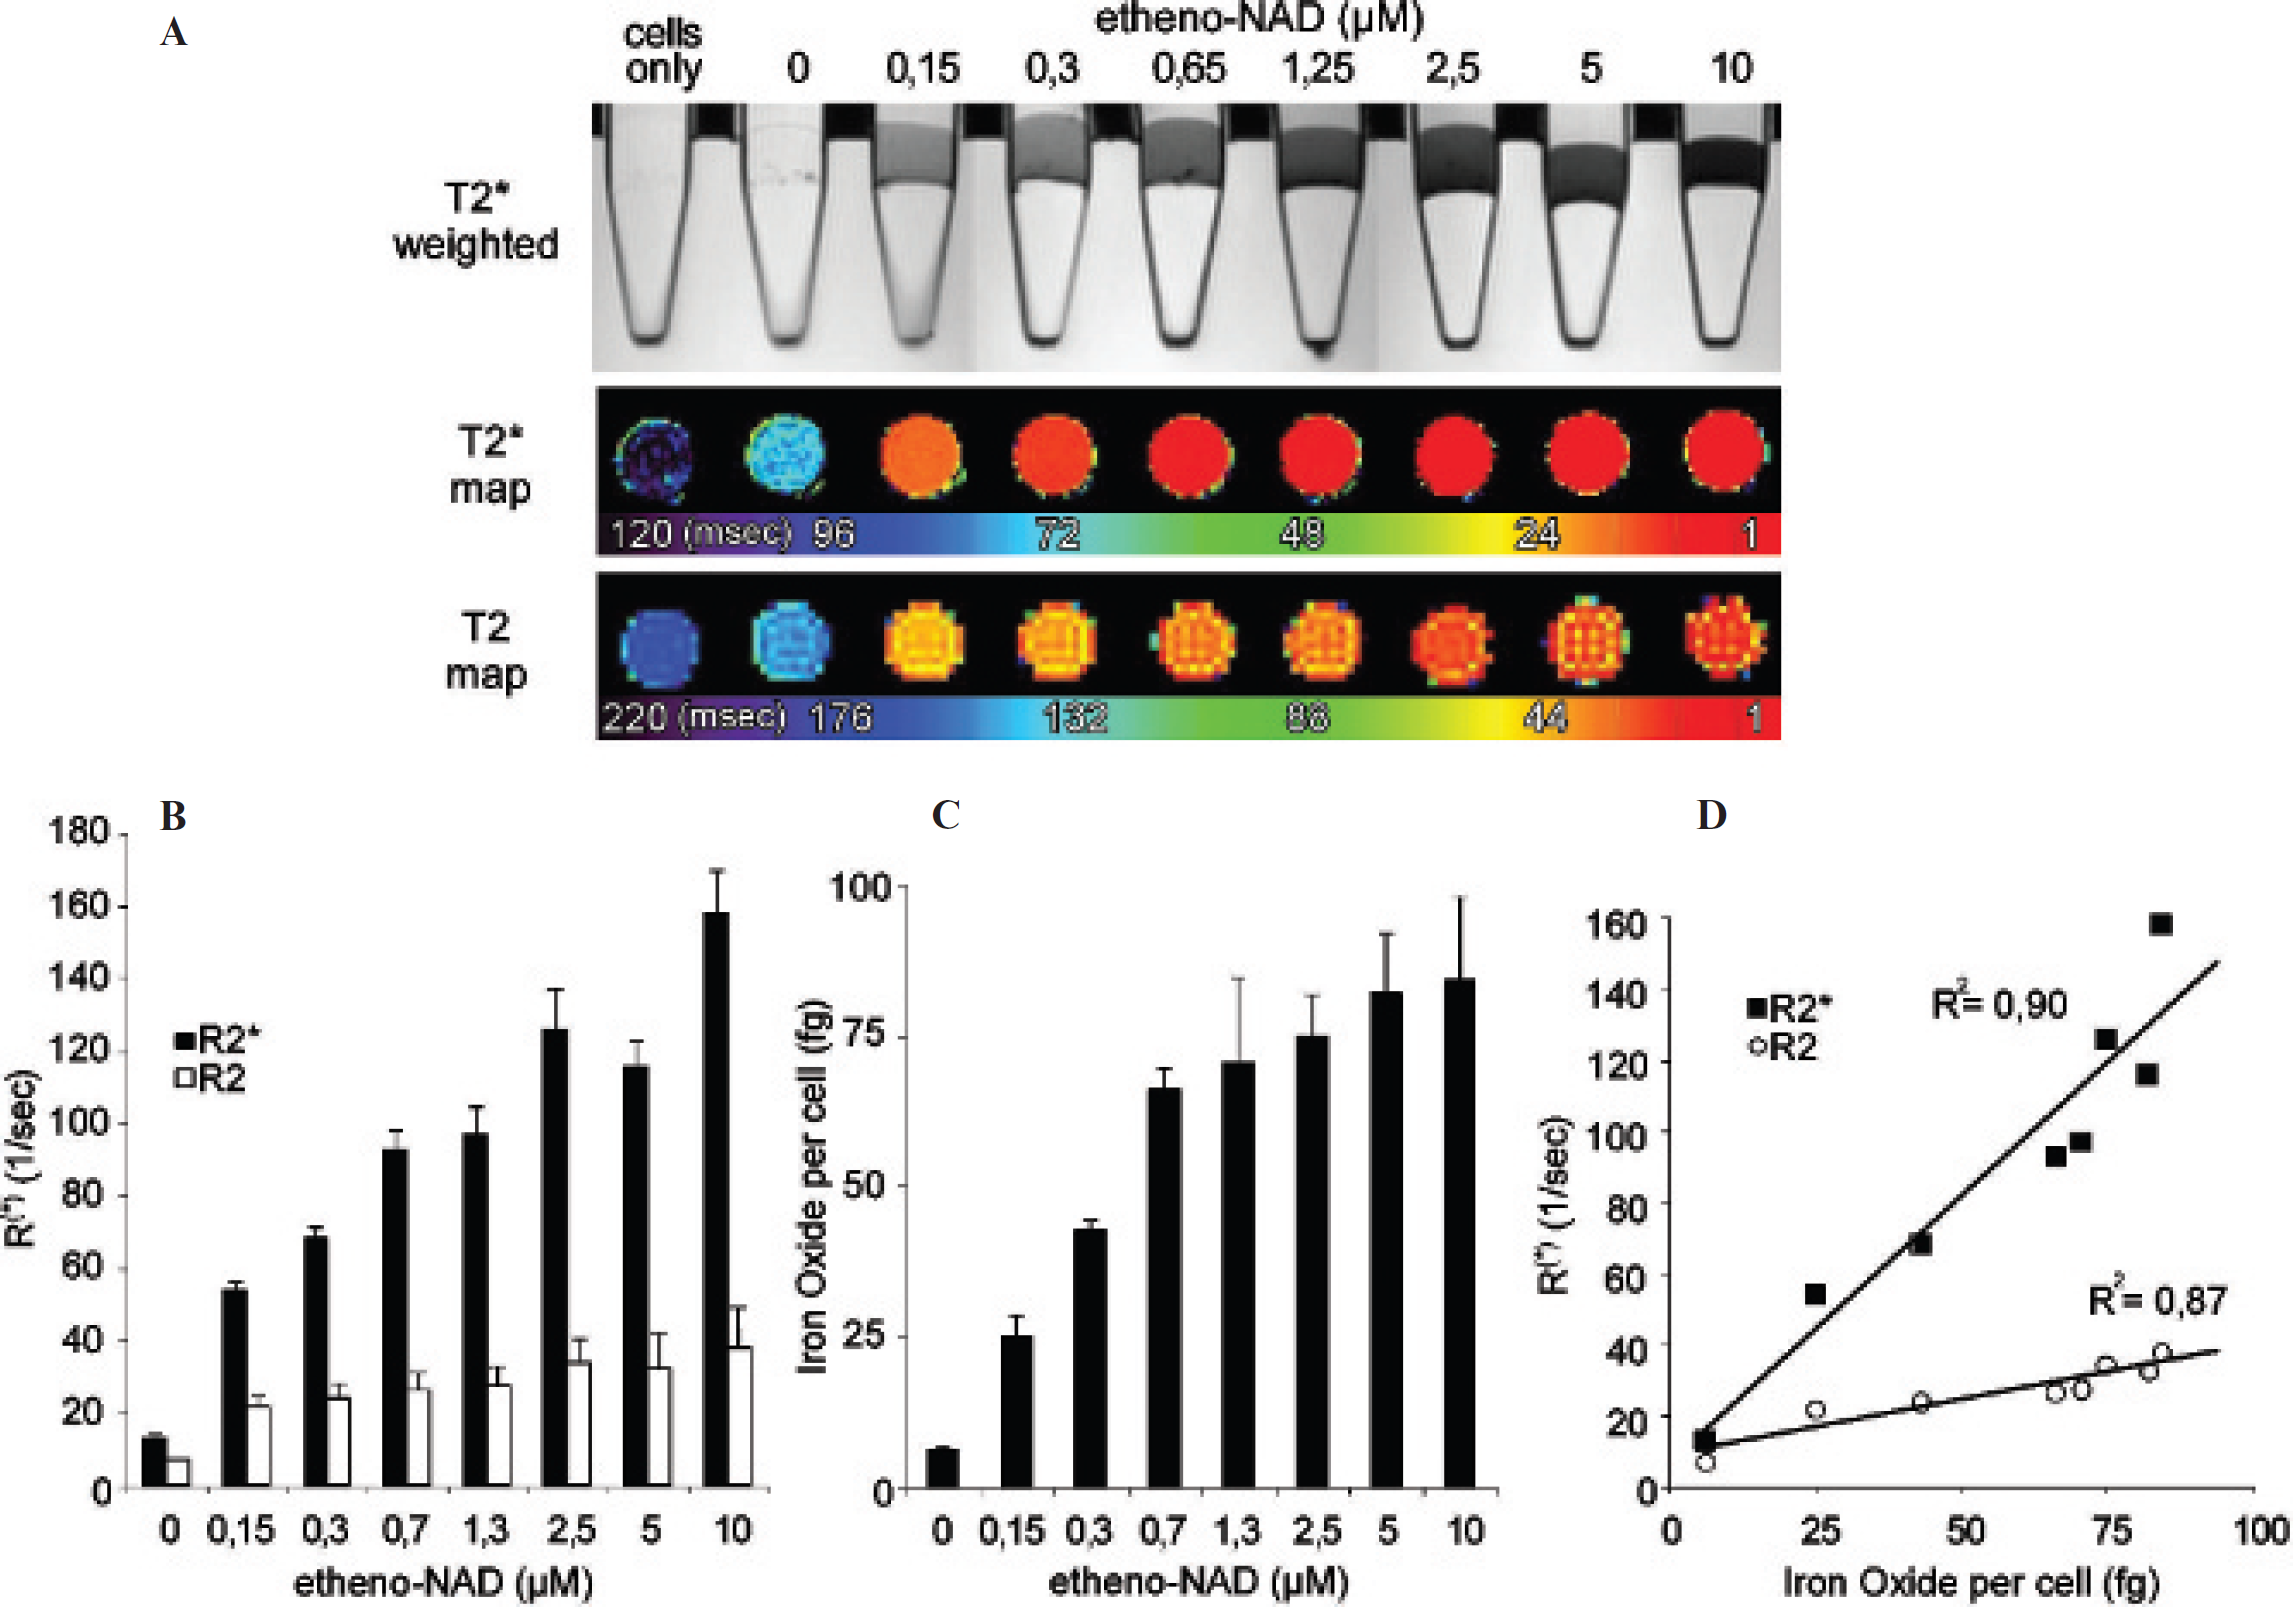
Quantification of ART2-dependent SPIO labeling of cells with atomic absorption spectrometry (AAS) and comparison with MR relaxometry. ART2-transfected DC27.10 cells were incubated without or with the indicated concentrations of etheno-NAD and stained with 1G4 antibody. A, One part of the cells was stained with secondary Ab-SPIO and analyzed by MRI. Sagittal T2*-weighted sequences (A, upper panel) and axial T2* and T2 relaxation time maps were generated (A, lower panels). B, Calculated R2 and R2* values in dependency of etheno-NAD concentration. C, SPIO labeling of the other part of the cells was quantified by AAS. Bars illustrate total iron oxide content per cell. D, Graphs of quantitative data evaluation show a linear relationship between iron oxide concentration and R2 and R2*. Again, changes in R2* are higher than changes in R2. Parameters of MRI sequences are listed in Table 1.
A high correlation between MRI and flow cytometric data was seen in the present study, and both techniques showed a clear dose response. Up to now, the gold standard for measuring expression and activity of ART2 on T cells ex vivo is flow cytometry.16,28 Our results of R2 and R2* relaxometry of Ab-SPIO-labeled cells showed a linear correlation (r 2 > .97) with the data obtained by flow cytometry (see Figure 5), confirming that MR relaxometry can be used as an equivalent alternative, with the additional option to monitor ART2 expression and activity in vivo.
We observed a linear relationship (r 2 > .87) between R2 and R2* values and the iron oxide concentration determined by AAS of labeled cells over a broad range of etheno-NAD concentrations (see Figure 6). This allowed us to estimate the minimal amount of iron oxide (25 fg/cell) required to visualize cells by MRI and the maximal amount of iron oxide labeling (84 fg/cell) (see Figure 6). Immunofluorescence analysis and TEM confirmed labeling of the cell surface with Ab-SPIO, and no intracellular uptake was observed (see Figure 3 and Figure 4). Interestingly, several Ab-SPIO particles often appeared to be sticking to cellular extensions (see Figure 4), possibly reflecting the preferential ADP-ribosylation of cell-surface proteins associated with specialized membrane microdomains (lipid rafts). 16

In vivo imaging of SPIO-labeled etheno-ADP-ribosylated cell-surface proteins on cells. ART2-transfected DC27.10 cells incubated without or with 0.1, 1, and 10 μM etheno-NAD and subsequent SPIO labeling were injected into subcutaneous agarose pellets. A, Coronal T2-weighted sequence of mice with injected cells in left flanks. The same amount of iron, as indicated, was injected as free SPIO particles into the right flanks for comparative analysis. B, Axial T2* and T2 relaxation time maps of injected free and cell-bound SPIO. Note the high R2* (maximal 143 ± 62 s−1) but rather low R2 values (maximal 10 ± 9 s−1) for SPIO-labeled cells. Interestingly, the difference was less pronounced for free SPIO particles: R2* (maximal 77 ± 7 s−1) and R2 (maximal 32 ± 2 s−1). Parameters of MRI sequences are listed in Table 1.
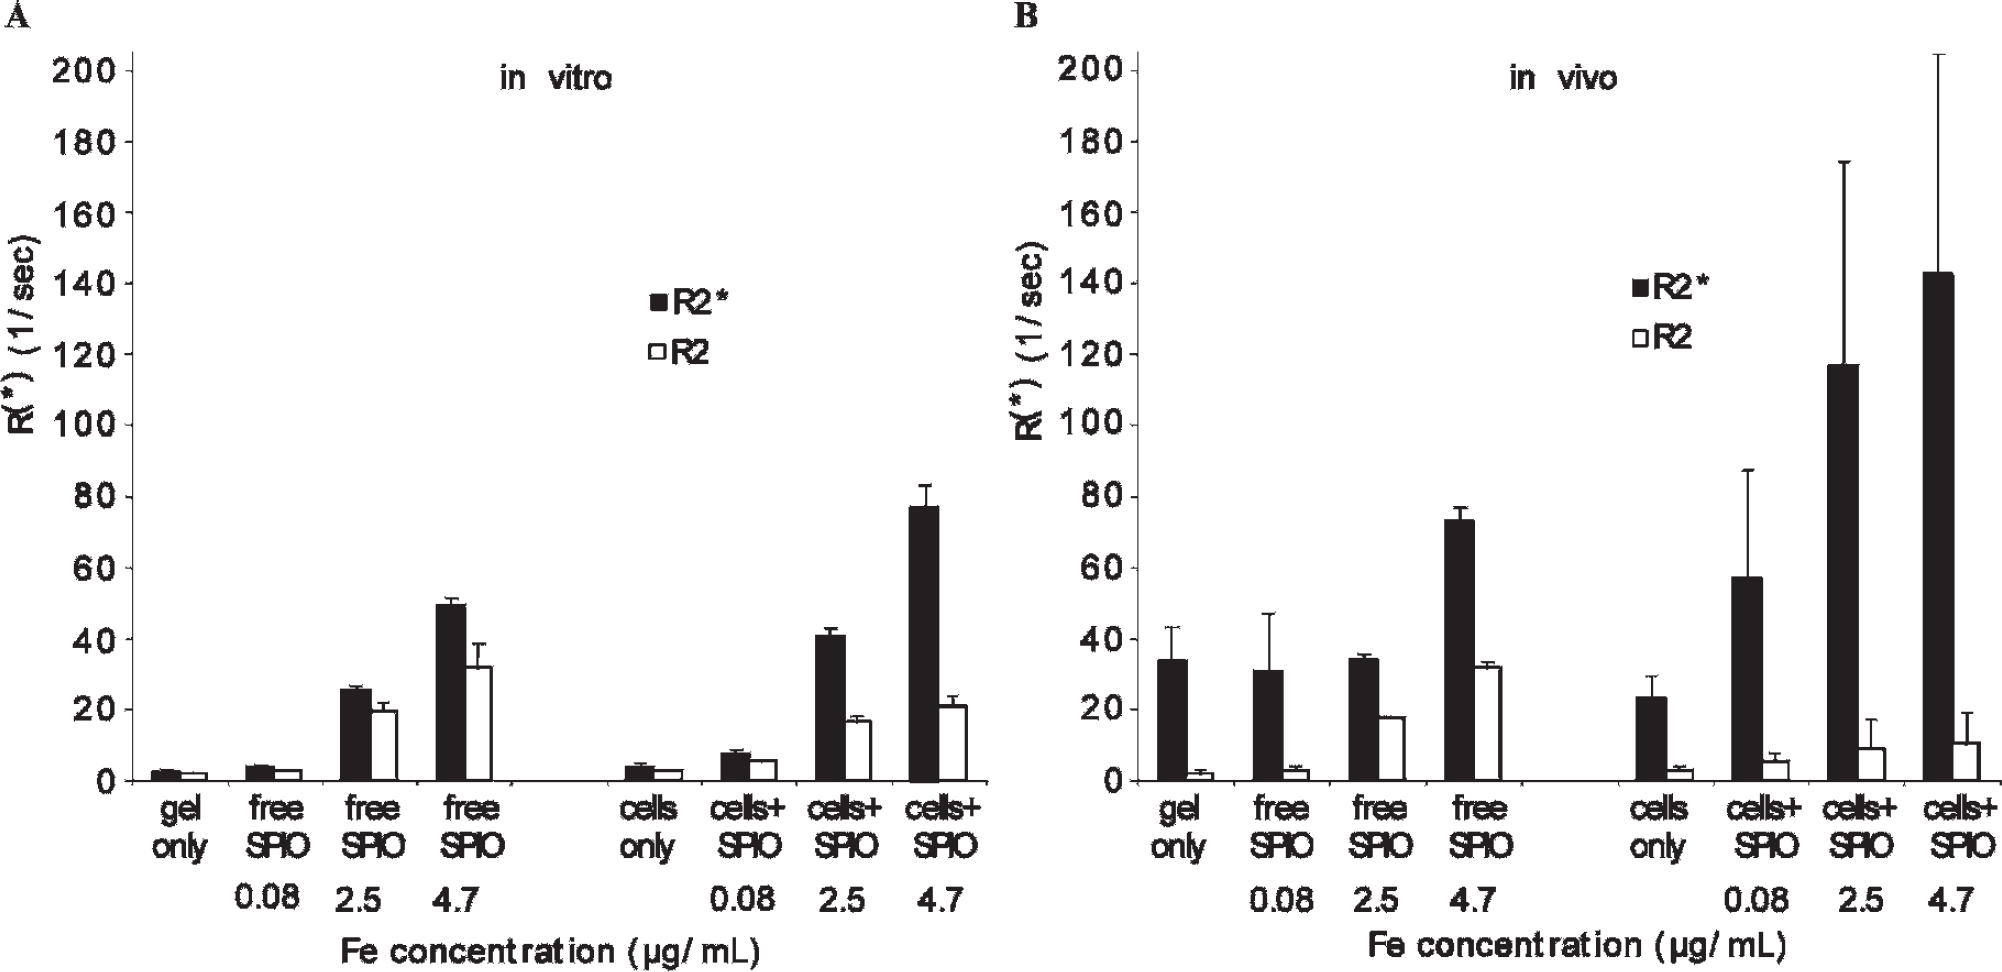
Graphs illustrate dependency of R2* (black bars) and R2 (white bars) on SPIO concentration, compartmentalization of SPIO (free vs cell bound), and in vitro (A) and in vivo (B) conditions. For internal control of in vivo measurements (see Figure 7), only half of cell-bound or free SPIO was injected into mice (B); the other half was transferred into test tubes for standardized in vitro measurements (A). Graphs of quantitative data evaluation show a linear relationship between iron oxide concentration and R2* and R2 in vitro and in vivo. Note that R2* is generally higher in vivo than in vitro, which is especially pronounced in cell-bound SPIO. Interestingly this is not true for R2; here cell-bound SPIO have lower values in vivo than in vitro.
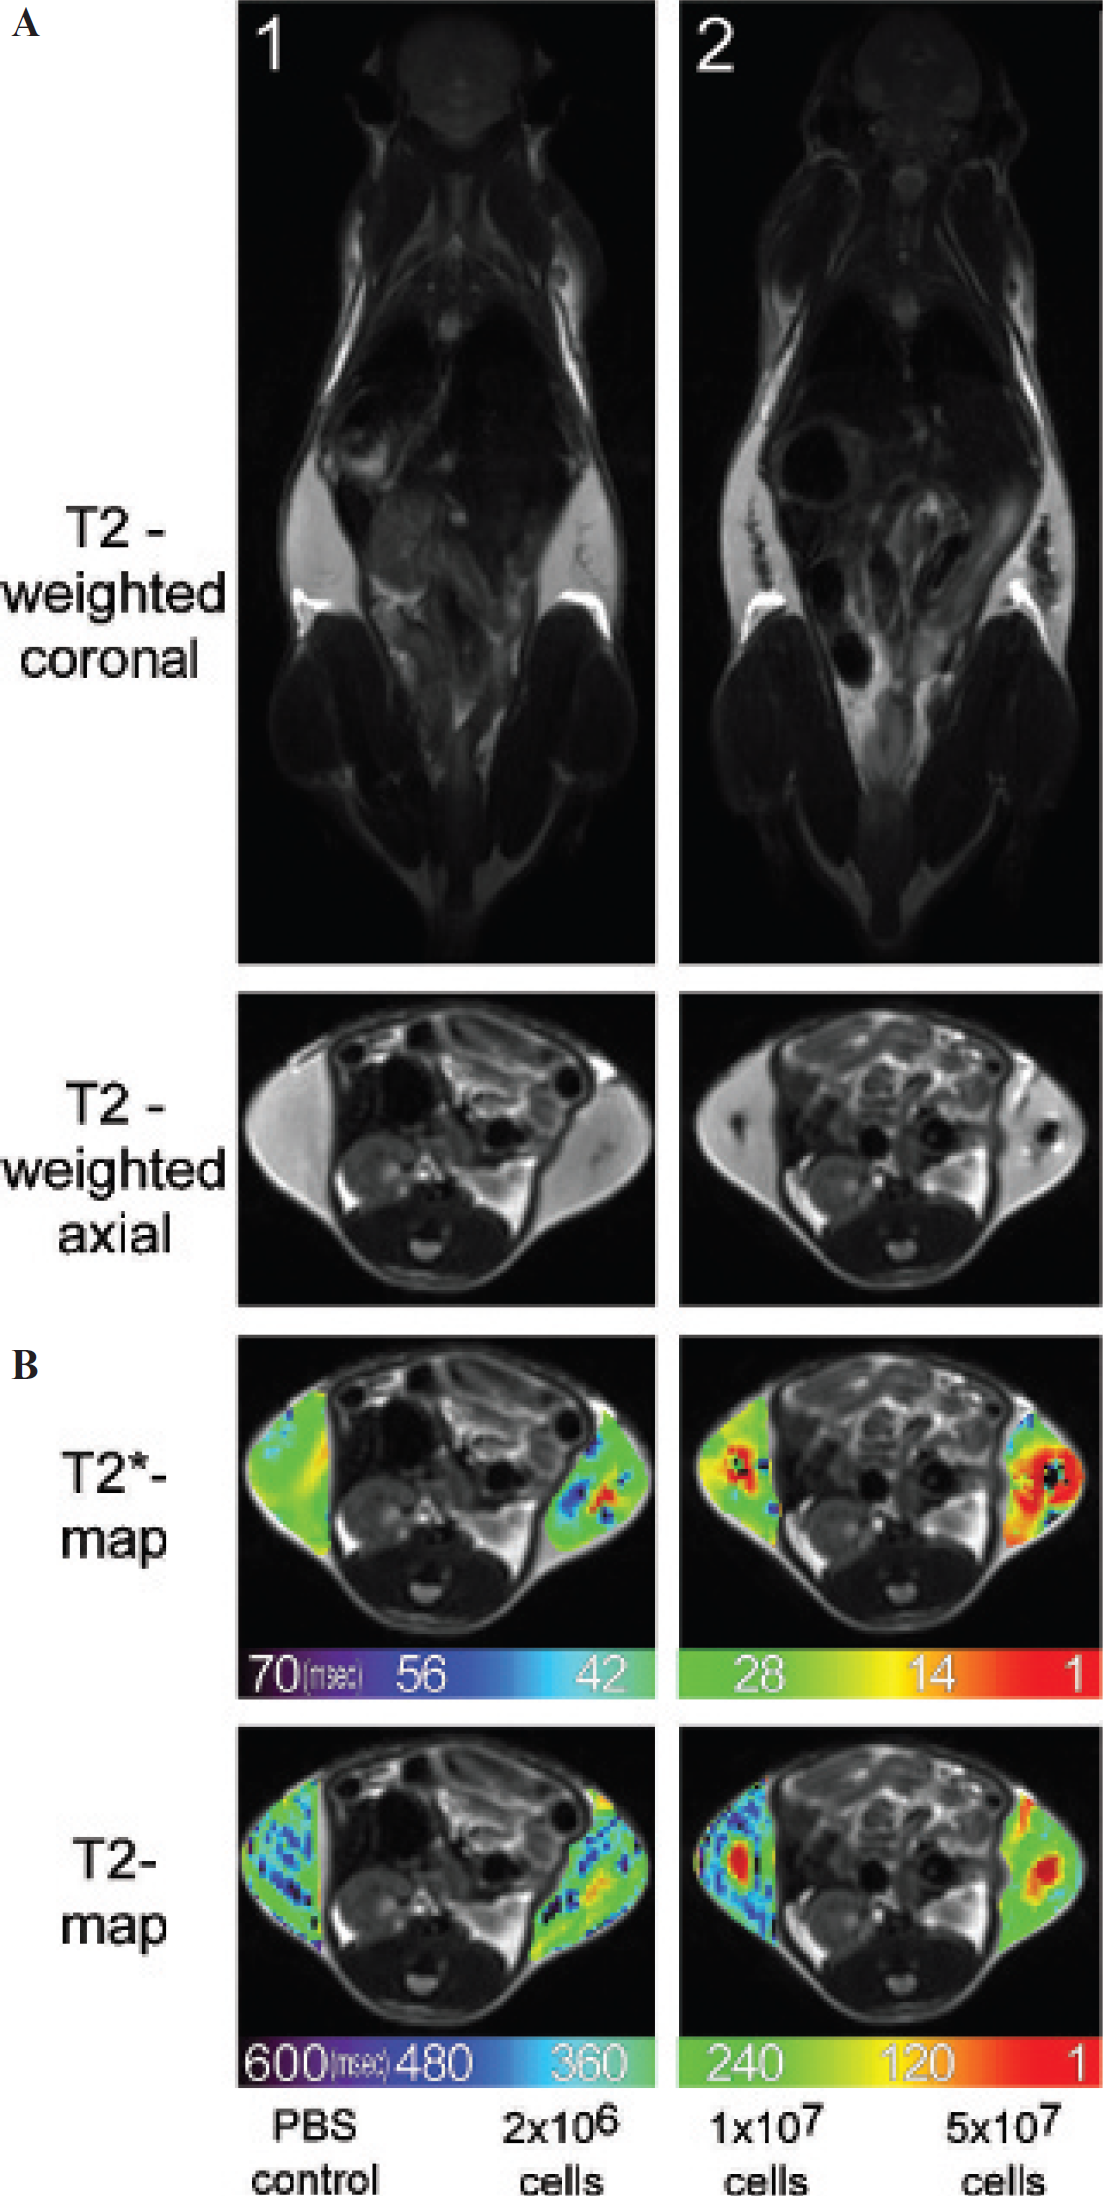
Validation of cell labeling efficiency and determination of the detection limit under clinical conditions. Different amounts of ART2-transfected DC27.10 cells (2 × 10 6 , 1 × 10 7 , and 5 × 10 7 cells) incubated with 1 μM etheno-NAD and subsequent SPIO labeling and PBS as control were injected subcutaneously in the flanks of two mice. A, Coronal and axial T2-weighted sequences of mice with injected cells. Note that even cell numbers as low as 2 × 10 6 are detectable. B, Axial T2* and T2 relaxation time maps of injected cells. Relaxation rates ranged from maximal 153 ± 49 s−1 (R2*) and 13 ± 9 s−1 (R2) in the case of 5 × 10 7 cells to minimal 63 ± 26 s−1 (R2*) and 3 ± 0.3 s−1 (R2) in the case of 2 × 10 6 cells.
The applied particles have been used successfully in previous in vivo studies for tracking of cells in mice,14,30 rats, 31 and pigs. 32 Because SPIO similar to those used in this study are approved for human use, 33 the MRI technique we have described could be extended for other clinically relevant antigens. Importantly, our enzyme-based labeling technique allows precise titration of SPIO-labeled cell-surface antigens. Therefore, our system provides a useful model to evaluate the potential of new SPIO agents for imaging studies in a controlled experimental setup, for example, for evaluating the suitability of a particular cell-surface protein for imaging of tumors.
Quantification of cell populations and cell-surface expression levels of receptors in vivo is complex because baseline values for R2 and R2* differ substantially according to tissue type. Furthermore, inhomogeneous cell distribution and susceptibility artifacts complicate the exact estimation of SPIO in vivo. In our model system of locally injected cells, SPIO-labeled ART2-transfected DC27.10 cells could be clearly detected, even at low cell numbers (2 × 10 6 ) and at low labeling levels (see Figure 7 and Figure 9). We expect a lower detection limit for MD27 cells endogenously expressing the ART2.2 enzyme because comparable labeling intensities were observed for DC27.10 cells at 1μM etheno-NAD and MD27 cells at 2.5 μM etheno-NAD (see Figure 5 and Figure 6). Moreover, this system allowed us to directly compare in vivo and in vitro measurements of equivalently labeled cells (see Figure 8). The R2* values for cell-bound SPIO were higher in vivo than in vitro, primarily owing to susceptibility artifacts, whereas the R2 values were lower in vivo than in vitro, which could be explained by inhomogeneous cell distribution in agarose depots in vivo. Furthermore, respiratory motion affected MR relaxometry in mice. Therefore, our data confirm the need for correction algorithms34,35 for in vivo MR relaxometry measurements.
A limitation of our study is the fact that labeled cells were injected locally, unlike in other in vivo studies, in which Ab-SPIO or labeled cells were injected systemically.13,14 On the other hand, our in vivo model system was previously used effectively by Kuhlpeter and colleagues to validate in vitro results of quantitative measurements. 35 For our feasibility study, we opted for very well-controlled conditions, and for comparative analysis, it was necessary that the number of labeled cells was identical for all animals. Another reason for the injection of prelabeled cells is the detection system that we employed, that is, the use of etheno-NAD instead of NAD to permit Ab-based detection of etheno-ADP-ribosylated surface proteins. For studies of genuine inflammation sites in vivo, where NAD is released from lysed cells, 22 an antibody that recognizes ADP-ribosylated antigens would be required. Presently, no such monoclonal antibodies are available. The recent report of a polyclonal antibody specifically recognizing ADP-ribosylated proteins indicates that corresponding monoclonal antibodies will become available in the future. 36 This will allow systemic injection of Ab-SPIO and characterization of cells in inflamed tissues by MRI.
The presented technique may present a tool to better characterize inflammatory sites and to monitor the efficacy of antiinflammatory therapies. With our enzyme-based system for titrating levels of SPIO-labeled cell-surface proteins, it is further possible to analyze and benchmark new SPIO or multimodality particles37,38 to determine detection limits and maximal imaging contrast for in vitro and in vivo studies. The techniques described in the present study have the potential for translation to in vivo imaging of tumors and inflammation and could thus be of significant value in both research and clinical settings.
In summary, our results show that the activity of a cell-surface enzyme can be monitored in vitro and in vivo noninvasively by R2 and R2* relaxometry.
Footnotes
Acknowledgment
Financial disclosure of authors and reviewers: None reported.