
Abstract
We developed an integrated imaging method using bioluminescence imaging (BLI) and magnetic resonance imaging (MRI) and applied it to mouse tumor monitoring. BLIs and MRIs were successively acquired from mice fixed on a transparent flat plate and were registered using three small markers. After spatial coregistration, the two-dimensional BLI was fused with all MRI slices. The accuracy of image registration was evaluated using fluorescence imaging and MRI of many markers attached to the mice. Mice were inoculated with luciferase-expressing tumor cells subcutaneously or directly into the liver, and disease progression was evaluated repeatedly by integrated BLI-MRI. Image registration was achieved with acceptable accuracy, although the registration error increased with increasing distance from the center of the imaging field and was larger in imaging the convex dorsal side of the mouse than in imaging the flat ventral side. Integrated BLI-MRI allowed longitudinal assessment of disease progression and appeared to facilitate detailed interpretation of the imaging findings. It aided the anatomic localization of lesions demonstrated by BLI and recognition of MRI abnormalities corresponding to BLI foci. Integrated BLI-MRI is feasible and appears to be a practical method for comprehensive, longitudinal assessment of disease model mice.
IN VIVO IMAGING, which permits repeated assessment of individual animals to assess disease progression, therapeutic efficacy, and pharmacokinetics, is increasingly being used in small-animal experiments. Each animal can serve as its own control, resulting in greater reliability of experimental results, even when only a small number of animals are studied. Optical imaging, including bioluminescence imaging (BLI) and fluorescence imaging (FLI), plays a major role in small-animal imaging. In vivo BLI enables evaluation of the distribution and magnitude of the expression of the luciferase gene in an intact animal and has been used for various purposes, such as monitoring tumors, trafficking cells, assessing gene therapy, evaluating infectious disease, and investigating transcriptional regulation.1–4 Luciferase-expressing cells in animals emit light after substrate injection, and a small fraction of the emitted light passes through the tissues and reaches the body surface. Whole-body assessment of luciferase activity is attained by detecting the light on the body surface with a charge-coupled device (CCD) camera. The signals reflect luciferase activity with excellent specificity, leading to high sensitivity to luciferase expression. Drawbacks of in vivo BLI include lack of anatomic information and low spatial resolution. It is often difficult to identify organs harboring luciferase-expressing cells based on in vivo BLI alone, and concomitant morphologic changes cannot be assessed.
Multimodality imaging approaches use powerful features of each modality and are expected to enhance the capabilities of noninvasive imaging for small-animal experiments and for human clinical practice. Magnetic resonance imaging (MRI) provides high-resolution tomographic images containing detailed morphologic information. It permits the visualization of internal organs, detection and localization of tumor lesions, and measurements of organ and tumor size. In terms of tumor monitoring, BLI and MRI offer different details of animals inoculated with luciferase-expressing tumor cells and may play complementary roles in the comprehensive assessment of disease progression and therapeutic response.5–9 BLI allows sensitive detection of tumor lesions, and MRI aids anatomic localization of the lesions detected by BLI. Quantitative assessment of tumor burden can be achieved by both BLI and MRI, and the intensity of BLI signals correlates with the tumor volume measured by MRI.9
Successive data acquisition and image fusion of BLI and MRI would facilitate accurate, detailed localization of BLI signals on the anatomic maps obtained by MRI. Fusion of BLI with MRI or computed tomography has been reported to investigate complex light propagation in tissues.10,11 In this study, we developed a practical method for integrating two-dimensional BLI with tomographic MRI and applied it to the longitudinal monitoring of tumor model mice. Although fusion of tomographic images of BLI and MRI should be ideal, assessment of light propagation through tissues is a difficult task, and BLI tomography is still investigational and is not widely used. At present, most BLI studies use two-dimensional surface imaging, which demonstrates the amount and distribution of light on the body surface of the animal. The aim of this study was to establish a practical method of integrated BLI-MRI and to examine its potential utility in small-animal experiments.
Materials and Methods
Cell Lines
The human colon cancer cell line HCT116 was transfected with the firefly luciferase gene using the retroviral method described previously,12,13 leading to the establishment of HCT116-Luc cells. Firefly luciferase is stably expressed under the control of the long terminal repeat of Moloney murine leukemia virus in the cells. Cells were maintained in McCoy's 5A medium (Invitrogen, Grand Island, NY) supplemented with 10% fetal bovine serum (JRH Biosciences, Lenexa, KS) and 1% penicillin-streptomycin (Invitrogen). Cell cultures were incubated at 37°C under 5% CO2.
Animals
Female Balb/c nu/nu mice (8 weeks old) were purchased from SLC Japan (Hamamatsu, Japan). They were given a pelleted regular rodent diet (CA-1, CLEA Japan, Tokyo, Japan) and water ad libitum but were fed with autoclaved potato, instead of the regular diet, overnight before imaging. Our preliminary experiments demonstrated that this dietary preparation reduces gastrointestinal hyperintensity and related artifacts in MRI. The mice were handled in accordance with the guidelines of the Institute of Medical Science, University of Tokyo. The experiments were approved by the committee for animal research at the institution.
Optical Imaging
A cooled CCD camera system (IVIS Imaging System 100, Xenogen/Caliper Life Sciences, Alameda, CA) equipped with a fluorescence kit (XFO-6, Xenogen/Caliper Life Sciences) was used for optical imaging. In vivo BLIs together with photographic images were acquired about 10 minutes after subcutaneous (SC) injection of 75 mg/kg
Magnetic Resonance Imaging
MRI was performed on a compact MRI system (MRmini, MRTechnology, Tsukuba, Japan) using a 1 T permanent magnet and a solenoid coil of a 30 mm inner diameter.14,15 Because the MRI system was small and caused only limited magnetic field leakage, the MRI and CCD camera systems were placed together without magnetic shielding in a 3 × 8 m2 room in a specific pathogen-free animal facility.
MRIs were acquired in the coronal plane using a T1-weighted, three-dimensional, fast, low-angle shot sequence. Scan parameters were as follows: repetition time (TR), 40 milliseconds; echo time (TE), 2.2 or 6.7 milliseconds; flip angle, 51°; in-plane matrix size, 256 × 128; slab partition, 64; number of excitations, 1; acquisition time, 5 minutes 28 seconds. The bandwidth was 100 kHz for TE of 2.2 milliseconds and 50 kHz for TE of 6.7 milliseconds. Using zero interpolation, we reconstructed 128 slices, resulting in 0.26 mm isotropic voxels. Scout images in the coronal plane were obtained in advance to achieve appropriate positioning of the mouse. Scan parameters for scout imaging were as follows: TR, 30 milliseconds; TE, 2.1 milliseconds; flip angle, 36°; in-plane matrix, 256 × 64; 16 slab partitions; number of excitations, 1; acquisition time, 31 seconds. For the assessment of liver lesions, a hepatobiliary contrast agent, gadoxetate disodium (Gd-EOB-DTPA, Bayer Yakuhin, Osaka, Japan), was injected subcutaneously at a dose of 25 μmol/kg.16
Procedures of Integrated BLI-MRI
For integrated BLI-MRI, mice were fixed on a dedicated imaging holder and underwent BLI followed by MRI. Small markers were attached on the mouse surface to attain spatial coregistration between BLI and MRI. Static magnetic field inhomogeneity and gradient field nonlinearities cause geometric distortion in MRI.17 In optical imaging, the camera-object distance varies depending on the position on the imaging table and the object height, resulting in variations in magnification in a given image.18 Such image distortion may impair the accuracy of spatial coregistration between BLI and MRI, especially in the peripheral portion of the imaging field, and we set the target region of the mouse, the region to be evaluated in detail, in the central portion for both BLI and MRI.
Under isoflurane anesthesia, we injected a mouse subcutaneously with Fixation of the mouse for integrated BLI-MRI. A, Imaging holder and two small supports. The imaging holder consists primarily of a flat, transparent plate. The nose cone for anesthesia, provided as part of the IVIS system, can be fitted into the hole of the projection placed at the end of the plate. For ventral imaging, the holder is turned over and the projections are put on the supports. B, A mouse fixed to the imaging holder with transparent tape under anesthesia.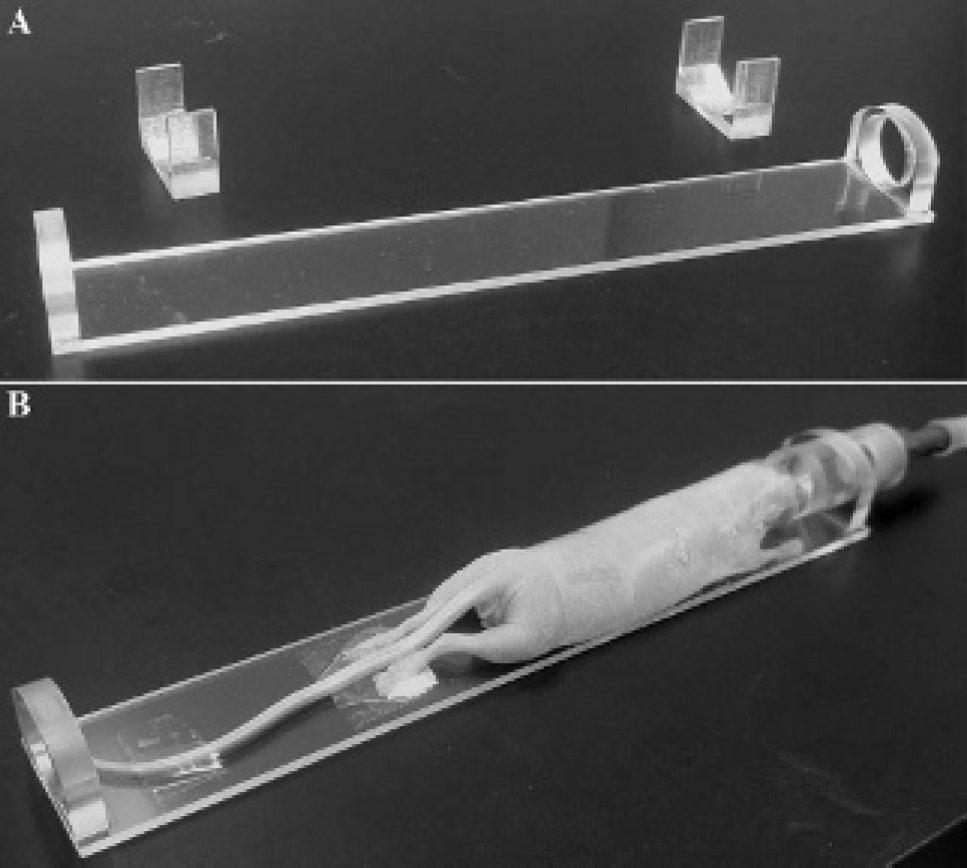
Three registration markers were attached to the mouse surface in the target region. When the dorsal and ventral images of BLI were to be assessed, the registration markers were put on the dorsal and ventral sides of the mouse, respectively. A polyethylene tube of 0.58 mm inner diameter and 0.97 mm outer diameter was filled with 20 to 80 nM Qdot 800 ITK amino (PEG) Quantum Dots (Invitrogen) and 10 mM gadolinium diethylenetriamine-pentaacetic acid (Bayer Yakuhin) in water and was cut into small pieces with heated tweezers to make markers that were visible on FLI and MRI.
The mouse fixed on the imaging holder was placed in the imaging chamber of the CCD camera system, and BLIs and FLIs were acquired successively with the mouse position unchanged. A piece of black paper with white lines was placed on the imaging table to indicate the central portion of the imaging field and to avoid variable rotation in mouse setting. The detector of the CCD camera system was placed over the imaging table. In imaging the dorsal side of the mouse, the plate of the imaging holder was placed in contact with the black paper, and the dorsal side faced the detector. In ventral imaging, the holder and mouse were turned over, with the ventral side facing the detector, and the holder was put on dedicated small supports (see Figure 1A).
Immediately after the completion of optical imaging, MRI was performed. For MRI, the mouse remained fixed on the imaging holder and was inserted into the solenoid coil in the prone position. The solenoid coil originally had a cylindrical bore and allowed rotation of the imaging holder around the long axis. To prevent such rotation, we attached small plates to the lower parts of the openings of the coil and put the imaging holder on the upper edges of the plates. Together with high accessibility of the compact MRI unit, the imaging holder was readily placed just horizontally and parallel to the long axis of the coil. Appropriate positioning in the craniocaudal direction was confirmed in the scout images to set the target region of the mouse in the central portion of the imaging field.
Image Processing
The BLIs and FLIs were exported as PNG files (x4 resolution) using Living Image software (version 2.50, Xenogen/Caliper Life Sciences). To display BLIs, we used the overlay and blend functions of the software. The overlay function displays opaque BLIs overlaid on photographic images. The blend function fuses transparent BLIs with photographic images. The BLIs were presented with a rainbow color scale; red indicated the most intense signals. The photographic images were shown with a grayscale. The maximum value of the rainbow color scale for the display of BLIs was determined visually by the operator, and the same value was applied to the overlay and blend images. The minimum value was typically set at 5% and −5% of the maximum value for the overlay and blend images, respectively. The display scale of the FLI was determined visually for optimal visualization of the registration markers.
Coregistration and fusion of BLIs and MRIs were attained using an in-house macro (written by Y.M.) for the ImageJ software (National Institutes of Health, Bethesda, MD). The left-to-right and caudal-to-cranial directions on the optical image were defined as the x and y directions, respectively. The right side of the mouse appeared on the right and left of the dorsal and ventral optical images, respectively, and the right and left of the MRIs were reversed if needed. For displaying MRI images, in-plane resolution was doubled using interpolation, resulting in an in-plane pixel size of 0.13 × 0.13 mm2. The operator determined the × and y coordinates of the center of each marker in the MRIs and FLIs. Image registration was performed automatically by scaling and translation of FLIs so that the x and y coordinates of the three markers agreed best between FLI and MRI. Adjustment of rotation was attained carefully in data acquisition and was omitted in image processing. The same scaling and translation were applied to the corresponding BLIs, and the registered BLIs were fused with all MRI slices to generate a stack of fusion images.
Accuracy of Image Registration
Accuracy of image registration was evaluated using FLI and MRI of many markers attached to mice. For ventral imaging, 25 markers were attached to the ventral surface of the mouse abdomen. The operator sought to place markers at the points (i, j), where i = 10, 5, 0, −5, −10 mm; j = 15, 7.5, 0, −7.5, −15 mm; and i = 0 mm indicating the midsagittal position of the mouse. FLI in the ventral projection and MRI were performed successively with the (0, 0) marker located at the center of the imaging field for each image. MRIs were acquired with TE of 2.2 or 6.7 milliseconds. FLIs were obtained with FOV of 15, 20, or 25 cm. To evaluate the accuracy in dorsal imaging, we attached markers to the dorsal surface of the mouse abdomen and performed FLI in the dorsal projection. Three mice were studied for both ventral and dorsal imaging.
Image registration between FLI and MRI was performed using markers at (10, 7.5), (−10, 0), and (10, −7.5). The coordinates of the centers of the 25 markers were determined by an operator on the images registered spatially. The distance between the center of each marker on FLI and that on MRI was calculated as deviation and used as an indicator of misregistration. Average and maximal deviations were determined from 25 deviations for each image set. Means and standard deviations of the average and maximal deviations were calculated from the results of the three mice.
Application to SC Tumor Model Mice
Mice bearing SC tumors underwent integrated BLI-MRI repeatedly. Three mice were inoculated subcutaneously in the right side of the upper back with 1 × 10⁵ HCT116-Luc cells in 5 μL phosphate-buffered saline mixed with the same volume of Matrigel (BD Biosciences, San Jose, CA). Integrated BLI-MRI was performed 7, 11, 14, 21, and 28 days after inoculation. MRIs were acquired with TE of 6.7 milliseconds and without the injection of a contrast agent. BLI was done in the dorsal projection.
Assessment after Direct Cell Inoculation into the Liver
Tumor growth was observed longitudinally in three mice after direct cell inoculation into the liver. For cell inoculation, mice were anesthetized by isoflurane inhalation, and a horizontal abdominal incision was made. While observing the liver through the opening, we inoculated 1 × 10⁵ HCT116-Luc cells in 10 μL phosphate-buffered saline (without Matrigel) into the liver. We attempted to insert the needle into the liver at a level cranial to the incision to avoid possible effects of the surgical wound on light transmission. After removal of the needle, gentle compression was applied to the puncture point for about 15 seconds. The peritoneum and skin were closed with 6–0 nylon suture (Bear Medic, Ichikawa, Japan). Integrated BLI-MRI was performed 7, 10, 14, and 21 days after inoculation. MRIs were acquired with TE of 2.2 milliseconds and Gd-EOB-DTPA injection. BLI was done in the ventral projection. Additionally, ex vivo BLI was performed 23 days after cell inoculation to confirm luciferase-expressing lesions.19 At 10 minutes after the SC injection of 75 mg/kg
Results
Accuracy of Image Registration
When the accuracy of image registration was evaluated in mice with 25 markers on their surface, the registration error in ventral imaging was generally small. It tended to be larger for markers located in the peripheral portion of the imaging field than in the central portion (Figure 2). The means of average and maximal deviations ranged from 0.16 to 0.21 mm and from 0.38 to 0.58 mm, respectively (Table 1). In dorsal imaging, the registration error was also relatively large in the peripheral portion and larger than in ventral imaging. The means of average and maximal deviations in dorsal imaging ranged from 0.35 to 0.38 mm and from 0.74 to 0.83 mm, respectively. No clear dependence of the registration error on FOV in optical imaging or TE in MRI was found.
Representative results of the assessment of accuracy of image registration. Twenty-five markers were attached to the ventral (A) or dorsal (B) surface of a mouse. The FOV in optical imaging was 15 cm, and the TE in MRI was 2.2 milliseconds. The × sign represents the center of a marker determined on FLI, and the + sign represents that determined on MRI. The x and y axes correspond to the left-to-right and caudal-to-cranial directions, respectively.
Application to SC Tumor Model Mice
Fifteen integrated BLI-MRI studies were performed in three mice bearing SC tumors, and fusion images were created (Figure 3). Seven days after cell inoculation, in vivo BLI demonstrated definite light signals at the site of inoculation in all mice. MRI showed a distinct hypointense nodule, suggesting the development of a SC tumor, in one mouse. In the other two mice, although a small hypointense area indicative of a SC tumor was suspected, it was not discriminated confidently from hypointense nontumor structures. On the slice where the suspected hypointense lesion was delineated, image fusion revealed that the location of the MRI hypointensity matched with that of the BLI focus, consistent with the hypointensity representing a tumor lesion. Repeated integrated BLI-MRI demonstrated increased BLI signals and enlargement of the hypointense lesions on MRI. Good correspondence of lesion localization between BLI and MRI was shown in fusion images, indicating successful coregistration.
Representative images of integrated BLI-MRI in a mouse 7 (A), 11 (B), 14 (C), 21 (D), and 28 (E) days after SC inoculation of tumor cells. From the left to the right in each panel, the BLI overlaid on the photographic image, MRI, fusion image of blended BLI and MRI, and fusion image of overlaid BLI and MRI are presented. The color scale for BLI signals was optimized for each day after inoculation. On the photographic image, white lines indicating the central portion of the imaging field and three registration markers are noted. The markers were visualized in various slices of MRI, and only part of them are shown as bright spots in the presented images. The SC tumor in the right side of the upper back is delineated as a BLI focus and as a hypointense area in MRI, although the delineation of the hypointense area was not clear at 7 days. Fusion images indicate good correspondence of lesion localization between BLI and MRI.
Assessment after Direct Cell Inoculation into the Liver
Twelve integrated BLI-MRI studies were performed in three mice that received direct inoculation of tumor cells into the liver. In each of the three mice, two or more BLI foci were observed in the upper abdomen and intensified longitudinally, indicating proliferation of the inoculated cells (Figure 4). All slices of the BLI-MRI fusion images were observed to assess the structures on MRI that corresponded to the BLI foci. In all mice, part of or all BLI foci were underlaid by the liver and were interpreted as representing probable or definite hepatic lesions. In two mice, hepatic nodules were not identified on MRI even with the aid of the fusion images early after cell inoculation, and the presence of liver lesions was judged to be probable but not definite. It was assumed that tiny hepatic nodules were detected by BLI and missed by MRI. Later imaging demonstrated hepatic nodules on MRI corresponding to the BLI foci in all mice, supporting the interpretation of early imaging and indicating successful image registration.
Representative images of integrated BLI-MRI in a mouse 7 (A), 11 (B), 14 (C), and 21 (D) days after direct inoculation of tumor cells into the liver. Images are presented as in Figure 3. The liver is hyperintense because of the administration of Gd-EOB-DTPA. The markers are not apparent in the photographic images. BLI clearly shows multiple foci even 7 days after inoculation. BLI-MRI fusion suggests the presence of both intrahepatic and extrahepatic lesions. A hypointense liver nodule is evident on MRI performed at 14 and 21 days (black arrows) and corresponds well to a BLI focus. Hypointense lesions on the peritoneal wall (white arrows) can be identified with the aid of fusion images.
Based on BLIs alone, it was assumed that all tumors were within the liver. However, fusion images demonstrated that some BLI foci were located caudal to the liver in two mice, suggesting the presence of intraperitoneal lesions outside the liver. Extrahepatic lesions were not identified by observation of MRI alone early after cell inoculation. When the structures underlying the light signals on the mouse surface were assessed by serial observation of fusion images, some hypointense lesions near the anterior abdominal wall were recognized at the corresponding locations, and implantation of the inoculated cells on the peritoneal wall was suggested. Longitudinal imaging studies revealed the growth of the peritoneal lesions, supporting the validity of the preceding judgments. Ex vivo BLI confirmed liver tumors in all mice and peritoneal tumors attached to the anterior abdominal wall in the two mice.
Average and Maximal Deviation in Image Registration

FOV = field of view; TE = echo time.
FOV is that in optical imaging.
Discussion
In vivo BLI enables visualization of luciferase expression selectively, sensitively, and repeatedly and is widely used, especially for tumor monitoring.1,2 However, a lack of anatomic information hinders the identification of organs harboring luciferase-expressing lesions and the assessment of lesion morphology. Fusion of BLI images with x-ray images20,21 and fluorescent images of the reticuloendothelial system22 has been reported to aid lesion localization. MRI offers high-resolution tomographic images and clearly delineates various organs and lesions. In this study, we developed a practical method for integrated BLI-MRI and applied it to tumor monitoring in mice. BLIs and MRIs were successively acquired for mice fixed on a dedicated imaging holder and were coregistered using three small markers that were visible on FLI and MRI. The BLI was fused with all MRI slices to aid comparison of BLIs and MRIs by the observer. This method achieved acceptable image registration. Longitudinal assessment of mice inoculated with luciferase-expressing tumor cells was feasible, and integrated BLI-MRI appeared to be useful for detailed interpretation of the imaging findings.
In BLI, we acquired two-dimensional surface images with a standard CCD camera system for in vivo imaging. Because the MRI unit used was small and installed close to the CCD camera system, the transfer of the mouse from the CCD camera system to the MRI unit was easy. Although the relatively low magnetic field (1 T) is a limitation of this MRI unit, it can provide useful anatomic information in a reasonable scan time14 and, considering its convenience, appears to be suitable for supplementing optical imaging. Entire imaging procedures of integrated BLI-MRI, from the start of induction of anesthesia to the end of data acquisition, were done by a single operator and took about 30 minutes. This duration would be acceptable for detailed evaluation.
We placed three markers containing fluorescent quantum dots and MRI contrast agents on the mouse surface for coregistration between BLI and MRI. BLI and FLI can be performed using the same CCD camera and with the mouse position unchanged, guaranteeing identical geometry. Quantum dots are stable, bright fluorophores with tunable fluorescence emission and broad excitation spectra.23,24 To minimize background signals in FLI, we used quantum dots showing near-infrared emission and excited them by short-wavelength light. Although autofluorescence is relatively weak in the near-infrared region, chlorophyll and its metabolites in the intestine can cause strong autofluorescent signals.25 Short-wavelength excitation light cannot penetrate tissues for a long distance, resulting in selective excitation of superficial fluorophores in the marker. The markers were often unclear on photographic images; however, they were clearly visible on FLI and MRI for more than 3 months, permitting successful image registration. Registration was attained only by scaling and translation, and rotation was not incorporated into the data processing. The effect of variable rotation was readily avoided in data acquisition with the aid of positioning devices, and our preliminary tests suggested that incorporating rotation did not substantially improve the accuracy of registration.
Static magnetic field inhomogeneity and gradient field nonlinearities cause geometric distortion in MRI.17 In optical imaging, differences in the camera-object distance cause differences in magnification in a given image, leading to geometric distortion.18 In addition to these distortions, uncertainty in operator-dependent determination of the center of the marker may result in misregistration. We imaged mice with many markers and evaluated the accuracy of image registration between optical imaging and MRI. The registration error was small in the central portion of the imaging field and larger in the peripheral portion. Positioning the target region of the mouse in the central portion of the imaging field should aid in reducing misregistration. The registration error was larger in dorsal imaging than in ventral imaging. The mouse body is thicker at the midsagittal positions than at the side positions, resulting in shorter camera-object distance. The difference in body thickness did not result in a varied camera-object distance in ventral imaging because the ventral surface was fitted to a flat plate. The larger registration error in dorsal imaging appears to be due to the effect of body thickness. Increased FOV for optical imaging was achieved by increasing camera-object distance, and this may reduce the relative contribution of the difference in body thickness. However, the registration error did not decrease with increasing FOV, which may be because of blurring of the optical images. Incorporation of distortion correction for optical imaging and MRI and automated identification of the marker center remain to be investigated to attain more accurate image registration in a larger portion of the imaging field. In addition, it should be noted that the registration error evaluated in this study indicates the error on the mouse surface. Light from a deep source reaches the body surface after complex propagation in the tissues, and the location on the surface where light signals are detected may not be just above the actual light source.
We applied integrated BLI-MRI to the longitudinal assessment of SC tumors. Fusion images indicated agreement in location between BLI foci and MRI hypointense nodules regardless of tumor size, and acceptable accuracy of coregistration was confirmed for actual mouse tumor monitoring. Although the location of the SC tumor was roughly predictable from the site of cell inoculation, it was difficult to confidently localize small tumor lesions based on MRI alone. BLI signals are selectively derived from luciferase-expressing cells and can be reliably identified even at an early stage. In this study, fusion with BLI improved our confidence in determining tumor lesions in MRI early after cell inoculation.
Localized liver tumors can be created by direct cell inoculation into the liver.26 To assess the potential of integrated BLI-MRI, we evaluated disease progression longitudinally using integrated BLI-MRI in mice inoculated with luciferase-expressing tumor cells directly into the liver. In vivo BLI clearly revealed proliferation of tumor cells, even early after inoculation; however, it did not allow us to correctly determine the structures harboring the tumors. BLI-MRI fusion images aided the anatomic localization of lesions demonstrated by BLI and showed the presence and gradual progression of tumor lesions in the liver and on the anterior abdominal wall. It is assumed that some tumor cells escaped from the liver into the peritoneal cavity and implanted on the abdominal wall. MRI showed complex signals in the peritoneal cavity and often delineated hypointense areas mimicking tumor lesions, which hindered the definitive identification of intraperitoneal tumors. When MRI alone did not indicate tumor lesions, the locations corresponding to the BLI foci were carefully evaluated on each slice of MRI with the aid of the integrated BLIs and MRIs. Because the BLIs were two-dimensional and did not allow determination of the depth of a light source, the observer had to select the MRI slice corresponding to the BLI focus visually. However, the interpretation procedure definitely improved the recognition of tumors in MRI, especially those tumors on the abdominal wall. Fusion images also aided confident discrimination between tumor lesion and nontumor hypointense areas in MRI. Integrated BLI-MRI was indicated to enhance capabilities of BLI and MRI, each supported by the other.
Our results suggest that compared to BLI and MRI performed separately, integrated BLI-MRI permits more detailed and confident image interpretation in the longitudinal evaluation of mice bearing luciferase-expressing tumors. When the method is applied to the assessment of therapeutic effects, it may be beneficial that each animal is well characterized at baseline, including in terms of the identification of involved organs. Tumor burden in each organ can be assessed repeatedly from the signal intensity measured on BLI and from the lesion size measured on MRI. Quantitative evaluation using BLI appears to provide an index of viable tumor load excluding the contribution of necrotic tissues, which should be beneficial for the assessment of therapeutic effects.6 However, depth-dependent attenuation of signals impairs the quantitative accuracy of BLI assessment, and the diffuse nature of BLI signals may hamper organ-based analysis. Combined quantitative assessment using both BLI and MRI is expected to contribute to rigid determination of therapeutic efficacy. BLI has various applications other than tumor monitoring,3,4 in which integrated BLI-MRI may also play a role.
We used a conventional two-dimensional method for BLI and showed the usefulness of the integration of two-dimensional BLI with three-dimensional MRI. Because two-dimensional BLI cannot define the depth of a light source, the BLI focus cannot be localized on MRI uniquely. Moreover, the location of a light focus visualized on a BLI represents that of the mouse surface where the light arrives after complex propagation through tissues and may not be just above the actual light source. Fusion of FLI tomography with MRI has been shown to allow the assessment of the distribution of fluorescence-labeled cells in the tumor.27 Although our integrated BLI-MRI serves as a guide in interpreting MRI and appears to be helpful in identifying the structures on MRI corresponding to the BLI focus, fusion of BLI tomography with MRI would further facilitate identifying the light source.
In conclusion, we developed a practical method for integrating two-dimensional BLI with MRI to add anatomic information to BLI. Successful image registration was achieved around the center of the imaging field, although the registration error increased with increasing distance from the center and was larger in dorsal imaging than in ventral imaging. In mouse tumor monitoring, integrated BLI-MRI aided the anatomic localization of lesions demonstrated by BLI. With the aid of BLI findings, some lesions that were not detected based on MRI alone were recognized in MRI, and confidence in the interpretation of MRI findings improved. Integrated BLI-MRI proposed in this study should offer benefits over BLI alone plus MRI alone during a reasonable experimental time and is expected to enhance the utility of both BLI and MRI in small animal experiments.
Footnotes
Acknowledgments
We thank Dr. Takashi Nakaoka for his help in the animal experiments.
Financial disclosure of authors: This work was supported in part by a Grant-in-Aid for Scientific Research from the Ministry of Education, Culture, Sports, Science and Technology of Japan. Tomoyuki Haishi is President of MRTechnology, Inc., the vendor of the MRI system used in this study.
Financial disclosure of reviewers: None reported.