
Abstract
We investigated whether small-animal positron emission tomography (PET) could be used in combination with computed tomography (CT) imaging techniques for longitudinal monitoring of the injured spinal cord. In adult female Sprague-Dawley rats (n = 6), the ninth thoracic (T9) spinal cord segment was exposed by laminectomy and subsequently contused using the Infinite Horizon impactor (Precision System and Instrumentation, Lexington, KY) at 225 kDyn. In control rats (n = 4), the T9 spinal cord was exposed by laminectomy but not contused. At 0.5 hours and 3, 7, and 21 days postinjury, 2-[18F]fluoro-2-deoxy-
FOLLOWING DAMAGE to the mammalian spinal cord, a series of degenerative and regenerative events at the site of injury determines the neurologic outcome.1,2 Endogenous repair occurs in the injured spinal cord,3,4 but the destructive events are imperious, resulting in loss of function with poor clinical prognosis.
It is generally accepted that meaningful functional recovery after spinal cord injury may be achieved through a combination of precisely timed interventions. 5 To determine the accurate timing of individual treatments, detailed knowledge about the temporal profile of physiologic and cellular events within the injured spinal cord is imperative. Currently, such information is being collected from tissue from large numbers of experimental animals, which is costly and labor intensive.
Since the early 1990s, positron emission tomography (PET) imaging techniques have been used for noninvasive diagnosis of metabolic changes related to a variety of diseases.6,7 The relatively low spatial resolution of PET imaging makes it difficult to accurately determine the anatomic location of regions of interest (ROIs). This problem can largely be solved by superimposing images acquired by PET and computed tomography (CT).8,9 Technically, it is now possible to obtain PET images of small animals using dedicated small-animal PET scanners, which is especially important for preclinical research.10–13 This has opened new avenues for serial diagnosis and measurement of physiologic events in the intact and injured brain and spinal cord of small animals.
PET acquires physiologic images based on the detection of pairs of 180° emitted γ-rays with 511 KeV energies from the annihilation of positrons emitted from an administered radiotracer such as 2-[18F]fluoro-2-deoxy-
We investigated whether [18F]FDG-PET combined with registered CT images could be used for serial evaluation of physiologic events in the contused adult rat spinal cord. We developed a reliable method that includes strategically placed fiduciary markers, 19 allowing accurate alignment of metabolic [18F]FDG-PET images with high-resolution anatomic CT images of the contused spinal cord. This method may become an important diagnostic tool for the development of effective spinal cord repair strategies.
Materials and Methods
Animals
Adult female Sprague-Dawley rats (250-275 g; Harlan, Indianapolis, IN) were housed within a double-barrier facility at Johns Hopkins Medical School according to guidelines by the National Institutes of Health and the US Department of Agriculture. The air in the cages was continuously refreshed, and water and food were available ad libitum.
Surgery Preparation and Contusion Injury
The institutional Animal Care and Use Committee of Johns Hopkins University approved all animal procedures. The rats were anesthetized with an intraperitoneal injection of 60 mg/kg ketamine and 0.4 mg/kg medetomidine hydrochloride (Domitor, Pfizer Animal Health, Exon, PA), and their backs were shaved and aseptically prepared. Lacrilube (Allergen Pharmaceuticals, Irvine, CA) was applied to their eyes to prevent drying. During surgery, the rats were kept on a heating pad to maintain body temperature at 37 ± 0.5°C.
A laminectomy was performed, without damaging the dura mater, at the eighth thoracic vertebra (T8) to expose the underlying T9 spinal cord (n = 6). Next, using the Infinite Horizon impactor (Precision System and Instrumentation, Lexington, KY), the T9 spinal cord was contused using a force of 225 kDyn. Consistency between rats was confirmed using the records of the compression rate and velocity of the impactor. In control rats (n = 4), a T8 laminectomy was performed, but the underlying T9 spinal cord was not contused. Two uninjured rats (ie, they did not receive a laminectomy or a contusion) were employed solely for visualization of the used coregistration approach (see below). After injury, the overlying muscles were closed in layers with 5.0 sutures and the skin was closed with 4.0 sutures. Next, the rats received 1.5 mg/kg atipamezole hydrochloride (Antisedan, Pfizer Animal Health) and 10 mL of Ringer solution subcutaneously and were kept in a small-animal incubator at 37 ± 0.5°C. After full recovery, the rats were returned to their cages with water and food available ad libitum. Gentamicin (6 mg/kg; Buck, Inc., Owings Mills, MO) was administered intramuscularly daily for 1 week. Buprenorphin (0.03 mg/kg; Buprenex, Reckitt Benckiser Pharmaceuticals Inc., Richmond, VA) was given subcutaneously daily for the first 3 days postinjury. The bladders were expressed manually twice a day until bladder function returned. Throughout further survival, the bladders and the general health of the rats were monitored at least twice a day.
Imaging Preparation and [18F]FDG-PET and CT Scanning
At 0.5 hours and at 3, 7, and 21 days postinjury, the rats received [18F]FDG (48.1 MBq/kg; PETNET Pharmaceuticals, Inc. Baltimore, MD) via injection into their tail vein. Before receiving this injection, the rats were starved overnight to equalize plasma glucose levels. The radioactivity in the syringe was recorded before and after the injection as (A1, t1) and (A2, t2). The awake rats were kept in their cage for 1 hour, after which they were anesthetized using 1 to 2% isoflurane mixed with oxygen and gently placed in the supine position on top of paper towels on the PET imaging bed. The rats were firmly immobilized on a specially made imaging bed using adhesive tape. Six chlorine beads (0.4-0.7 mm in diameter; Bio-Rad Laboratories, Hercules, CA) soaked with 37 MBq [18F]FDG were attached to the adhesive tapes at different locations but at least 3 mm away from the skin of the rat to avoid interference with activity inside the animal.
We used a small-animal PET scanner (GE Healthcare eXplore Vista dual-ring PET, Piscataway, NJ) 20 and a CT scanner (CT subunit of Gamma Medica XSPECT/CT; Northride, CA) for imaging. The first imaging session was performed 1.5 hours after injury. PET scanning was performed in the whole-body acquisition mode with five bed positions each with 61 0.78 mm thick transaxial slices spanning 48 mm. There are six overlapping slices between adjacent bed positions. A 250 to 700 KeV energy window was used for data acquisition. The total scanning duration was 30 minutes. After scanning, the PET imaging bed with the rat attached was transferred to the CT scanner.
The CT projection data were acquired with the x-ray tube settings of 75 kV and 240 mA and continuous rotation mode for a total scanning time of 5 minutes. They were then rebinned into 512 projections. The object-to-detector distance was 64 mm, and the object-to-x-ray distance was 225 mm. During both scanning procedures, the rats were kept anesthetized with 1 to 2% isoflurane mixed with oxygen, and their body temperature and respiratory rate were monitored. Importantly, the rat and the strategically placed beads remained fixed at all times. This allowed accurate superimposition of the PET and CT images. All PET and CT scans were taken at the same time of the day. After the CT scan, the rats were returned to their partially warmed cage with water and food available ad libitum. No adverse side effects were noted while performing these procedures at the four time points. After the final imaging procedure, the rats were fixed and the spinal cord was removed and processed for toluidine blue-stained 1 μm thick plastic sections as described previously. 21
Processing of [18F]FDG-PET and CT Images
The [18F]FDG-PET data were reconstructed using a two-dimensional OS-EM algorithm with 0.39*0.39*0.78 mm3 pixel size and six iterations and 16 subsets, which provided ≈1.3 mm resolution at the center and ≈1.7 mm resolution averaged over the field of view. The CT data were reconstructed using a three-dimensional cone beam Feldkamp algorithm, which provided a 0.15 mm central resolution and a 0.17*0.17*0.17 mm3 pixel size. The reconstructed PET and CT images were then coregistered using the strategically placed [18F]FDG-soaked beads as fiduciary markers. 19 Two corresponding sample transaxial slices from uninjured rats with the fiduciary markers are shown in Figure 1, A-1A″ and B-1B″. A rigid-body registration algorithm (from the GE VISTA PET system) using the transfer matrix was employed for the coregistration with a two pixel size maximum error.
The registered CT data were further transformed into attenuation maps using the bilinear transformation method. 22 The maps were adopted for CT-based attenuation correction. After attenuation and scatter corrections 23 using the MMWKS_VISTA V3.1 software (provided by the GE VISTA PET system), the PET images were used for ROI analysis.
Regions of Interest
A ROI was first located within the vertebral canal on the transverse CT image (Figure 2A). Next, the CT image was superimposed onto the corresponding coregistered PET image (Figure 2B), and the ROI was then copied from the CT onto the PET image (Figure 2C). The open-source software ImageJ (version 1.3.5., National Institutes of Health, Bethesda, MD) was used to place a ROI in each CT and PET image of the T6 and T9 spinal cord segments. [18F]FDG was measured in the ROI in each PET image within each of the two analyzed segments and summed to obtain a three-dimensional ROI.

[18F]FDG-soaked beads as fiduciary markers for coregistration of PET and CT images. Two transverse PET images of an uninjured rat in the supine position demonstrated two fiduciary markers (arrows), m1 (A), and m2 (B). The markers were generated from 0.4 to 0.7 mm large resin beads absorbed with 1 μCi [18F]FDG. In the PET images, the markers can easily be discerned as hot spots, but in the corresponding CT images, high contrast was applied to visualize the markers (arrows in A' and B'). The markers allowed precise superimposing the PET and corresponding CT images (A″ and B″). The bars to the right display a color code for intensity in PET and CT images. Intensity is given in arbitrary units with a minimum of 0 and a maximum of 100. Arbitrary units were used as the image intensity range depends on the scale value used in the reconstructions. The middle bar of the three displayed relates to the panels in the middle column. The middle panels are intentionally overexposed. In this bar, the minimum is 0 and the maximum is 50.
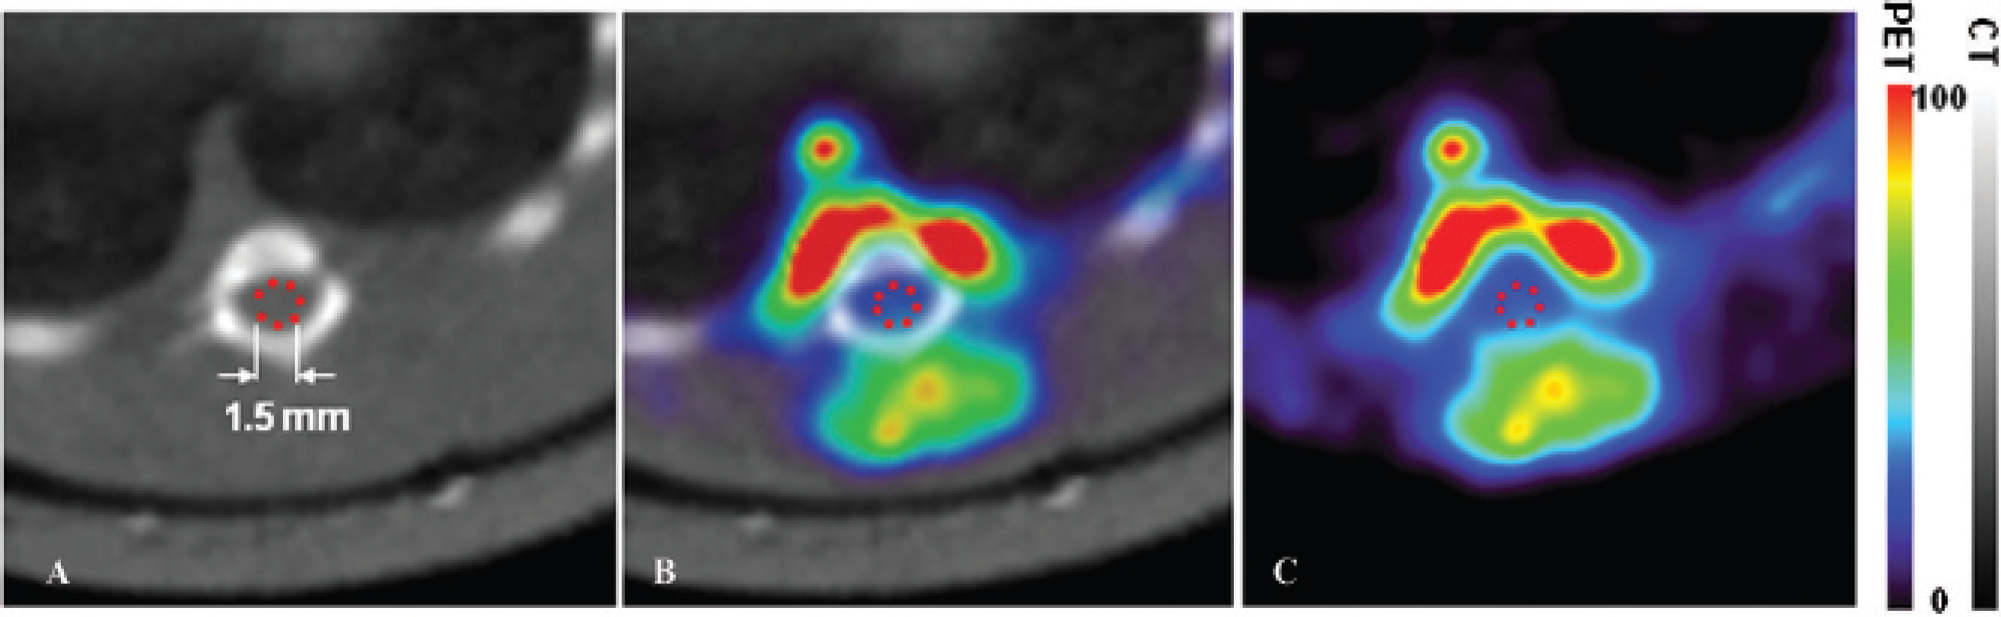
Defining region of interest (ROI) on transverse PET images. To accurately pinpoint the spinal cord on PET images for visualization and measurements, a transverse high-resolution CT image (A) of the T9 spinal cord segment was used and a red dashed circle (1.5 mm diameter) was placed in the center of the space within the vertebral column to mark the location of the spinal cord (the ROI). This CT image was then superimposed onto the coregistered PET image using the fiduciary markers (B), and the ROI was directly copied to the corresponding PET image (C). Activity in two spinal cord segments (three-dimensional ROI) was determined by adding up the activities of all two-dimensional ROIs within each segment. Bars on the right display color codes for intensity in PET and CT images. Intensity in arbitrary units with a minimum of 0 and a maximum of 100 for both bars.
Simulation-Based Partial-Volume Compensation
We found two hot spots in the T9 spinal cord segment, one ventral and one dorsal to the damaged spinal cord (Figure 3A). Because spill-over from these areas could affect our measurements in the ROIs within the vertebral canal, we developed a simulation-based partial-volume compensation (PVC) method. Monte Carlo simulation was used to generate two areas representing the hot spots (Figure 3B vs 3A). The ventral virtual area (area A) had a 2.2 mm inner radius and a 4.5 mm outer radius with a 5.4 mm height and covering 180°. The dorsal virtual area (area B) had a 2.0 mm inner radius and a 6.8 mm outer radius with a 5.4 mm height and covering 72°. The activity ratio between areas A and B was 1:0.53. From the simulation model, we were able to determine the fractions of the mean intensities in the ROIs that could be attributed to spillover from areas A and B (RA and RB, respectively). We then applied a simulation-based PVC method to determine mean image intensity within the ROI without the spillover effect, I
ROI
, that is,

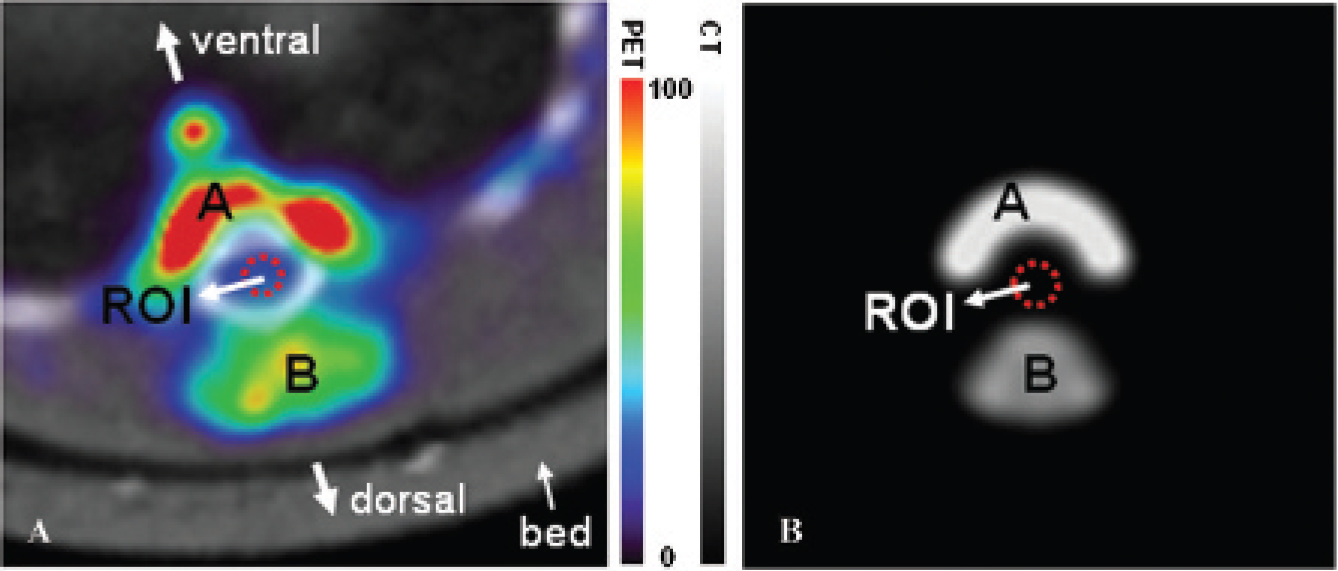
Monte Carlo simulation to determine spillover effect. The intensities, location, size, and shape of the hot regions near the spinal cord (region of interest [ROI]) were measured in rat images (A). Based on these measurements, two phantoms (area A and area B) were created using Monte Carlo simulation (B) to enable measuring the spillover effect from these hot areas into the ROI. Area A and area B were also simulated separately to determine the relative spillover from each of the areas. The bars between the panels present color codes for intensity in the merged PET and CT images in the left panel. Intensity is given in arbitrary units (minimum = 0, maximum = 100) for both bars.
Analysis of FDG Uptake in Spinal Cord
During the experiments, we recorded the initial and postinjection activities in the syringe at time t1 and t2 as (A1, t1) and (A2, t2), respectively. The radioactivity injected into the rats, calibrated at the acquisition starting time (t3), was calculated as follows:


Statistical Analysis
One-way analysis of variance followed by the Fisher protected least-significant difference test was used, and statistically significant differences were accepted at p < .05.
Results
Spillover Effect from Ventral and Dorsal Areas
The spillover effect was evaluated using Monte Carlo simulation. The mean image intensity ratio between areas A and B and the ROI was 1:0.53:0.28 in the rat images (see Figure 3A) and 1:0.53:0.1 in the simulated phantom images (see Figure 3B). The different image intensities within the ROIs in the rat and simulated phantom images, that is, 0.28 versus 0.1, can be interpreted as the contribution from spillover activity from the ventral and dorsal hot areas into the ROI, which is about 33% of the total image intensity in the rat images.
From the Monte Carlo simulation, we also found with only area A present that the ratio between the average image intensity of area A and the ROI (RA) was 1:0.07. With only area B present, the ratio between the average image intensity of area B and the ROI (RB) was 1:0.05. The RA and RB were used to correct the spillover effect from areas A and B into ROIs.
[18F]FDG-PET and CT Images of Contused Spinal Cords
The [18F]FDG-PET scans allowed the visualization and quantitization of glucose metabolism throughout the whole body of rats (Figure 4A). The corresponding CT scans provided the anatomic structure with high resolution (Figure 4B). Coregistration of the two images allowed precise localization of the ROIs (Figure 4C). High glucose metabolism was observed along the vertebra in contused rats (see Figure 4, A, C, and E). An area with high glucose metabolism was also found dorsal to the contused spinal cord (see Figure 4, A, C, and D). Between contused rats, the intensity in the area just dorsal to the injury was variable but always highest at 7 days postinjury (Figure 5).
[18F]FDG Uptake in the Contused Spinal Cord
At 2.5 hours after the contusive impact, damaged disorganized spinal cord nervous tissue was found at the injury epicenter (Figure 6A). At 7 days postcontusion, the tissue in the injury epicenter had further degraded and appeared loosely organized with some small cystic cavities (Figure 6B). At this time, macrophages had invaded the injury epicenter. At 21 days postcontusion, the size of the cystic cavities had drastically increased (Figure 6C). Macrophages were present, but large areas appeared filled with fluid rather than cells. In contused rats, the [18F]FDG uptake in the contused T9 spinal cord segments and in the T6 spinal cord segments (internal control) was quantified using the mean SUV in the ROIs (Figure 6D). In control rats, in which the T9 spinal cord segment was exposed by laminectomy but not contused, the [18F]FDG uptake was similarly quantified in the T6 and T9 spinal cord segments (see Figure 6). We found that at 3, 7, and 21 days postcontusion, SUVs for T6 and T9 were significantly (p < .05) higher than the corresponding SUVs in control rats. At 7 days postinjury, in the contused T9 segment, the SUV reached a peak at 1.56 ± 0.13 (n = 6, SEM) and was significantly higher (p < .05) than the SUV in the T6 segment (internal control; 1.23 ± 0.12 [n = 6, SEM]).

PET image, CT image, and the coregistered image of a rat with a contused spinal cord. Sagittal views (with dorsal on the left) of the rat at 7 days postinjury are shown as imaged in PET (A), CT (B), and a PET-CT coregistration (C). The arrowhead in A indicates a dorsal region of the contused T9 spinal cord with increased activity. The asterisk in B indicates the T8 vertebra from which the dorsal half was removed to expose (and contuse) the underlying T9 spinal cord. The two vertical double arrows in B indicate (from top) the T6 and T9 spinal cord segments. D and E show transverse images taken at the T6 and T9 spinal cord levels, respectively, as indicated by the two horizontal lines in C. Bars present color codes for intensity in the PET and CT images. Intensity is given in arbitrary units (minimum = 0, maximum = 100) for both bars.
Discussion
In the present study, we developed an approach to accurately obtain and combine PET and CT images of the injured adult rat spinal cord, which enables serial visualization and measurement of metabolic events. This approach is less labor intensive, and cost saving compared to the conventional way of collecting biologic tissue data on temporal changes in physiologic events within the injured spinal cord, which typically involves large numbers of experimental animals. This combined imaging approach may become integral to studying the evolution of spinal cord injury and document the effects of reparative strategies.
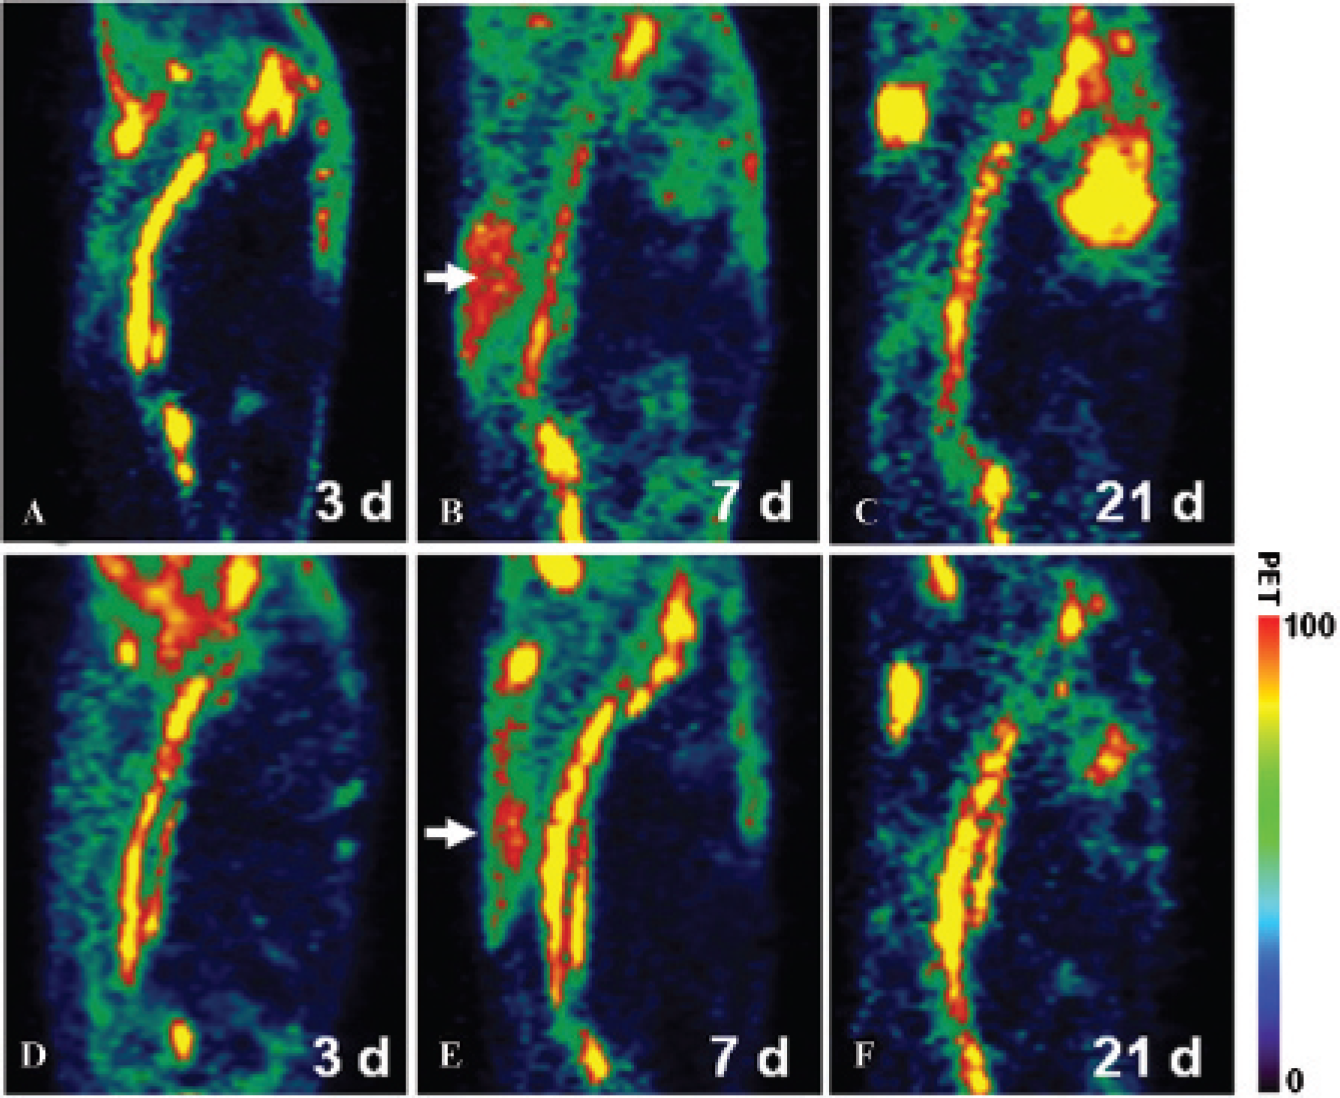
PET images of contused rats showing the high uptake area just dorsal to the T8-T9 vertebrae. Sagittal views (with dorsal on the left) of two rats (A-C and D-F) imaged at 3, 7, and 21 days, respectively. The white arrows indicate the region with high activity just dorsal to the contused spinal cord segment. The overall uptake in this region was variable between contused rats (B vs E) but always highest at 7 days postinjury. Bars present the color code for intensity in the PET. Intensity is given in arbitrary units (minimum = 0, maximum = 100).

[18F]FDG uptake in the contused (and uninjured) rat spinal cord measured using PET-CT imaging. Transverse toluidine blue-stained semithin plastic sections demonstrating the contusion epicenter at 2.5 (A), 7 (B), and 21 (C) hours postimpact. In these photographs, the dorsal aspect of the spinal cord is up. White asterisks indicate dorsal roots. At 7 (panel B) and especially at 21 (panel C) days postcontusion, the epicenter contains cystic cavities (black asterisks), a hallmark of spinal cord injury. The line graph (D) shows the standard uptake values (SUVs) in time in the contused T9 (solid-line triangle) and T6 (solid-line circle) spinal cord segments of contused rats. The SUVs in time in the T9 (broken-line triangle) and T6 (broken-line circle) spinal cord segments of control rats are also plotted. The error bars represent the standard error of the mean (SEM). In the graph, asterisks indicate significant differences (p < .05) between SUVs in T9 and T6 in contused rats. Double asterisks indicate significant differences (p < .05) between SUVs in T9 and T6 segments in contused and control rats. Bar = 500 μm for A to C.
The advantage of combining PET and CT images is that the high-resolution anatomic image acquired by CT24,25 can be used to accurately pinpoint anatomic structures on the PET image with its typical low resolution. However, to facilitate the identification of small anatomic structures, it is absolutely crucial to precisely superimpose the images. This is especially challenging because the PET and CT images are acquired from different scanners. We developed an approach based on (1) complete immobilization of the rat onto a specially made imaging bed compatible with both the CT and PET devices for approximately 35 minutes, the approximate time needed for consecutive scanning procedures, and (2) strategically placed [18F]FDG-soaked resin beads, which served as fiduciary markers 19 and were placed onto adhesive tape used for immobilization of the rat. We demonstrate that this novel approach enables excellent alignment of PET and CT images of the adult rat spinal cord with an approximate diameter of 3 mm.
The efficacy of our approach of combined PET-CT scanning for the injured rat spinal cord was evaluated using [18F]FDG, which is routinely used clinically for measuring glucose metabolic activity.8,9 We were able to detect changes in the level of [18F]FDG uptake within the contused T9 rat spinal cord over a 3-week period. Moreover, we were able to detect relatively small variations in [18F]FDG uptake between time points and between the contused and the uninjured segment (internal control) located about 8 mm rostral to the injury. Thus, our approach is accurate not only in pinpointing small anatomic structures but also in detecting relatively small metabolic changes within that small structure.
We found that the mean SUV in the T6 spinal cord segment of control rats was smaller than that in the T6 spinal cord segment of contused rats. The measurements in the T6 segment served as an internal control. It is known that a contusive injury can affect distant spinal cord segments.26,27 The precise nature of these effects is still unclear, but they likely include cell death, microglial activation, astrocyte activation, and macrophage invasion.26,27 These effects may explain the difference between [18F]FDG uptake in the T6 spinal cord segment in contused and control rats.
In the contused spinal cord segment, the [18F]FDG uptake gradually increased during the first week, reached its peak at 7 days, and receded during the subsequent 2 weeks postimpact. At this time, the mechanisms underlying the nature of this particular profile of [18F]FDG uptake in the contusion site are unknown. In our histologic preparations of the contused spinal cord segment, we observed a similar profile in macrophage presence, which has been described previously.28,29 It is possible that the profile of inflammatory cell presence in the contusion reflects the [18F]FDG uptake,30,31 but it cannot be excluded that other injury-related events also contribute. We are currently investigating whether our imaging approach can be employed to serially study inflammatory events in the contused spinal cord.
Measuring metabolic activity in a small ROI can be challenging if adjacent larger regions have also taken up the radiotracer because spillover from these “hot” regions may contribute and interfere with the measurement in the targeted structure. In the adult rat spinal cord model we used in this study, two such hot regions were present ventral and rostral to the spinal cord (see Figure 2 and Figure 3). Possibly, the ventrally located hot region may have been due to high [18F]FDG uptake in the prevertebral venous plexus. The dorsally located hot region was likely due to injury-related events as it was detected only in contused rats, not in uninjured rats. To account for likely spillover effects from these areas, we developed a PVC method based on Monte Carlo simulation. With this, we determined that about 33% of the activity measured in the spinal cord region was spilled over from the neighboring hot regions. This spillover effect was accounted for in determining the final activity measurements.
The present study was designed to investigate whether PET and CT could be combined to image and measure physiologic changes in the contused adult rat spinal cord. We developed a reliable approach to coregister PET and CT images and to longitudinally quantify activity in the contused spinal cord. Thus, PET-CT imaging can be employed for serial documentation of metabolic changes in the contused adult rat spinal cord. This approach is less labor intensive than conventional methods and thus has the potential to become an investigative tool for the evolution of spinal cord and brain injury sites and the effects of reparative interventions.
Footnotes
Acknowledgments
We are grateful to James Fox and Gilbert Green for assistance in PET and CT scanning.
Financial disclosure of authors: This work was supported by grants from the Netherlands Organization for Scientific Research (017.001.265) and the National Cancer Institute (U24 CA92871). Further support was provided by the Radboud University Department of Neurosurgery at the University of Nijmegen, the Netherlands, the Kennedy Krieger Institute in Baltimore, and the Department of Physical Medicine and Rehabilitation at the University of Pittsburgh.
Financial disclosure of reviewers: None reported.