
Abstract
Low back pain is a prevalent medical condition that is difficult to diagnose and treat. Current imaging methods are unable to correlate pain reliably with spinal structures, and surgical removal of painful damaged or degenerating disks is technically challenging. A contrast agent specific for the intervertebral disk could assist in the detection, diagnosis, and surgical treatment of low back pain. The styryl pyridinium (FM) fluorophores were characterized and structure-activity relationships between chemical structure and in vivo uptake were established. Two novel FM fluorophores with improved optical properties for imaging the intervertebral disks were synthesized and evaluated in mice, rats, and pigs. After a single systemic injection, eight of eight FM fluorophores provided high-contrast imaging of the trigeminal ganglia, whereas six of eight provided high-contrast imaging of the dorsal root ganglia. Unexpectedly, three of eight FM fluorophores provided high-contrast imaging of annulus fibrosus tissue of the intervertebral disks, confirmed histologically. We present the first known contrast agent specific for the intervertebral disks and identify the chemical structural motif that mediates uptake. FM fluorophores could be used for image-guided surgery to assist in the removal of intervertebral disk and lay the foundation for derivatives for magnetic resonance imaging and positron emission tomography.
LOW BACK PAIN is a common health problem in industrialized societies with a lifetime prevalence of almost two-thirds.1–3 Studies suggest that low back pain originates from a number of spinal structures; however, the most common sources of pain are musculoligamentous injuries and age-related intervertebral disk degeneration.2–4 The intervertebral disk consists of the nucleus pulposus, annulus fibrosus, and cartilaginous end planes. Its composition changes significantly with age, creating difficulty in differentiating structural changes related to age versus those associated with degeneration and back pain.3,5
Disk structure can be accurately visualized with both computed tomography (CT) and magnetic resonance imaging (MRI); however, the correlation between disk morphology and back pain origin is poor.6,7 Current imaging methods are fundamentally limited owing to their morphologic assessment of functional changes that occur months to years earlier,7 as well as a lack of contrast agents specific for the disk tissues. Low back pain associated with disk degeneration is thought to be due to increased innervation of the annulus fibrosus.8 When a tear in the annulus fibrosus exists, the tear can be visualized using regional contrast enhancement with CT or MRI.3,6
Nonsurgical treatments for low back pain stemming from degenerating disks are often unsuccessful, and nonresponding patients are typically treated with surgical intervention. The two main surgical techniques used to treat disk degeneration are lumbar fusion and, more recently, total disk replacement. Both techniques rely on image guidance and clear visualization of the nucleus pulposus and annulus fibrosus,9–14 although, presently, contrast agent-specific intraoperative imaging of these structures is not performed.
In the current study, the styryl pyridinium (FM) fluorophore class of molecules was characterized and the chemical motif responsible for intervertebral disk contrast was determined. FM 1–43 has been widely used to study synaptic vesicle recycling, where changes in fluorescence were used to measure membrane uptake and exocytosis.15–17 FM 1–43 has also been investigated in conjunction with sensory cells and neurons and found to fluorescently label hair cells, Merkel cells, muscle spindle organs, taste receptors, and nociceptors such as the dorsal root ganglia and trigeminal ganglia.18 Because the FM class of fluorophores is known to show uptake into a variety of nervous and nonnervous structures after intraperitoneal (IP) administration,18 this study focused on defining a formulation that could be used for intravenous (IV) injection, on measuring the physicochemical and optical properties of the fluorophores, on determining optimal dosing and kinetics for tissue-specific uptake, and on quantifying the performance of the most promising fluorophores during fluorescence-guided surgery.
Materials and Methods
Reagents
Commercially available FM lipophilic styryl pyridinium fluorophores were purchased as lyophilized powders from Invitrogen (Carlsbad, CA) and stored at room temperature, protected from light. Fluorophores were solubilized in dimethyl sulfoxide (DMSO) at a concentration of 10 mg/mL prior to experimental use and stored frozen at −80°C. Pam800 was synthesized as described in detail previously19 and diluted in phosphate-buffered saline (PBS), pH 7.4, prior to IV administration. NeuroTrace deep red was purchased from Invitrogen and stored protected from light at −20°C. 4′,6-Diamidino-2-phenylindole dihydrochloride (DAPI) was purchased from Sigma-Aldrich (St. Louis, MO), dissolved in DMSO, diluted to 5 μg/mL in PBS, and stored protected from light at 4°C.
Chemical Synthesis of Novel FM Fluorophores
GE003097 and GE003098 were synthesized by the condensation of N-alkyl-4-picolinium salts with 4-N,N-dibutylamino benzaldehyde and 1-(4-N,N-dibutylaminophenyl)-1,3-pentadien-5-al, respectively, following a modified literature procedure (Figure 1).20,21 The required picolinium salts were prepared by the alkylation of 4-picoline with the corresponding 3-bromopropyltrialkyl ammonium bromide following a modified literature procedure.22 Ring opening of pyridine with cyanogen bromide gave the iminium salt
(E)-N-Methyl-N((2E,4E)-5-(Methyl(Phenyl)Amino) Penta-2,4-Dienylidene)Benzenaminium Bromide (1)
To a solution of N-methylaniline (30 g, 140 mmol) and pyridine (11.2 g, 140 mmol) in diethylether (100 mL) at 0°C was added a solution of cyanogen bromide (14.8 g, 140 mmol) in ether (40 mL) dropwise. The mixture was warmed to 20°C, and within 15 minutes, a red oil began to separate. Exothermic (30°C) crystallization ensued, and the red solid mass was left to stand at room temperature overnight. The crystalline mass was filtered and washed with cold ether under N2, and the hygroscopic salt was used in the next step without further purification. The yield was 47.7 g (95%).
(2E,4E)-5-(Methyl(Phenyl)Amino)Penta-2,4-Dienal (2)
A solution of the salt described above (47.7 g, 134 mmol) in methanol (MeOH) (240 mL) was added to a mixture of sodium hydroxide (6.2 g, 154 mmol), water (36 mL), and MeOH (85 mL). After the addition, enough water was added to keep the mixture just shy of forming a light yellow precipitate (≈ 300–350 mL water). The clear mixture was stirred at 30°C for 2 hours, at which time thin layer chromatography (TLC) analysis (ethyl acetate, silicagel 60) indicated complete conversion. The mixture was poured over saturated brine (1.2 L) at 15°C and extracted with benzene/Et2O 1/1 v/v (≈ 550 mL). The extract was thoroughly dried (Na2SO4), filtered from the drying agent, and diluted with petroleum ether (b.p. 35–60°C). On the addition of 1.2 L, a light yellow oil began to separate, which precipitated in long yellow needles. As the crystallization proceeded, more petroleum ether (1.2 L) was added gradually and the mixture was stored at −20°C overnight, filtered, and dried. The yield was 21.8 g (87%). Mass spectroscopy (MS) electrospray ionization (ESI+): 188(M + H+); 210 (M + Na+); 229 (M + H+ + CH3CN).
(2E,4E)-5-(4-(Dibutylamino)Phenyl)Penta-2,4-Dienal (3)
To a solution of the vinylogous amide 2 (1.135 g, 6.06 mmol) and dibutylaniline (1.43 g) in dry tetrahydrofuran (THF) (6 mL) at −20°C was added a solution of phosphorous oxychloride (1.08 g, 7.09 mmol) and dibutylaniline (1.03 g, 112 mmol) in THF (3.6 mL) dropwise at a rate to keep the mixture between −10°C and −20°C. Following the addition, the mixture was stirred at room temperature for 2 hours and at 50°C for 35 minutes. To the reaction mixture (a dark blue-green oil) was added petroleum ether (25 mL) and the mixture was triturated; the ether was separated and discarded. MeOH (4 mL) was then added and the mixture was neutralized with 2 M sodium hydroxide. Silicagel was then added, and the suspension was diluted with ethyl acetate and MeOH and dried to a solid on the rotovap. The crude product was purified by medium pressure liquid chromatography (MPLC) using hexanes-ethyl acetate 5 to 30% gradient to give the desired aldehyde as an intense yellow oil (225 mg, 13%). MS (ESI+): 285 (M+, 45%); 242 (100%); 200 (85%); 128 (30%); 118 (40%). Proton nuclear magnetic resonance (1HNMR) (CDCl3): 0.95 (t, J = 12 Hz, 6H); 1.35 (m, 4H); 1.45 (m, 4H); 3.8 (t, J = 9 Hz, 4H); 6.4, (d, J = 17 Hz, 1H); 6.5 to 6.8 (m, 3H); 7.1 (d, J = 15 Hz, 1H); 7.5 (d, J = 17 Hz, 1H); 7.8 (d, J = 11 Hz, 2H); 9.8 (s, 1H).

Organic synthesis of FM fluorophores 1−2−1 and 3−1−1. Synthetic schemes for (A) GE003097 (1−2−1) and (B) GE003098 (3−1−1).
4-Methyl-1-(3-(Triethylammonio)Propyl)Pyridinium Dibromide (4)
To an N2-flushed vial was added 3-bromopropyltrimethyl ammonium bromide (5.138 g, 13.56 mmol) and 4-picoline (1.27 g, 13.56 mmol), and the mixture was heated to 125°C in a tetraethylene glycol bath. The mixture became homogeneous in 5 minutes, and a salt started precipitating in 15 minutes. After 35 minutes of reaction time, the mixture was dissolved in boiling MeOH (8 mL) and layered with THF. The crystals were washed (4X) with cold THF and dried in a vacuum. The yield was 4.45 g (86%). MS (ESI+): 111 (M + H)2+.
4-((1E,3E,5E)-6-(4-(Dibutylamino)Phenyl)Hexa-1,3,5-Trienyl)-1-(3-(Triethylammonio)Propyl)Pyridinium Dibromide (5) (GE003097)
To a dry vial was added the salt
4-Methyl-1-(3-(Trimethylammonio)propyl)Pyridinium Dibromide (6)
To a N2-flushed vial was added 3-bromopropyltrimethyl ammonium bromide (4.972 g, 18.5 mmol) and 4-picoline (1.82 mL, 18.5 mmol), and the mixture was heated to 125°C in a tetraethyleneglycol bath. The mixture became homogeneous in 5 minutes, and a salt started precipitating in 15 minutes. After 35 minutes of reaction time, the mixture was dissolved in boiling methanol (8 mL) and layered with THF. The crystals were washed (4X) with cold THF and dried in a vacuum. The yield was 5.78 g (92%). MS (ESI+): m/z: 90 (M+H)2+.
(E)-4-(4-(Dibutylamino)Styryl)-1-(3-(Trimethylammonio)Propyl)Pyridinium Dibromide (7) (GE003098)
To a dry vial was added the salt
In Vitro Characterization of FM Fluorophores
Absorbance and fluorescence spectra of the FM fluorophores were measured in PBS and absolute MeOH using fiberoptic HR2000 (200−1100 nm) and USB2000FL (350−1000 nm) spectrometers (Ocean Optics, Dunedin, FL), respectively. Fluorescence excitation was provided by a 2 mW, 532 nm laser diode. The fluorescence and absorbance spectra of GE003097 and GE003098 were collected in DMSO and fetal bovine serum (FBS), as well as MeOH and PBS. The extinction coefficient of GE003097 and GE003098 was calculated at the excitation maximum in DMSO, MeOH, FBS, and PBS. The quantum yield of GE003097 and GE003098 in DMSO, MeOH, FBS, and PBS was measured by comparing the integrated fluorescence emission of the fluorophores in each solvent to the emission of Alexa Fluor 555 (Invitrogen) in PBS (quantum yield = 10%) as a reference standard under conditions of matched absorbance at the excitation wavelength. The log D of each FM fluorophore at pH 7.5 was calculated using Marvin 5.0.3 software (ChemAxon, Budapest, Hungary).
Animals
All animals used in this study were housed in an Association for Assessment and Accreditation of Laboratory Animal Care (AAALAC)-certified facility, staffed by full-time veterinarians, and were studied under the supervision of an approved institutional protocol. CD-1 mice of either sex, 8 to 10 weeks in age, weighing 28 to 30 g and Sprague-Dawley rats of either sex, 10 to 12 weeks in age, weighing 250 to 300 g were purchased from Charles River Laboratories (Wilmington, MA). Female Yorkshire pigs, 10 to 12 weeks in age, weighing 35 kg were purchased from E. M. Parsons & Sons (Hadley, MA). Prior to surgery, mice and rats were anesthetized with 65 mg/kg IP pentobarbital (Ovation Pharmaceutical, Inc., Deerfield, IL). Pig anesthesia was induced with 4.4 mg/kg intramuscular tiletamine-zolazepam (Telazol, Fort Dodge Labs, Fort Dodge, IA) and maintained with 2% isoflurane after intubation.
Intraoperative Fluorescence Imaging System
The intraoperative imaging system has been previously described in detail.24–26 The excitation and emission light-emitting diodes (LEDs) and filter used for the FM fluorophores and Pam800 in the intraoperative imaging system are described as follows. For fluorescence excitation of FM 1–43, FM 2−10, FM 1–43FX, and GE003098, 60 5 mm 470 nm LEDs (Epitex, Inc., Kyoto, Japan) fitted with 470 ± 20 nm bandpass (BP) excitation filters (Chroma Technology, Bellows Falls, VT) in custom holders were used, which produced a fluence rate on the imaging surface of 0.56 mW/cm2. For fluorescence excitation of GE003097, FM 4–64, FM 4–64FX, and FM 5–95, 60 5 mm 535 nm LEDs fitted with 525 ± 25 nm BP excitation filters were used, which produced a fluence rate on the imaging surface of 0.34 mW/cm2. A 610 ± 38 nm BP filter was used to detect fluorescence emission of FM 1–43, FM 2−10, GE003097, FM 1–43FX, and GE003098. To detect fluorescence emission of FM 4–64, FM 4–64FX, and FM 5–95, a 720 nm longpass (LP) filter was used. For fluorescence excitation of Pam800, 348 5 mm 760 nm LEDs fitted with 764 ± 17 nm BP excitation filters were used, which produced a fluence rate on the imaging surface of 8.73 mW/cm2, and fluorescence emission was detected using a 824 ± 24 nm BP emission filter. Fluorescence images were collected using exposure times ranging from 500 to 2,000 ms. All images collected for comparison between vehicle-injected control animals and FM fluorophore-injected animals had the same exposure time and normalization. Color video images were collected on a separate optical channel using custom-designed software.
Formulation, Dosing, and Kinetics for In Vivo Fluorescence Imaging
To assess the structure-activity relationship of the FM fluorophores, each molecule was administered at 5 mg/kg to mice18 and 0.5 mg/kg to rats (n = 4 per group) in 10% DMSO and 90% PBS IP 16 hours before imaging with the intraoperative system. The fluorescence signal from muscle tissue of FM fluorophore-injected animals was compared to that of vehicle-injected control animals and found to be nearly identical. The fluorescence signals from the spinal cord, intervertebral disks, dorsal root ganglia, trigeminal ganglia, optic nerve, brain, and femoral nerve were normalized to muscle signal in the same image. This normalization ratio was then compared between FM fluorophore-injected animals and vehicle-injected control animals. Positive contrast was concluded if the nerve to muscle contrast ratio of FM fluorophore-injected animals was elevated relative to control animals.
GE003098 was selected for further study after assessment of its structure-activity relationship. The kinetics and dose response following IV administration of GE003098 were studied in mice. Administration of 2 mg/kg, resuspended in 5% DMSO and 95% PBS, IV 2 to 4 hours prior to imaging was found to produce a similar contrast ratio to the 5 mg/kg IP administration 16 hours before imaging. GE003098 (2 mg/kg IV) and Pam800 (7.5 nmol in 500 μL of PBS IV) were administered to a male Sprague-Dawley rat for enhanced visualization of the intervertebral disks. Pam800 was administered 12 hours prior to GE003098. Four hours after administration of GE003098, the animal was sacrificed and its spine was removed. The spine was imaged simultaneously for Pam800 and GE003098 fluorescence; color video was also obtained at the same time.
GE003098 was also evaluated in two Yorkshire pigs. The administered dose of GE003098 was scaled from the mouse to the pig by body surface area, where the body surface area of the pig was estimated to be 271.7 times larger than that of the mouse, translating to a dose of 0.47 mg/kg. GE003098 was administered IV in 5% DMSO and 95% PBS to anesthetized pigs 4 hours before imaging. The pigs were monitored under anesthesia during the drug incubation period, after which the animals were sacrificed. The spine was imaged in vivo for GE003098, removed, and sectioned for further imaging.
In Vivo Optical Spectroscopy
GE003097 and GE003098 were evaluated in different mice by imaging their trigeminal ganglia with a Maestro small-animal multispectral imaging system (CRI, Woburn, MA). Agents were administered at 2 mg/kg in 5% DMSO and 95% PBS IV. At 4 hours, mice were anesthetized and sacrificed, and their trigeminal ganglia were exposed for imaging. A 467 ± 23 nm filter was used for excitation; the fluorescence emission spectra were collected between 515 and 1,000 nm at 10 nm intervals. The in vivo fluorescence spectra of GE003097 and GE003098 in the trigeminal ganglia were unmixed from the spectral signature of nearby muscle tissue using the software supplied by the manufacturer.
Histology and Microscopy
Tissues from mice, rats, and pigs were preserved for microscopic assessment and localization of fluorescence signal. Tissues were extracted from the animal and placed in 2% paraformaldehyde in PBS for 2 to 4 hours before mounting in Tissue-Tek OCT compound (Fisher Scientific, Pittsburgh, PA) and flash-freezing in liquid nitrogen. Each sample was cryosectioned (10 μm per slice); one slide was stained with hematoxylin and eosin (H&E) and a consecutive section was used for fluorescence microscopy. The disk and trigeminal ganglia tissue from a rat administered FM 1–43FX were stained with NeuroTrace deep red (1:150 dilution in PBS) according to the manufacturer's instructions and then costained with DAPI (5 μg/mL in PBS).
For ex vivo fluorescence microscopy, serial sections were imaged on a Nikon TE 300 microscope system equipped with a mercury excitation source (Chiu Technical Corporation, Kings Park, NY), an Orca-ER 12-bit camera (Hamamatsu, Bridgewater, NJ), and IPLab software (BD Biosciences, Rockville, MD) using the following excitation and emission filter combinations. To obtain fluorescence images of FM 4–64, the mercury light source was passed through a 540 ± 15 nm BP excitation filter, a 700 nm dichroic beam splitter, and a 720 nm LP emission filter. To obtain fluorescence images of FM 1–43FX and GE003098, the mercury light source was passed through a 460 ± 25 nm BP excitation filter, a 505 nm dichroic beam splitter, and a 610 ± 38 nm BP emission filter. To obtain images of NeuroTrace deep red, the xenon light source was passed through a 650 ± 22.5 nm BP excitation filter, a 680 nm LP beam splitter, and a 710 ± 25 nm BP emission filter. To obtain images of DAPI, the mercury light source was passed through a 360 ± 20 nm BP excitation filter, a 400 nm LP beam splitter, and a 460 ± 25 nm BP emission filter. Exposure times were adjusted between 5 and 2,000 ms for fluorescence images.
Results
FM Fluorophore Nomenclature and Properties
The chemical structures of FM fluorophores enable division of each molecule into left, middle, and right groups (Figure 2A). Each group has two or three available chemical motifs, resulting in 12 possible FM fluorophores (Figure 2B). The physicochemical and optical properties of the eight FM fluorophores tested in this study are shown in Table 1. All fluorophores had molecular weights ranging from 550 to 800 Da and a negative log D at neutral pH (except for GE003097). All fluorophores exhibited red-shifted excitation maxima in MeOH compared to PBS, but most emission maxima were similar in both solvents. FM fluorophores with the chemical structure x-2-x had significantly red-shifted emission compared to those with the structure x-1-x.
FM Fluorophore Physicochemical and Optical Properties

FM 1–43 = (E)-4-(4-(dibutylamino)styryl)-1-(3-(triethylammonio)propyl)pyridinium dibromide; FM 1–43FX = (E)-1-(3-((3-ammoniopropyl)diethylammonio)propyl)-4-(4-(dibutylamino)styryl)pyridinium trichloride; FM 2−10 = (E)-4-(4-(diethylamino)styryl)-1-(3-(triethylammonio)propyl)pyridinium dibromide; FM 4–64 = 4-((1E,3E,5E)-6-(4-(diethylamino)phenyl)hexa-1,3,5-trienyl)-1-(3-(triethylammonio)propyl)pyridinium dibromide; FM 4–64FX = 1-(3-((3-ammoniopropyl)diethylammonio)propyl)-4-((1E,3E,5E)-6-(4-(diethylamino)phenyl)hexa-1,3,5-trienyl)pyridinium trichloride; FM 5–95 = 4-((1E,3E,5E)-6-(4-(diethylamino)phenyl)hexa-1,3,5-trienyl)-1-(3-(trimethylammonio)propyl)pyridinium dibromide; GE003097 = 4-((1E,3E,5E)-6-(4-(dibutylamino)phenyl)hexa-1,3,5-trienyl)-1-(3-(triethylammonio)propyl)pyridinium dibromide; GE003098 = (E)-4-(4-(dibutylamino)styryl)-1-(3-(trimethylammonio)propyl)pyridinium dibromide; PBS = phosphate-buffered saline.
Spectral and Chemical Characterization of Novel FM Fluorophores
GE003097 and GE003098 were synthesized as shown in Figure 1. Their spectral properties were investigated in solvents with varied proton content, including DMSO, MeOH, FBS, and PBS (Figure 3). The emission spectrum of GE003097 was significantly affected by solvent environment as its emission maximum was blue-shifted over 100 nm when diluted in FBS compared to DMSO, MeOH, or PBS (see Figure 3A). The emission spectrum of GE003098 was less affected by solvent as its emission maximum was blue-shifted 35 to 40 nm in FBS compared to DMSO, MeOH, or PBS (see Figure 3B). The extinction coefficient was also distinct in the four solvents, with the extinction coefficient largest for both fluorophores in DMSO and MeOH compared to FBS or PBS. The fluorescence quantum yield was highest in FBS for both synthesized fluorophores, being 5 times higher in FBS for GE003097 and 10 times higher in the same solvent for GE003098. The spectral properties of both fluorophores were characterized in vivo in the trigeminal ganglia of mice. The emission spectra of both GE003097 and GE003098 were most similar to the emission spectra of the fluorophores in FBS (see Figure 3).
Tissue-Specific Uptake In Vivo and Structure-Activity Relationships
All eight FM fluorophores were tested for tissue-specific uptake in mice and rats. The simplest nontoxic and biocompatible IV formulation found to maximize FM fluorophore solubility (up to a 26.3 mM stock solution) was 5% DMSO and 95% PBS (data not shown). In preliminary experiments, the kinetics and dose response of GE003098 were evaluated in mice. GE003098 was administered at 1 and 2 mg/kg IV in 5% DMSO and 95% PBS 16, 8, 4, and 2 hours prior to imaging. Similar contrast was seen when GE003098 was administered at 2 mg/kg IV 2 and 4 hours prior to imaging or at 5 mg/kg IP 16 hours prior to imaging.
After IP administration to mice and rats, all eight FM fluorophores showed positive contrast in the trigeminal ganglia but none in the optic nerve or brain (Table 2). As an example of this contrast pattern, the trigeminal ganglia, optic nerve, and brain of a mouse administered FM 1–43FX are shown in Figure 4B. When the trigeminal ganglia nerves were examined microscopically, the ganglion cells identified by H&E staining had the strongest fluorescence signal (see Figure 4B). All FM fluorophores except FM 2−10 and GE003097 also showed positive contrast in the dorsal root ganglia but not in the spine in mice and rats. As an example, a rat administered FM 4–64 is shown in Figure 4A, with half of the vertebrae removed to expose the spine. The spine was cross-sectioned ex vivo so that two dorsal root ganglia were visible in a single tissue section. Similar to the trigeminal ganglia, when examined microscopically, significant fluorescence intensity was seen in the dense cellular regions of each dorsal root ganglion (see Figure 4A).
Structure-Activity Relationships of FM Fluorophores in Rodents


FM fluorophore chemical structures and nomenclature. A, FM fluorophores are composed of left, middle, and right positions, with one of up to three different chemical groups in each position. B, FM fluorophores are identified by name or shorthand notation corresponding to the chemical group (see A) in the left-middle-right positions. Of the 12 possible FM fluorophore combinations, 8 were tested in this study.

In vitro and in vivo spectral properties of GE003097 (1−2−1) and GE003098 (3−1−1). Absorbance spectra (left), fluorescence spectra (right), and summary of optical properties (bottom) for (A) GE003097 (1−2−1) and (B) GE003098 (3−1−1). In vitro measurements were performed in dimethyl sulfoxide (DMSO), methanol (MeOH), fetal bovine serum (FBS), and phosphate-buffered saline (PBS). In vivo measurements were collected from the trigeminal nerve of a mouse. Data are representative of three independent experiments.
Only three of the eight FM fluorophores, FM 1–43, FM 1–43FX, and GE003098, showed positive contrast in the intervertebral disks (see Table 2), and each of these fluorophores had the motif labeled “1” in the middle and right positions (see Figure 2). Thus, positive contrast in the intervertebral disk was generalized into the notation x-1−1. In contrast, six of the eight FM fluorophores showed positive contrast in the dorsal root ganglia. The two FM fluorophores that did not show positive contrast in the dorsal root ganglia did not have the same middle and right motifs (see Table 2); thus, the property for positive contrast in the dorsal root ganglia was generalized into the notation x-i-i, where i = 1 or 2. All eight of the tested FM fluorophores showed positive contrast in the trigeminal ganglia; therefore, it was not possible to determine which motif mediated specific uptake.
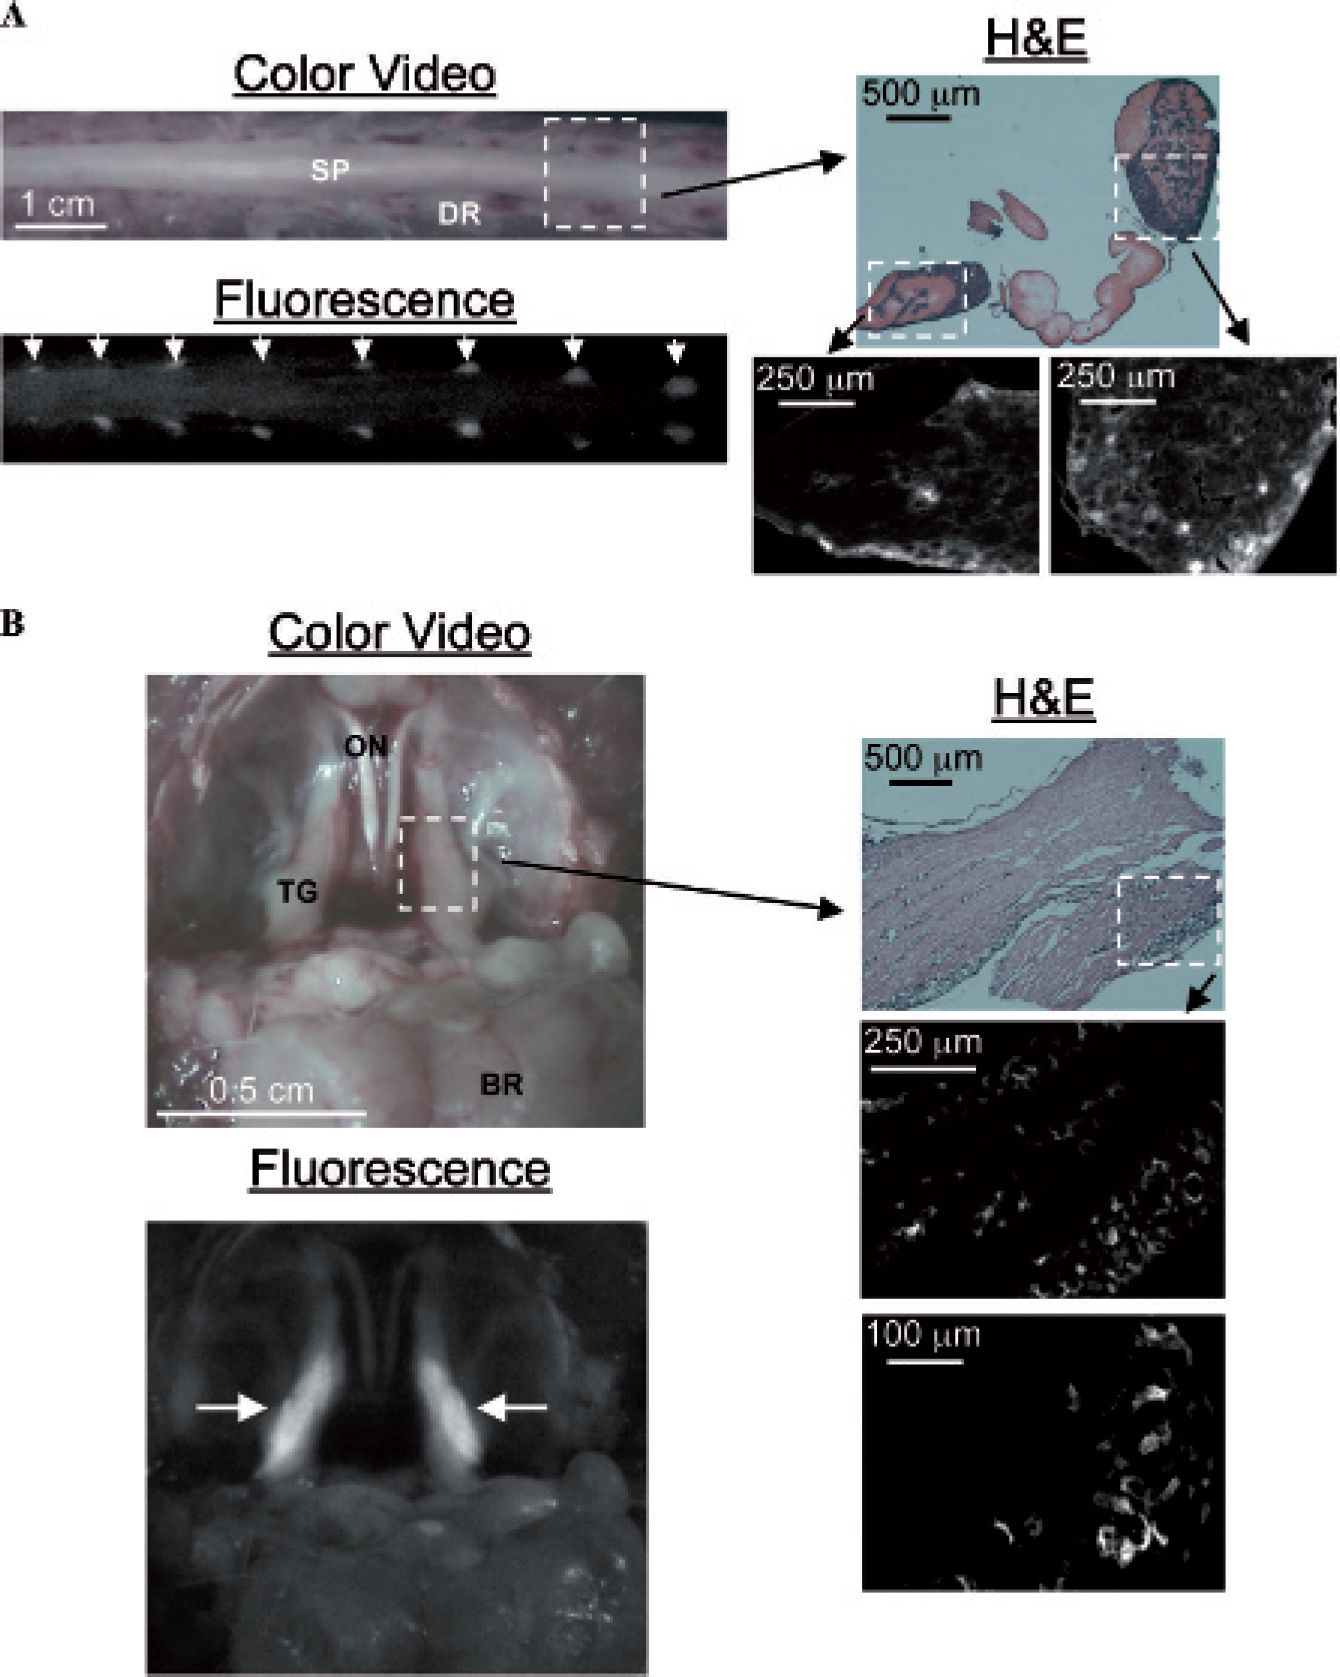
In vivo imaging of dorsal nerve root ganglia and trigeminal nerves. A, Color video and 810 nm fluorescence images of dorsal nerve root ganglia (DR; arrows) in rat 16 hours post-intraperitoneal (IP) injection of 0.5 mg/kg FM 4–64 (1−2−2). Shown at right is hematoxylin-eosin (H&E) histology for the area indicated by a white dashed rectangle, along with zoomed (within white dashed rectangles) 810 nm fluorescence images of consecutive unstained histologic sections. Data are representative of four independent experiments. B, Color video and 625 nm fluorescence images of the trigeminal ganglia (TG; arrows) in mouse 16 hours post-IP injection of 5 mg/kg FM 1–43FX (2−1−1). Shown at right is H&E histology for the area indicated by a white dashed rectangle, along with zoomed (within white dashed rectangles) 625 nm fluorescence images of consecutive unstained histologic sections. Data are representative of four independent experiments. BR = brain; ON = optic nerves; SP = spine.
Intervertebral Disk Fluorescence
The unexpected and interesting uptake of FM 1–43, FM 1–43FX, and GE003098 into intervertebral disks was investigated in more detail in rats and pigs. Pam800,19 a near-infrared fluorophore specific for hydroxyapatite of bone, was coinjected with GE003098 to ensure that the fluorescence signal seen in the spine was originating in the disks and not in the bone. As illustrated in Figure 5, GE003098 was specific for the intervertebral disks, which was seen when the disk was observed in situ in the sagittal spine as well as when an individual disk was observed in cross section. There was no overlap of pseudocolored signals from Pam800 and GE003098 (see Figure 5).
Simultaneous, two-wavelength imaging of the vertebrae and intervertebral disks. Resected spine of a rat 16 hours post-intravenous (IV) injection of 7.5 nmol Pam800 and 4 hours post-IV injection of 2 mg/kg GE003098 (3−1−1). Shown are color video image (top), 600 nm fluorescence for GE003098 (3−1−1; second row), 800 nm fluorescence for Pam800 (third row), and a pseudocolored (green for Pam800; red for GE003098 [3−1−1]) image of the two (bottom) as a sagittal section (left) or a cross section (right). Data are representative of three independent experiments.
Species dependency of GE003098 was further investigated in pigs. As shown in Figure 6, dramatic positive contrast was detected in the intervertebral disks. Sagittal and axial sectioning confirmed that the majority of the signal was emanating from the annulus fibrosus, not the nucleus pulposus. When disk sections were examined microscopically, the fluorescence pattern was punctate and linear following the lamellae structures of the annulus fibrosus and corresponding to cell-rich areas seen by H&E (see Figure 6).
Real-time intraoperative imaging of the annulus fibrosus in pig. Color video (left) and 600 nm fluorescence (right) in a pig 4 hours post-intravenous injection of 0.47 mg/kg GE003098 (3−1−1). Arrows indicate annulus fibrosus. Arrowheads indicate nucleus pulposus. After en bloc surgical resection, sagittal and axial images of the spine were acquired. Also shown (bottom) are hematoxylin-eosin (left) and 600 nm fluorescence (at 4× zoom) images of the annulus fibrosus from the same specimen. D = intervertebral disks; V = vertebrae.
Microscopic Examination of FM Fluorophore Tissue Specificity
The specific fluorescence pattern of the FM fluorophores in the intervertebral disk and trigeminal ganglia was further investigated for FM 1–43FX, one of three fluorophores that highlighted the intervertebral disk. Rat trigeminal ganglia and intervertebral disk tissues were examined microscopically for FM 1–43FX fluorescence following costaining with DAPI to locate the nuclei and NeuroTrace, a stain specific for the Nissl substance, which is abundant in neuronal cells. In both the intervertebral disk and the trigeminal ganglia tissues, the FM 1–43FX fluorescence signal was correlated with NeuroTrace and DAPI staining but was a subset of both (Figure 7). The NeuroTrace and DAPI fluorescence were more closely correlated to the FM 1–43FX fluorescence in the outer annulus fibrosus compared to the inner annulus fibrosus tissue. Both the neuronal and the ganglion cells of the trigeminal ganglia showed FM 1–43FX fluorescence, but only the ganglion cells and nuclei of the neuronal cells were stained by NeuroTrace (see Figure 7).
Tissue-specific microscopic examination of FM 1–43FX fluorescence. Intervertebral disk (top) and trigeminal ganglia tissue (bottom) sectioned at 10 μm from a rat 4 h post-intravenous injection of 2 mg/kg FM 1–43FX (false colored green). Tissues were stained with DAPI (false colored blue) and Neurotrace deep red (false colored red) ex vivo. FM 1–43FX images were overlayed with DAPI and Neurotrace images. The corresponding hematoxylin-eosin image is also shown (right) (X 100 original magnification).
The annulus fibrosus tissue can be classified into two main cell types based on phenotype. The outer annulus fibrosus consists mainly of fibroblast-like cells, whereas the inner annulus fibrosus consists mainly of chondrocyte-like cells.4,27 Although these cells morphologically resemble normal fibroblasts and chondrocytes, they can be distinguished according to their matrix component production, which has been studied extensively in culture.28,29 These differences have led to the proposal that the annulus fibrosus and nucleus pulposus should be considered specialized fibrochondrocytic cells.29 FM 1–43FX was shown to highlight both the fibroblast-like cells of the outer annulus and the chondrocyte-like cells of the inner annulus (see Figure 7) but did not highlight other fibroblast- or chondrocyte-derived tissues in the rat; thus, FM 1–43FX appears to be specific for the specialized fibrochondrocytic cells of the annulus fibrosus.
Discussion
Previous studies demonstrated that a single IP injection of FM 1–43 resulted in fluorescent labeling of hair cells, Merkel cells, muscle spindle organs, taste receptors, and nocioceptors, such as the dorsal root ganglia and trigeminal ganglia.18 In our study, all eight FM fluorophores tested resulted in uptake into the trigeminal ganglia (see Table 2), which served as a convenient positive control. By systematic measurement of structure-activity relationships, we were able to determine separate chemical motifs for dorsal root ganglia uptake (x-i-i; where i = 1 or 2; see Figure 2) and annulus fibrosus uptake (x-1−1). To the best of our knowledge, this is the first demonstration of a molecular imaging agent specific for the intervertebral disks and/or its substructures.
This unique property of the x-1−1 FM fluorophores was general across species as these fluorophores highlighted the intervertebral disks in mice, rats, and pigs (see Table 2, Figure 5, and Figure 6). Microscopic analysis revealed that GE003098 (3−1−1) uptake was punctate and linear following the lamellae structure of the annulus fibrosus. Identification of the cell type and/or structure corresponding to this pattern of fluorescence was further examined in the annulus fibrosus and trigeminal ganglia of FM 1–43FX containing rat tissue (see Figure 7). Given that the FM fluorophores with the notation x-1−1 only highlighted fibroblasts and chondrocytes in the annulus fibrosus, these fluorophores appear to be specific for the specialized fibrochondrocytic cells of the annulus fibrosus. Although not well understood at present, the intervertebral disks contain sensory innervation.8 To determine if the FM dye fluorescence in the annulus fibrosus was correlated with neurofilament, the annulus fibrosus and trigeminal ganglia tissues were stained ex vivo with antineurofilament. The FM dye fluorescence did not show correlation with the neurofilament antibody staining in either the annulus fibrosus or the trigeminal ganglia tissue (data not shown).
Surgical treatment for low back pain stemming from disk degeneration commonly requires diskectomy and complex surgical techniques. During these procedures, the disk is typically visualized through a combination of x-ray fluoroscopy and endoscopic white light because removal of the annulus fibrosus is essential.13 An optical contrast agent, such as GE003098, which could provide real-time image guidance during surgery and permit real-time confirmation that all tissue had been removed, might greatly improve lower back surgery. Optical contrast agents, such as GE003098, can now be visualized in the clinic using the FLARE (Fluorescence Assisted Resection and Exploration as developed by John V. Frangioni at Beth Israel Deaconess Medical Center, Boston, MA) intraoperative imaging system, which has already been validated in a clinical trial.30 The optical properties of GE003098, requiring blue light illumination and resulting in red fluorescence, are not optimal. Although a technical challenge, shifting excitation and emission into the near-infrared (ie, 700–900 nm) region would result in significantly higher sensitivity by enhancing signal to noise ratios.31 This could be accomplished by modification of the “x” chemical group while preserving the motif x-1−1. Once accomplished, visualization with the FLARE system during image-guided surgery would be feasible.
Presently, gold standard imaging to determine the cause of low back pain includes contrast-enhanced CT or MRI. However, the contrast agents employed by these modalities are not specific for the disk tissue and rely on diffusion into largely avascular structures. Healthy intervertebral disks show peak enhancement approximately 6 hours after administration of CT and MRI contrast agents, whereas peak enhancement in degenerating disks occurs at 12 hours.7 Peak contrast enhancement with the x-1−1 FM fluorophores was demonstrated 2 to 4 hours after administration, which suggests that if positron emission tomography (PET) or MRI derivatives could be synthesized, imaging could be performed within clinically realistic time frames. Once again, the x-1−1 motif provides a modifiable chemical group that could be optimized for 18F radiolabeling or gadolinium chelation. The importance of such an agent cannot be overstated because it is thought that a primary cause of disk degeneration is failure of the nutrient supply to disk cells.3 A PET or MRI contrast agent specific for the intervertebral disk, such as the x-1−1 FM fluorophores, would enable further study of disk disease to elucidate a mechanism based on cellular metabolism and/or nerve injury.
Footnotes
Acknowledgments
We thank Barbara L. Clough for editing, Lorissa A. Moffitt and Eugenia Trabucchi for administrative assistance, Kumar R. Bhushan for synthesis of Pam800, and Aya Matsui for assistance with the pig surgery.
Financial disclosure of authors: This work was funded by a Sponsored Research Agreement to the Beth Israel Deaconess Medical Center by General Electric Global Research. Drs. Siclovan, Fish, Tan Hehir and Ms. Barnhardt are employed at GE Global Research.
All intellectual property surrounding FLARE imaging technology is owned by the Beth Israel Deaconess Medical Center, a teaching hospital of Harvard Medical School. As inventor, Dr. Frangioni may someday receive royalties if products are ever commercialized.
Financial disclosure of reviewers: None reported.