
Abstract
A relatively simple, almost entirely noninvasive imaging-based method is presented for deriving arterial blood input functions for quantitative [18F]2-fluoro-2-deoxy-
ARTERIAL PLASMA TIME-ACTIVITY CURVES (TACS) are needed to quantitatively analyze positron emission tomography (PET) dynamic measurements of [18F]2-fluoro-2-deoxy-
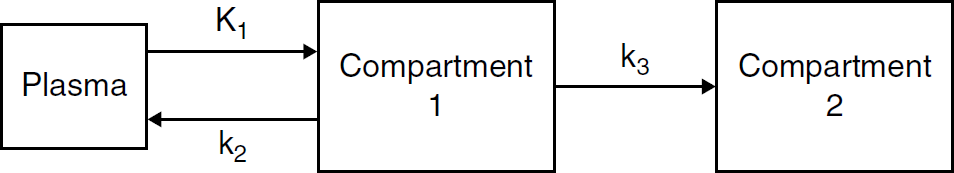
A two-tissue plus plasma compartmental model representing [18F]FDG kinetics in tissue. Compartment 1 represents [18F] FDG in tissue. Compartment 2 represents the phosphorylated FDG in tissue, that is, FDG-6-phosphate. K1 refers to the rate of delivery of [18F]FDG to tissue in units of volume of blood per volume of tissue per minute (mL/min/g), and k2 and k3 are the transport rate constants in units of 1/min.
Development of a practical method for accurately measuring the concentration of [18F]FDG in arterial blood at different time points in rodent studies has been an issue of debate and innovation for nearly a decade. Some research groups have successfully developed or used external probes or other tools4,5 to obtain an arterial blood TAC. As an alternative to the reference standard, other methods of estimating the arterial input function based on image processing and mathematical derivations have been proposed: (1) the factor analysis method, which begins by decomposing the dynamic sequences into component images and then extracting TACs corresponding to the blood component images based on the analysis of the variance in the data6–10; (2) image-derived input functions in which TACs are obtained by drawing regions of interest (ROIs) around different structures in the body, such as the left ventricle, and then correcting for partial volume and spillover11,12; (3) a population-based input function, also known as a standardized input function, assuming a standard input function obtained from a large population of similar subjects under the same experimental conditions 13 ; and (4) the simultaneous estimation method, based on a multiexponential time-activity function scaled to the measured activity concentration in a limited number of arterial blood samples. 14 A more detailed description of these methods was presented recently by Fang and Muzic. 12 However, all of the foregoing methods may be computationally complex and may still require drawing one or more arterial blood samples.
The early left ventricle TAC is considered to be an accurate representation of the time-dependent arterial blood [18F]FDG concentration, 15 whereas the area under the curve (AUC) of the liver TAC is sometimes used as an approximation of the AUC of the plasma TAC. 15 In addition, the liver TAC has an exponentially decaying part that can be represented by a multiexponential function similar to that of arterial blood. In fact, the liver has low [18F]FDG retention, and because it is highly vascularized, it may be considered to be representative of a blood-pool. The liver TAC has therefore been used as an alternative to serial arterial sampling for defining the input function.5,16 However, using the liver TAC alone to represent arterial blood input function for [18F]FDG studies has proven to be inadequate. 5 In this work, we propose a simplified image-derived input function (IDIF) that uses a combination of the early time points of the left ventricle TAC and the TAC of the liver at later times. Although in this work a single arterial blood sample taken at the end of the scan is used to normalize the liver TAC to that of the arterial blood, in practice, a single venous blood sample drawn at the end of the scan can be used instead. This method can be easily used by any researcher as it requires minimal basic knowledge in the field, such as ROI drawing and extraction of a venous blood sample, which can be done in mice via clipping the tail.
Materials and Methods
Mice Data
Mice data were downloaded from the Mouse Quantitation Program (MQP) database from the Crump Institute of Molecular Imaging at the University of California in Los Angeles (UCLA) (http://dragon.nuc.ucla.edu/mqp/index.html). 17 The image data sets available on the Web site are mostly dynamic PET images of mice (C57/BL6) after a bolus IV injection of [18F]FDG. The mice were all imaged using the microPET Focus 220 (Siemens Preclinical Solutions, Knoxville, TN). The animals were either fasted or fed ad libitum before the study (referred to as “normal” mice in the MQP database and, therefore, in this article). The method described in this work to obtain arterial blood input function is an image-derived method and was tested on both the fasted and the normal mice. However, image contrast and even tumor uptake are lower in the nonfasted state compared to the fasted state, whereas myocardial uptake is less in the fasted state, 18 which allows for more accurate quantification of the left ventricle activity owing to reduced spillover. For the fasted mice (n = 11), the microPET data sets used in this work included only those for which at least a portion of the initial arterial blood peak was identifiable and a complete PET image time course was available (ie, data sets that are at leas 60 minutes in length). As for the normal mice, although a large number of data sets were available, we chose seven sets randomly from those in which the initial arterial blood peak was identifiable and a complete PET image time course was available.
Construction of the IDIF
Three-dimensional sets of ROIs were drawn (1) around the interior (blood-pool region) of the left ventricle (3-5 slices), (2) within the liver (3-5 slices), and (3) around the whole brain (3-5 slices) using AMIDE 19 (http://amide.sourceforge.net/index.html), as shown in Figure 2. ROIs were manually drawn over each slice for each mouse, and TACs were generated over the duration of the scans. The diameter of the blood-pool region of the left ventricle is approximately 1.6 mm. 12 Given that the mice were imaged in a microPET Focus 220, which is the same instrument as we have at our institute, we corrected the left ventricle TACs for spillout partial-volume effects 20 using recovery coefficients (RCs) estimated from images of a cone-shaped phantom acquired on our scanner under similar conditions. An RC of 0.5 was determined using the mean activity from an ROI drawn around the cone-shaped phantom at a location on the phantom where the diameter was similar to that of the blood-pool region of the left ventricle. To evaluate the impact of choice of RC and to account for possible differences between our microPET and the scanner on which the data were collected, we also tested our method on some of the fasted mice (n = 7) using an RC of 0.7 and an RC of 1. Possible blurring effects owing to the physiologic motion of the ventricle were neglected for the sake of simplicity. Although it was not done for the data sets used here, cardiac gating would allow better identification of the blood-pool region, but at the cost of increased noise owing to the corresponding reduction in counts. Because the liver and brain are large compared to the microPET resolution, application of RCs was not necessary for these ROIs.

Top: Sample image of [18F]FDG uptake in a mouse (m19796-fasted) coregistered to computed tomographic images obtained from the Mouse Quantitation Program. Bottom: Regions of interest (ROIs) were drawn on axial slices around the blood-pool region of the left ventricle (≈ 1.6 mm in diameter), liver, and brain. The myocardium image in the bottom left corner is magnified more than the others to better depict the ROI.
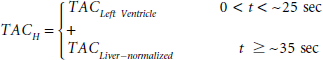
Our IDIF is a hybrid one combining the TACs of the blood-pool region of the left ventricle and the liver in the following way. The TAC of the liver was normalized to the activity concentration of [18F]FDG in the last arterial blood sample, that is, to the ≈ 60-minute arterial blood sample for the cases examined here. The portion of the interior of the left ventricle TAC used in constructing the hybrid TAC starts from time = 0 seconds and extends to the end of the peak curve at the point where the TAC starts to flatten out before rising again (indicating systemic recirculation of the [18F]FDG and [18F]FDG uptake in the myocardium) (Figure 3). For many of the mice data used, this transition occurred at 20 to 25 seconds. A linear interpolation was used to connect the bottom of this peak curve of the left ventricle TAC to the start of the exponentially decaying part of the normalized liver TAC, that is, the time point that just follows the peak of the normalized liver TAC, which in many of the mice data occurred at ≈ 35 seconds (Figure 4). The hybrid TACH represented by the equation

Time-activity curves (TACs) of [18F]FDG concentraion in the arterial blood (time delay corrected), blood-pool region of the left ventricle (corrected for spillout effects using a recovery coefficient of 0.5) and liver (normalized to 60-minute blood sample) for m17385-normal (nonfasted) mouse from the Mouse Quantitation Program. Myocardial uptake is higher in the left ventricle TAC for nonfasted mice compared to fasted ones. The insert displays the same TACs during the first 30-second post-[18F]FDG injection. SUV = standardized uptake value.
Data Analysis and Modeling
The hybrid TAC was used to determine the kinetics of [18F] FDG uptake in the mouse brain using irreversible kinetics in a two-tissue compartment model (see Figure 1) using the commercial PMOD software version 2.6 (PMOD Technologies, Zurich, Switzerland) by fitting the TAC of the brain. The resulting K1, k2, and k3 were used to calculate the [18F]FDG influx constant (Ki):


Validation
To determine the accuracy of our IDIF, we compared Ki estimates in the brain using our hybrid IDIF to Ki estimates in the brain using the following:
Input function 1: This was the actual TAC from arterial blood samples as shown in Figure 4
Input function 2: Given that the early portion of the left ventricle TAC reflects the true maximum concentration and peak width of the arterial blood curve 15 (see Figure 4), we constructed a realistic input function by combining the early portion of the blood-pool region of the left ventricle TAC with the arterial blood samples.
This was achieved by compensating any missing portion of the arterial blood curve with its equivalent from the early time points of the interior of the left ventricle TAC, as shown for two examples in Figure 5 after correcting for spillout effects in the blood-pool region of the left ventricle TAC. This was especially useful for some mice data in which the arterial blood TACs had insufficient samples to construct an accurate peak height and width in the first ≈ 25 seconds after [18F]FDG injection. In other words, the initial part of the arterial blood curve containing the peak was too short, too wide, or both.
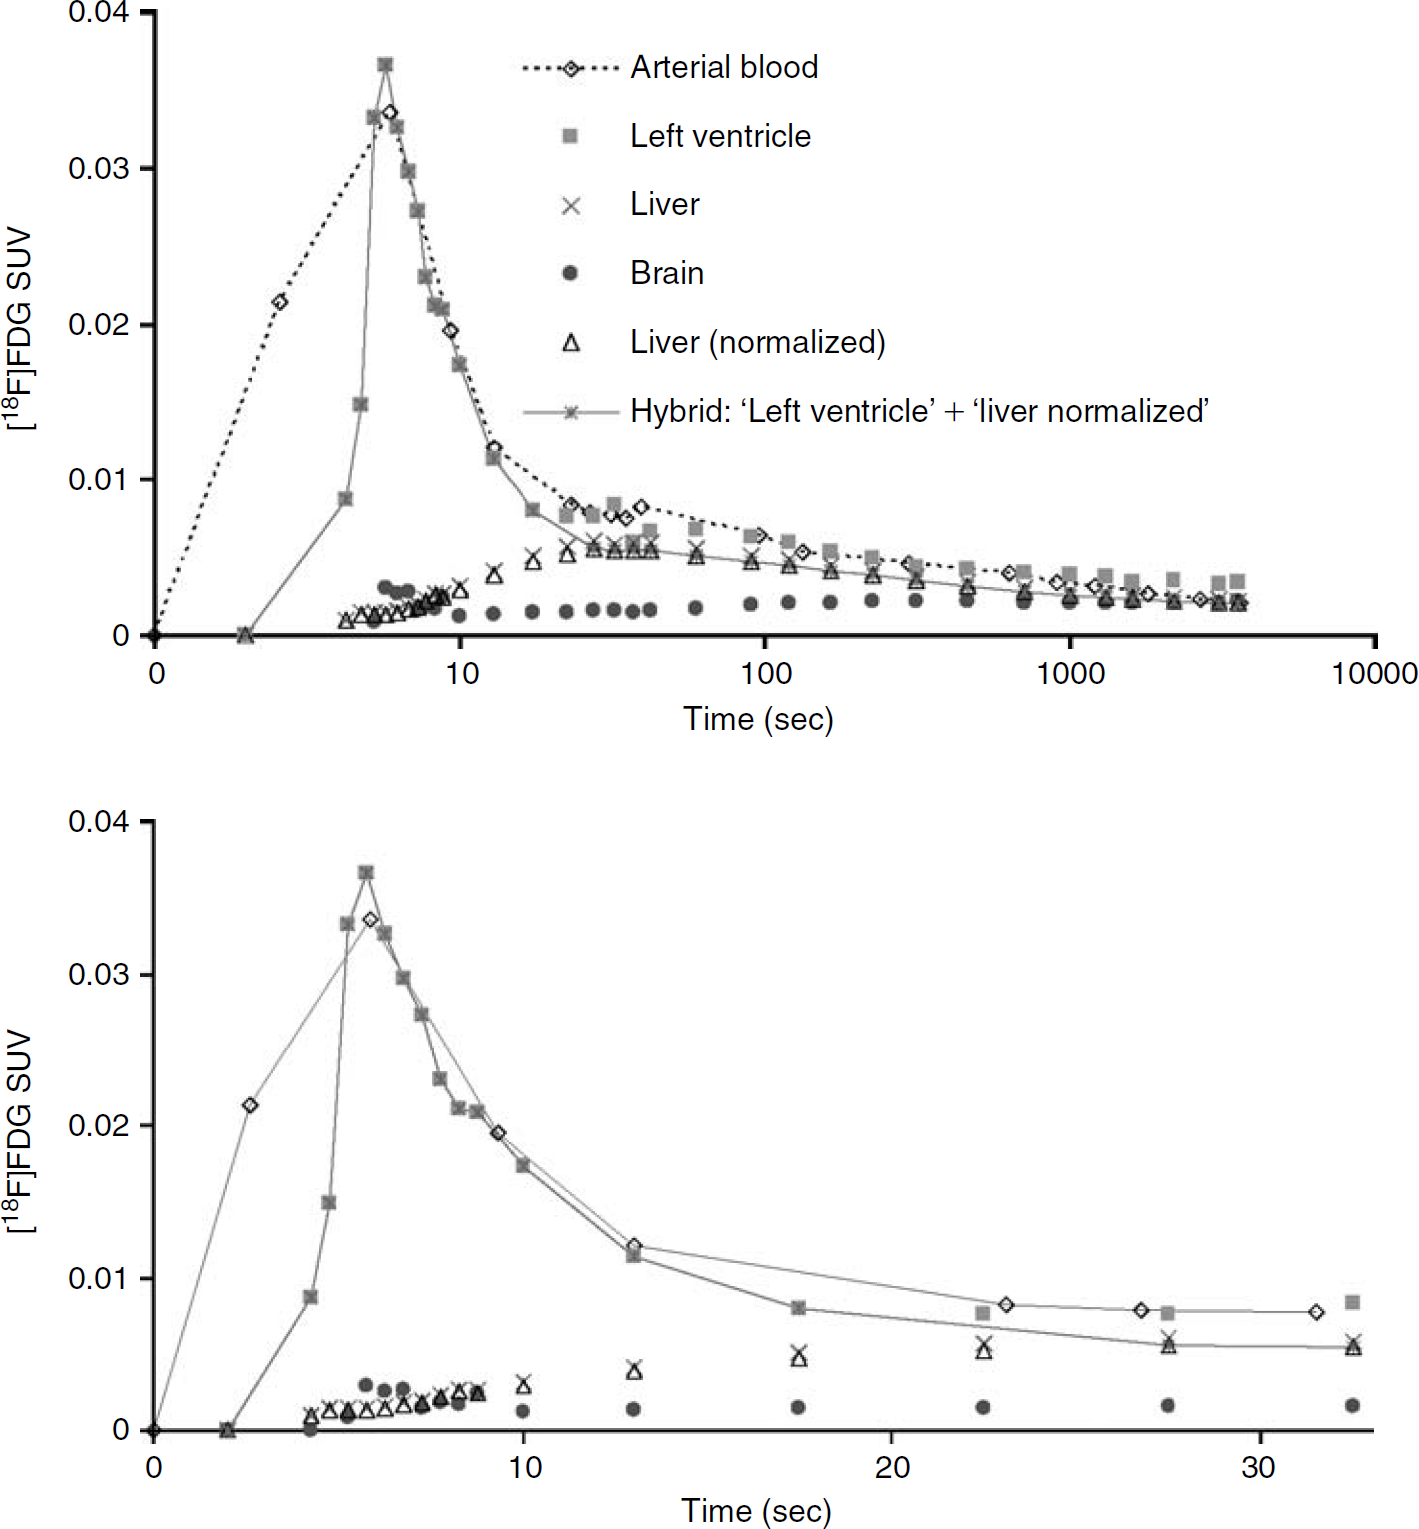
Time-activity curves (TACs) for arterial blood, blood-pool region of the left ventricle (corrected for spillout effects using a recovery coefficient of 0.5), brain, and liver for m18333-fasted mouse. The liver (normalized) TAC was created by normalizing the liver TAC at the end of the scan to the concentration of [18F]FDG in the 60-minute arterial blood sample. The image-derived input function described in this work is a hybrid TAC combining the initial curve of the left ventricle containing the peak and the decaying part (ie, just after the peak) of the normalized liver TAC. In the upper part of the figure, time is displayed on a log scale. The bottom part of the figure shows the first 33 seconds (linear scale) of the top figure. SUV = standardized uptake value.
There is a difference between the time the blood sample was collected at a peripheral artery and the time that that particular volume of blood was in the left ventricle. Thus, a time delay correction was made for the arterial blood TAC used in input functions 1 and 2 by subtracting the apparent time delay in the TACs of the arterial blood samples, which was, on average, 4 to 6 seconds, based on the observed difference in the peak value of the left ventricle and the arterial blood TAC.
Although we are validating our hybrid IDIF against input function 1, which represents the reference standard, we also use input function 2 for comparison because it could be considered a closer representation of an actual arterial blood input function. This approach is reasonable in that we are using a portion of the blood-pool region of the left ventricle data to more finely sample the peak of the arterial blood curve while using the remainder of the arterial blood samples.
In some cases, the sampled arterial blood peak curve was sufficient such that we did not need to add many data points to it from the blood-pool region of the left ventricle peak curve (eg, m18333 mouse; see the top part of Figure 5), whereas some cases required nearly two-thirds or more of the blood-pool region of the left ventricle peak curve to compensate for the missing part of the arterial blood peak curve, as was the case for the m17156 mouse (see the bottom part of Figure 5). In contrast, we are using the entire left ventricle peak curve and a tail from a different organ (the liver) to construct our hybrid IDIF.

Time-activity curves (TACs) for m18333-fasted (top) and m17156-fasted (bottom) mice. Time is displayed on a log scale. Input function 1 is the arterial blood TAC. Input function 2 is a TAC that combines the arterial blood TAC with the initial part of the blood-pool region of the left ventricle TAC that contains the peak. The blood-pool region of the left ventricle TAC was corrected for spillout effects using a recovery coefficient of 0.5. SUV = standardized uptake value.
Statistical Analysis
One-way analysis of variance (ANOVA) was performed using GraphPad Prism version 4.00 for Windows (GraphPad Software, San Diego, CA). The one-way ANOVA was performed on the Ki estimates of the fasted mice obtained with input function 1 (arterial blood), input function 2 (arterial blood + part of the blood-pool region of the left ventricle peak curve), and the hybrid IDIF described in this work (normalized and non-normalized). A similar one-way ANOVA was performed on the normal mice. A probability of p < .05 was selected as the significance threshold. 21 In addition, a two-tailed paired t-test was performed between input function 1 and each of the other three input functions (input function 2, normalized, or non-normalized hybrid IDIF) to determine the coefficient of determination, r2.
Results
Figure 6 displays the distribution of the Ki estimates among the fasted mice for the different RCs. Figure 7 displays the distribution of the Ki estimates among the normal (nonfasted) mice for an RC of 0.5 applied to the left ventricle TAC. The mean Ki estimates of [18F]FDG uptake in the brain using input functions 1 and 2 and our hybrid IDIF (normalized and non-normalized) are listed in Table 1.

Statistical display of the [18F]FDG influx constant (Ki) in the brain of fasted mice obtained using four different time-activity curves (TACs) as input functions: input function 1, which is an arterial blood TAC obtained from arterial blood samples, and input function 2, which is a combination of a portion of the blood-pool region of the left ventricle peak (used to compensate for the missing parts of the initial part of the arterial blood curve containing the peak) and the remainder of the arterial blood TAC. Hybrid IDIF (normalized) is our image-derived hybrid input function consisting of the initial part of the left ventricle curve that contains the peak and the liver TAC that had been normalized to the 60-minute arterial blood sample. Hybrid IDIF (non-normalized) is the same as the previous except that the liver TAC is not normalized. The left ventricle TAC was corrected for spillout effects using three different recovery coefficients (RCs).

Statistical display of the [18F]FDG influx constant (Ki) in the brain obtained using four different time-activity curves as input functions in normal (nonfasted) mice (n = 7; recovery coefficient = 0.5). IDIF = image-derived input function.
The results of the one-way ANOVA yielded a p > .05 whether for fasted (any given RC), or normal mice, indicating that the differences in the Ki estimates between the different input functions used, that is, input functions 1 and 2, normalized hybrid IDIF, or non-normalized hybrid IDIF, did not reach a level of statistical significance. In addition, the two-tailed paired t-tests demonstrated that the correlation between input function 1 and the hybrid normalized IDIF was > 85% (see r2 results in Table 1) for either fasted or normal mice.
Discussion
The variation between the Ki estimates when using input function 1 (arterial blood) or 2 (arterial blood + part of the blood-pool region of the left ventricle peak curve) and the Ki estimates obtained using our normalized hybrid IDIF did not reach the level of statistical significance for either the fasted (any given RC) or normal mice (see Table 1, Figure 6, and Figure 7). In addition, the differences in the Ki estimates between input function 1 and the normalized hybrid IDIF for any mouse were within the error bars of each estimate whether for fasted mice with the different RC values or for the normal mice.
The differences between the Ki estimates obtained using input function 1 and the Ki estimates obtained using input function 2 were, on average, < 15% for the fasted and normal mice (see Table 1) and decreased for the fasted mice as the RC increased. This was expected because, in many cases, arterial blood sampling was incomplete, yielding an arterial blood TAC peak that was lower and narrower than that expected. In such cases, as the RC increased, the underestimation of the left-ventricle blood-pool activity decreased and the left-ventricle TAC thus more closely resembled the arterial blood TAC.
Mean Ki Estimates of [18F]FDG Uptake in the Mouse Brain Using Different Input Functions*

diff = percent difference between each input function and input function 1, ie, % diff = 100% × |input function 1 - input function (2 or hybrid IDIF)|/input function 1; IDIF = image-derived input function; r2 = coefficient of determination between each input function (input function 2 or hybrid IDIF) and input function 1; RC = recovery coefficient; TAC = time-activity curve.
See Methods for a complete description of the different input functions.
The mean Ki estimates are displayed as mean ± SE.
The height and/or width of the initial arterial blood curve containing the peak were the major sources of the differences between Ki estimates in input functions 1 and 2 as well as between input function 1 and the normalized hybrid IDIF. In cases where the peak curve of the arterial blood is very poorly identified, the differences in Ki estimates between input function 1 and the normalized hybrid IDIF were as large as 20%. For example, the height of the peak in the arterial blood TAC of the m18333 mouse is similar to the height of the peak in the blood-pool region of the left ventricle TAC with an RC of 0.5, but the width of the peak curve in the arterial blood TAC is larger than that of the blood-pool region of the left ventricle, as shown in the top part of Figure 5. Therefore, the difference in the Ki estimates of [18F]FDG uptake in the brain between input function 1 and our normalized hybrid IDIF was ≈ 7% for this mouse. An error in the arterial blood sampling, sparse sampling of the arterial blood peak, and dispersion of [18F]FDG as it travels through the arteries caused the peak to be wider when sampled from peripheral vessels compared to that of the left ventricle TAC. On the other hand, the peak height in the arterial blood TAC for the m17156 mouse is much lower than that of the blood-pool region of the left ventricle at an RC of 0.5 (see the bottom part of Figure 5). Therefore, the difference in the Ki estimates of [18 F]FDG uptake in the brain between input function 1 and our normalized hybrid IDIF in this case reached 20%. Thus, we can reliably predict that as the shape of the peak curve in an arterial blood TAC becomes more accurate, that is, more similar to the shape of the peak curve of the left ventricle TAC (corrected for spillout effects), then the difference in the Ki estimates between the arterial blood TAC and our hybrid normalized TAC will drop below 1%, as was the case in the Ki estimates between input function 2 and our normalized hybrid IDIF for an RC of 0.5 (see Table 1).
The differences in the mean Ki estimates between input function 2 and our normalized hybrid IDIF were < 1%, ≈ 6%, and ≈ 13% for RC values of 0.5, 0.7, and 1, respectively, for the fasted mice and were ≈ 27% for the normal mice. These differences in the means between the Ki estimates of the normalized hybrid IDIF and the Ki estimates of input function 2 may actually better represent the true differences in the Ki estimates between the normalized hybrid IDIF and an exact arterial blood input function because an exact arterial blood curve would be expected to be very similar to input function 2.
In this work, we tested different RCs for the TACs of the blood-pool region of the left ventricle for the fasted mice. It may be that none of the RCs used reflect the true RC of the actual scanner used to image the mice, but it is likely that the true RC of the actual scanner lies within the range of RCs used in this work. Over the range of RC values used here, the difference in the mean Ki estimates between our hybrid IDIF and input functions 1 or 2 was < 15%. Interestingly, according to the data in Table 1, even without correcting for spillout effects to the TAC of the blood-pool region of the left ventricle (ie, RC = 1), a normalized hybrid IDIF can be constructed that produces Ki estimates that are < 13% different from the Ki estimates obtained from an arterial blood TAC.
In the normal (nonfasted) state, myocardial uptake of [18F]FDG affects the shape of the initial uptake curve containing the peak in the left ventricle. Myocardial uptake is observed at an earlier time after the peak in the left ventricle in the normal state compared to the fasted state (compare Figure 3 and Figure 4). This produces a larger gap (on the y-axis) between the end of the left ventricle peak curve and the start of the decreasing portion of the liver TAC in the normal state compared to the fasted state. In addition, glucose loading increases influx of [18F]FDG into normal liver in nonfasted subjects compared to fasted subjects. 3 These two reasons may explain why there was a 27% difference in the Ki estimates between input function 2 and our normalized hybrid IDIF for nonfasted mice. Thus, we routinely fast the mice ≈ 8 hours prior to [18F]FDG injection.
The time delay from the ventricle to the brain is not identical to the time delay from the ventricle to the site of arterial sampling either. However, it is unlikely that the delay correction will affect the comparison because the delay is small and the tracer kinetics are slow. To test this hypothesis, we analyzed some of the data again but with the left ventricle corrected to the arterial blood TAC by adding 4 to 6 seconds to the left ventricle TAC. As was expected, the resulting Ki estimates (data not shown) were not significantly different from the results displayed in Table 1. The hybrid method proposed in this work depends on drawing an ROI around the blood-pool region of the left ventricle and drawing an ROI within the liver and then normalizing the resulting liver TAC to a blood sample (arterial or venous blood) taken at the end of a 60-minute scan. In practice, researchers using this method on their own data would not be able to determine the exact time delay required to correct for the left ventricle TAC to the tissue of interest (brain). Thus, we chose to establish a hybrid IDIF in this work that does not involve time delay correction of the left ventricle TAC to the tissue of interest. Inclusion of such corrections would increase the complexity of the proposed method, whereas the inherent tradeoff between image noise and temporal resolution in microPET imaging of mice likely results in less sensitivity of the model estimates to such corrections than in human or primate studies.
Although the statistical results do not actually indicate a need to normalize the liver TAC to the 60-minute arterial blood sample, it is apparent from the mean Ki estimates shown in Table 1 that a hybrid IDIF using the normalized TAC in the fasted mice produces mean Ki estimates that are closer in value to the mean Ki estimates of input functions 1 and 2. As mentioned in the introduction, the liver is sometimes assumed to represent a large blood-pool and the liver TAC has been used as a surrogate input function.5,16 In addition, the AUC of the liver TAC is sometimes used as an approximation of the AUC of the plasma TAC.
15
The liver TAC can be represented by a multiexponential model of the form

Recently, Yu and colleagues reported results using the liver TAC as a surrogate input function, obtaining Ki estimates significantly different from those obtained using an actual arterial input function measured with a microfluidic blood sampler. 5 The authors concluded that using the liver TAC as an input function produces unreliable results. However, Yu and colleagues used the entire liver TAC as the input function, whereas in our case, we used only the terminal portion of the liver TAC, combining it with the initial portion of the blood-pool region of the left ventricle TAC to derive the input function; this yielded similar results for the [18F]FDG influx (ie, Ki) in brain as estimated using the arterial blood input function from blood sampling.
Constructing Our Normalized Hybrid IDIF Experimentally Using One Venous Blood Sample
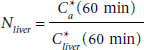
We propose and currently use the following protocol to establish the normalized hybrid IDIF. The subject's heart and liver must be included in the PET's field of view. An ROI should be drawn around the blood-pool region of the left ventricle and the resultant TAC should be corrected for spillout effects using a suitable RC. After injecting the subject with [18F]FDG, a dynamic acquisition must be taken for approximately 60 minutes. At the end of the 60-minute scan, a venous blood sample should be drawn and counted for activity in a well counter that has been cross-calibrated to the PET scanner. If the subject is a mouse, a venous blood sample can be obtained at the end of the PET scan by clipping the end of the mouse tail or by inserting a tail vein catheter, drawing the sample, and then cauterizing the tail. At 60 minutes, the activity concentration in the venous blood, Cv*, reaches a near steady-state level. If E* is the net extraction fraction of [18F]FDG and Ca * is the activity concentration of [18F]FDG in arterial blood, then

To measure the metabolic rate, equation 3, an additional venous blood sample has to be drawn and placed on a glucometer. Given that isoflurane anesthesia can have a considerable impact on the blood glucose level,18,24 it is best to obtain this blood sample for glucose level measurements while the mouse is anesthetized, that is, under the same conditions in which [18 F]FDG is being taken up by tissue. This blood sample can be obtained by clipping the tail or using a tail vein catheter prior to [18F]FDG injection. 24
Conclusion
In conclusion, we demonstrated that the normalized hybrid IDIF defined in this work closely resembles a true arterial blood curve for kinetic modeling of [18F]FDG studies without the difficulties of arterial blood sampling or complicated numerical analysis. This method requires only drawing ROIs around the interior blood-pool region of the left ventricle and around the liver, connecting the resulting two TACs via linear interpolation, and drawing a single venous blood sample at the end of the scan for normalizing the liver TAC. Separate validation would be necessary before using this technique with radiotracers other than [18F]FDG as the accuracy will depend on such factors as myocardial uptake and the clearance route of the radiotracer. We recommend that mice be fasted prior to the experiment to reduce variability in the MRGlu estimates. We have begun using this method on all mouse dynamic studies using [18F]FDG in our laboratory.
Footnotes
Acknowledgments
We would like to thank the Crump Institute at UCLA for acquiring the mouse data and sharing these valuable data with interested researchers from other institutes.
Financial disclosure of authors and reviewers: Financial support provided by NIH 5U24 CA126588-02 and 3P30 CA068485, and a Career Award at the Scientific Interface from the Burroughs Wellcome Fund (TEP).