
Abstract
Molecular imaging techniques used to detect the initiation of disease have the potential to provide the best opportunity for early treatment and cure. This report aimed at testing the possibility that Flk1+ (vascular endothelial growth factor receptor 2), a crucial angiogenesis factor of most tumor cells, could be a molecular targeted imaging marker for the diagnosis and prognosis of cancer. We performed Flk1-targeted microbubble-enhanced ultrasound (US) imaging of prostate cancer in a genetically engineered mouse model with normal-appearing intact US (negative) prostates and with three different tumor sizes (small, medium, and large). Higher levels of Flk1+ molecular signals were identified in the intact US (negative) prostate group by US-targeted imaging and immunohistochemical analysis. The increase in Flk1+ expression occurred prior to the angiogenesis switch-on phase and vascularity peak. After this peak accumulation stage of Flk1+ molecules, lower and stabilized levels of Flk1+ signals were maintained together with tumor growth from small, to medium, to large size. In a longitudinal observation in a subset (n = 5) of mice with established tumors, elevated Flk1+ signals were observed in tissues surrounding the prostate cancer, for example, the ipsilateral boundary zones between two developing tumor lobes, new tumor blood vessel recruits, the urethra border, and the pelvic node basin. The potential of Flk1-targeted US imaging as a predictive imaging tool was confirmed by correlation studies of three-dimensional US B-mode imaging, gross pathology, and histology analyses. The results of the application in a genetically engineered mouse model with prostate cancer of molecular Flk1-targeted US imaging support the contention that Flk1 can be used as a molecular imaging marker for small tumors undetectable by microimaging and as a molecular diagnostic and prognosis marker for tumor metastasis and progression.
THE LINK BETWEEN early detection and successful treatment of cancer with minimal morbidity is clearly established, and advances in imaging continue to play a key role in the early detection of cancer. Conventional imaging, however, can detect cancer only once morphologic changes have occurred, which is usually after the point when crucial steps in carcinogenesis (ie, initiation of angiogenesis) are already under way. One ideal strategy would be detection of the disease at a molecular level during the beginning of the initiation stage before overt morphologic changes have occurred and while the risk of locoregional and systemic spread is still low. In this regard, molecular imaging making use of molecular probes to interrogate key pathways in carcinogenesis is particularly promising.
In recent years, significant progress has been achieved in targeted microbubble (MB)-enhanced ultrasound (US) imaging.1–3 MBs are constructed of a lipid shell (either soft or hard shell) and filled with a biologically inert gas (eg, perfluoropropane), which decreases their instability owing to passive gas diffusion into blood serum. MBs used as US contrast material require a small dose and show excellent detection sensitivity. MBs are safe intravascular tracers and have been shown to be effective for classifying tumors based on their blood flow characteristics.1,2,4 If MBs are conjugated with specific monoclonal antibodies, they can be used to image and qualitatively assess molecular markers of physiologic and pathologic processes of tumorigenesis. Techniques involving the detection and destruction of MBs can be used in molecular imaging application and to target site-specific gene delivery systems.
In this report, we used targeted MBs conjugated with Flk1 (vascular epithelial growth factor [VEGF] receptor 2) antibody to explore the possibility of molecular diagnosis of cancer, that is, detection of tumorigenesis before tumor growth can be measured using conventional imaging. VEGF initiates tumor vascularization by driving an angiogenic response in endothelial cells. At least two receptor tyrosine kinases are expressed on endothelial cells, VEGF receptor 1 (VEGFR1/Flt1) and VEGF receptor 2 (VEGFR2/Flk1). (For a recent review of these kinases, see Schlaeppi and Wood. 4 ) Gene targeting experiments showed that early embryonic vascular development is dependent on VEGF function. Flk1 is expressed on endothelial cells or their precursors and is essential for endothelial cell differentiation, vasculogenesis, and hematopoiesis. 5 VEGF and Flk1 are upregulated in a variety of human tumors, including glioma and carcinoma of several tissues.6,7 The expression of VEGF in tumor cells and Flk1 on the tumor endothelium indicates that this signal transduction system stimulates the proliferation and the survival of tumor vessels by a paracrine mechanism. Tyrosine phosphorylation of Flk1 in response to VEGF activates numerous downstream signaling molecules. Most reports agree that Flk1 activation is of central importance to VEGF-specific angiogenesis, being necessary for angiogenic responses. 4 VEGFR1/Flt1 has a relatively minor role in VEGF-mediated signal transduction compared with VEGFR2/Flk1 because its kinase activity is 10-fold less than that of Flk1. 8
To explore the feasibility of targeted MBs conjugated with Flk1 antibody in early cancer detection, we used a genetically engineered mouse (GEM) prostate cancer (CaP) model. Given that CaP does not occur naturally in rodents, GEM with autochthonous CaP has been generated and used successfully as a model for basic research and preclinical studies.9,10 The PSP94 gene-directed transgenic mouse adenocarcinoma prostate (PSP-TGMAP) model11–14 mimics the most widely used transgenic adenocarcinoma mouse prostate (TRAMP) model in terms of tumorigenesis and fast tumor growth kinetics.11,15 Previous application of targeted enhanced US imaging was mostly based on subcutaneous or orthotopic tumor implants of tumor cell lines grown in immunodeficient nude mice. One drawback of such models is that they mostly allow only for the study of late-stage and poorly differentiated cancers.16–18 We demonstrated potential using Flk1 as diagnosis and prognosis marker for molecular imaging.
Materials and Methods
Microscopic and Macroscopic CaP in Genetically Engineered Transgenic Mice, Anatomy, and Histology and Pathology Analysis
A model of PSP94 (prostate secretory protein of 94 amino acids)-TGMAP11,19,20 was used for this study for directing SV40T/t antigen targeted specifically to mouse prostate tissue (strain F1[C57BL/6 × CBA]). Similar to the TRAMP model mice, most PSP94 transgenic mice develop fast-growing tumors in the lobes of the ventral prostate and in the dorsolateral prostate lobes within 3 to 8 months of age. These transgenic mice were identified by a quick polymerase chain reaction genotyping protocol.11,19,20 All animal experiments were conducted according to standard protocols approved by the University Council on Animal Care. The prostate and the vascular anatomy of the surrounding area were identified by following the text by Cook. 21
Preparation of Targeting MBs
Most of the MBs used for this study were prepared and provided by Dr. A. Klibonov's laboratory, as reported18,22; the rest were purchased from TargeStar (Charlottesville, VA) and VisualSonics (Toronto, ON). All MBs were biotinylated and had a mean size of 1.896 μm (range 1–4 μm in diameter) and a titer of 4.5 × 10⁹ particles/mL. Biotinylated monoclonal antibody against mouse Flk1 (VEGFR2) and an IgG isotype control of biotinylated rat IgG2a were all purchased from eBioscience (San Diego, CA). We followed the manufacturer's protocol for conjugation of biotinylated antibodies, and biotinylated bubbles were diluted and washed in degassed phosphate-buffered saline (PBS) solution two times to eliminate the excess free biotin and biotin-lipid fractions. Each sample of 5 × 10⁷ biotinylated MBs (for 10 injections in mice weighing 25–30 g) was coupled with 30 μg of streptavidin (Sigma, St. Louis, MO), incubated for 30 minutes in ice, and then washed twice with degassed PBS to terminate the streptavidin coupling reaction and to wash off the excess free streptavidin. Next, 100 to 200 μg of biotinylated antibody was added to 5 × 10⁷ streptavidin-coupled MBs, incubated for 30 minutes in ice, and diluted with degassed PBS to wash off the excess free antibody that did not attach to the bubbles. Centrifugation washes were at ≈ 800 rpm (Eppendorf bucket rotor) for 6 minutes each.
Targeted Enhanced US Imaging Protocol
US imaging was performed using the Vevo 770 microimaging system (VisualSonics). Mice with normal-appearing intact prostates or small tumors were imaged using a 40 MHz transducer (VisualSonics, RMV-704), whereas a 25 MHz transducer (VisualSonics, RMV-710) was used to image larger tumors. During each imaging session for each GEM, a 100 μL bolus of IgG2a-conjugated MBs was injected via a tail vein cannula. Two-dimensional image acquisition was performed beginning 3 minutes after MB injection. Images were acquired at a moderate acoustic intensity level (avoiding MB destruction) for about 20 seconds (corresponding to approximately 300 image frames), and then imaging was suspended for about 4 seconds while the US scanner transmitted a sequence of higher-intensity pulses to destroy all of the MBs within the field of view. Nondestructive imaging resumed until the system's 575-image frame memory buffer was filled, corresponding to about 20 seconds of imaging after completion of the MB destruction sequence. Fifteen minutes was allowed for the initial MB bolus to clear from the circulation of each mouse, and then the image acquisition procedure was repeated for each mouse using a 100 μL bolus of Flk1-targeted MBs. The first targeted destruction series was registered with the control sequence. In addition to the chosen registered two-dimensional image of interest, other anatomic areas surrounding the tumor (such as closely located draining lymph nodes) were also analyzed for bound targeted MBs.
For each cine loop, contrast enhancement owing to bound MBs was quantified as follows. A subset of image frames at the end of the contrast-enhanced cine loop was designated as the reference frames. For each of the remaining image frames in the cine loop, a cross-correlation search was performed to identify the reference image that matched most closely to the respiratory phase, and that reference image was subtracted from the contrast-enhanced image to obtain an image composed of MB echoes only. Although the ultrasound operator/observer was the same person and was not blinded, selection bias was minimized as the cross-correlation search was carried out by the ultrasound analysis software, and reference sequence determination and processing were standardized for each animal.
Region of Interest and Decaying Rate Determination
The region of interest (ROI) was drawn centered on the tumor or centered on the prostate in precancerous mice, and the mean image gray level within the ROI was calculated for each frame-subtracted image. The result obtained from the frames acquired before MB destruction represents the enhancement owing to bound and circulating MBs, and the result for frames acquired after the destruction sequence represents the enhancement owing to circulating MBs only. The data are summarized by computing the average of the estimated enhancement over at least 100 frames immediately before and immediately after the destruction sequence. The difference of those averages is the estimated enhancement owing to bound MBs. One hundred frames were chosen to standardize the analysis procedure. Peristaltic intestinal and seminal vesicle movements could not be reference match subtracted and contributed to background contrast error. Limiting data frames for both pre- and postdestruction to 100 frames attempted to minimize this nonuniform peristaltic motion. Pre- and post-subtracted grayscale values averaged for 100 frames represent the semiquantitative data set. The displayed contrast images are visual representations of anatomic areas potentially registered via contrast overlay with grayscale B-mode images.
Destruction time course experiments conducted on two animals showed zero decay slopes and were achievable between 3 and 5 minutes post-bolus injection, based on our MB concentrations. The standard deviation of the ROI pre- and postdestruction within an animal is a function of the decay rate. Given that our objective was to design a proof of concept experiment supporting the use of Flk1-targeted MBs in GEM models, validation and quantification of decaying time to each GEM were not performed individually and separately. Large tumors normally produced longer decaying rates in our GEM-CaP (data not shown), which may indicate low blood flow, as we previously reported. 14 To maintain consistency, we chose a standard 3- to 5-minute destruction time according to the most previous reports18,22 and the manufacturer's recommendation.
Three-Dimensional US Grayscale Imaging and Animal Prescreening Procedure
Given that the GEM-CaP are normal C57 mice with a normal immune response to SV40 Tag oncogenesis and incidences of GEM-CaP tumors (as in the human clinic) are nonsynchronous, ranging from 3 to 8 months, a rapid (20 minute/each mouse) and noninvasive three-dimensional US prescreening procedure was employed, which was developed in our laboratories.12,13 Given that GEM-CaP grow tumors nonsynchronously, more than 100 mice (3–8 months of age) were selected for this study, and all were first screened by a rapid three-dimensional US B-mode (anatomic imaging) and power Doppler US (vascular imaging) for survey and detailed anatomic views of the prostate. GEM-CaP (n > 20) were placed into one of three experimental groups based on initial US and physical examination findings. Mice appearing to have normal intact prostates were placed into the tumor-negative group, whereas mice with visibly abnormal yet intact prostates were grouped into the early tumor initiation group. Mice with US-visible and manually palpable tumors were placed into the late stage tumor group. Visible tumors were further divided into three different CaP categories (small, 0–49 mm3; medium, 50–500 mm3; and large, > 500 mm3). Three-dimensional US B-mode images were obtained using a Vevo 770 US microimaging system with a 40 MHz transducer and three-dimensional image visualization and analysis software, as described previously. 23 A number of three-dimensional images were acquired and used to measure tumor volumes, as described previously.12,13 A 25 MHz transducer (VisualSonics RMV-710) was used to image larger tumors that were outside the viewable area of the 40 MHz transducer.
Immunohistochemical Analysis
Tumor samples from PSP-TGMAP mice were dissected and then prepared for both frozen and paraffin-embedded sectioning, as we reported previously.12,14 Antibodies of antimouse Flk1 (eBioscience) and PECAM-1 (CD31, BD Pharmingen, San Diego, CA) were used at 1:50 dilution and reacted for 2 hours, and the second antibody used was biotin-conjugated polyclonal antibody against rat IgG (1:100 dilution; BD Pharmingen). Blood vessels stained by Flk1 and CD31 were counted by two observers. Microscope views were randomly selected, and each mouse was counted 10 times.
Statistical Analysis:
Statistical analysis was performed using the Student t-test to compare two data sets, and p values were calculated for each comparison. Only the results from the grayscale data were used for the statistical analysis. Only green contrast images of figure representation and anatomic inferences were used.
Results
Flk1-Targeted Enhanced US Molecular Imaging in GEM-CaP: US-Enhanced Destruction of Flk1-Conjugated Targeting Contrast MBs
Figure 1 shows a representative example of molecular imaging by Flk1-MBs on a GEM in three regions: a microimaging-detectable medium-sized tumor (marked as red arrows, tumor volume 23 mm2, age 39 weeks), an intact US (ie, US imaging negative) prostate lobe (marked as red arrows), and the area surrounding the tumor. According to the manufacturer's protocol, the contrast signals (green color) were obtained and measured pre- and post-US destruction (see Figure 1, A and B). Molecular targeted signals representing Flk1 antibody-targeted MBs bound to VEGFR2 in the capsule region of the vasculature in a ventral prostate tumor were determined by the disappearance of signals (green color) postdestruction, which represents a bound fraction of MBs (a specific or nonspecific bound fraction of MBs to Flk1), compared with the control IgG (isotype IgG2a) imaging series (see Figure 1B). Two types of references were marked with black arrows: (1) the predestruction signals that decreased or disappeared postdestruction and (2) the predestruction signals that did not decrease or disappeared postdestruction, except Flk1-targeted imaging that decreased, which were all due to nonspecific/targeted binding (possibly leukocyte uptake).
As shown in Figure 1, some of the targeted Flk1 US destruction signals were repeatedly found in the intact US (negative) prostate lobe (right) and areas surrounding the tumor (see Figure 1E), which are normally not detectable by micro-US imaging. These higher than normal Flk1-MB imaging signals were repeatedly observed (see Figure 1F). Targeted US imaging-Flk1 imaging of a wild-type mouse was shown with no or only nonspecific signals (see Figure 1C).
To clear the background signals and to demonstrate the specificity of the targeted Flk1 US destruction signals, we used the bladder as a control indicator of outside of the prostate tissue (Figure 1D shows one example) as the bladder is the organ nearest to the prostate (for anatomy, see Figure 2, A-D). So the specificity was also shown in areas surrounding the prostate. Figure 1F summarizes the results, where tumor negatives (n = 5) are shown as the first bar. The bladder region was always negative (see Figure 1D) in almost all 20 GEM-CaP with different sizes of prostate tumors (5 small, 8 medium, and 6 large). The bladder region was confirmed in our model, where it was observed that bladder tumor invasion or metastasis from the prostate tumor was not usually present.11,12,19 Figure 1F also shows that in these 20 mice, the tumor core region was negative and shown as a hypoechoic area, the same as the bladder. In contrast, the areas surrounding the prostate tumor were shown with enhanced signals (also shown in Figure 1E).
Enhanced Flk1 Expression and Accumulation in the Angiogenesis Switch-On Stage Prior to the Peak of Development
Given that the GEM with intact and normal-appearing and intact and abnormal-appearing prostates (based on B-mode speckled pattern appearance; see Figure 2A) selected for this study had actually all developed microscopic tumors, as we demonstrated previously,11–14 the findings of a detectable Flk1-targeted enhanced US signal (see Figure 1A) in these micro-US-negative areas may indicate the high sensitivity of the new technology of molecular imaging. To further confirm this finding, we analyzed and compared four animal groups. Figure 2, A to D, shows the gross pathology of these GEM and their tumor metastasis route and surrounding areas. The first group had an age range of 4 to 6 months (n = 10); that is, tumor development before angiogenesis switch-on and as determined by three-dimensional US imaging prostate size was negative (smaller than 2–3 mm; see Figure 2E) but showed abnormal imaging features (see Figure 2A). Figure 2F shows a representative sample of this group of GEM (36 weeks of age) demonstrating high Flk1-targeted enhanced US signals. The next three GEM tumor groups selected from three different sizes of tumors as measured by three-dimensional US imaging are small (Figure 2G, n = 7), medium (Figure 2H, n = 11), and large (Figure 2I, n = 6) tumors. Figure 2J summarizes the results of this comparison, showing that some of the intact normal-appearing prostatic tissue in our GEM-CaP revealed significantly higher (p < .05) signals detected by Flk1-targeted enhanced US imaging (n = 14, animal data collected by longitudinal testing) compared with GEM-CaP possessing tumors of any size (up to 500+ mm3). Given that the tumor periphery and capsular area are usually the tumor foci of intense angiogenesis-developing areas,12,14 we also compared Flk1-targeted enhanced US imaging signals of these areas with the tumor core (shown in Figure 2K) in three differently sized GEM-CaP tumors. As shown in Figure 2K, all three tumor size regions (5 small [up to 49 mm3], 8 medium [50–500 mm3], and 6 large [> 500 mm3]) showed no significant differences of Flk1-targeted enhanced US image signals in capsular regions compared with the Flk1-positive regions surrounding developing tumors (internal positive control tissue). In this test, we used US-confirmed, tumor-negative animals (two consecutive tumor-negative assessments based on imaging and manual palpation) to serve as Flk1-targeted enhanced US-negative controls; the areas surrounding the developing tumor served as Flk1-targeted enhanced US-positive controls.

Application of Flk1-targeted enhanced ultrasound (US) imaging technology to a genetically engineered prostate cancer (CaP) mouse model. Contrast processing pictures showing an Flk1-targeted monoclonal antibody (A) and the IgG isotype nontargeting control (B). Signals appeared postdestruction showing comparison of targeted US imaging signals in the capsular region (by red arrows in transverse planes) and nonspecific binding (black arrows). C and D, Negative controls: wild-type prostate (C, sagittal view) and the bladder vasculature (D) show no Flk1 signals. E, The area surrounding the prostate shows Flk1-targeted US signals. F, Demonstration of specificity of Flk1-targeted US imaging by Flk1-targeted US signals in the bladder vasculature, one of the organs nearest to the prostate. The graph shows all bladder area detected with little or no targeted Flk-1 US destruction signal in all mice examined with small, medium, and large tumor areas (for details, see Figure 3). The area surrounding all prostate tumors showed positive signals. MB = microbubble; VEGFR2 = vascular endothelial growth factor receptor 2.
Correlation of Molecular Targeted Flk1 Imaging with Immunohistochemistry of Flk1+ Signals in GEM-CaP Models
To study why there were higher than tumors Flk1-targeted enhanced US signals in those GEMs with intact prostate and US imaging negative, and to study by immunohistochemistry (IHC) that an increase in and peak of Flk1-targeted enhanced US signal occurs in intact and abnormal prostates prior to the angiogenic “switch-on” phase of angiogenesis (tumor diameters smaller than 2–3 mm) in GEM-CaP, we performed a correlation study to analyze prostate tissues by histology (hematoxylin-eosin staining) and IHC in GEM groups at ages ranging from 4 to 6 months in which US imaging did not detect tumor growth (n > 10). Figure 3A shows no or very weak IHC staining of Flk1 in normal (wild-type) prostate glands. The intact prostate in GEM-CaP aged 6 months revealed high heterogeneity of Flk1 staining (Figure 3B). Figure 3B also shows that at this stage, the prostate tumor developed pathologically moderately to poorly differentiated CaP with high tumor multifocality, as we observed previously,11,12,20 according to mouse CaP pathology standards, 24 and different intensities of Flk1 IHC staining were found, which may explain the higher error bars in Figure 2J in this group of mice. Both interductal and intraductal (see Figure 3, B and G) Flk1 staining was found, although the interductal staining was dominant (see Figure 3G). High-intensity Flk1 IHC staining in the large bundled blood vessels was more frequently found in the outside ring of the prostate glands (see Figure 3G), whereas in well-moderately differentiated CaP foci, IHC staining of Flk1 was mostly present in the outside ring of the prostate glands and absent in the stroma (see Figure 3, B and G). In contrast, small, medium, and large tumors (see Figure 3, C-E) showed very homogeneous, poorly differentiated CaP cells, as reported previously.12,14 IHC staining of Flk1 was shown only in blood vessels in variably sized tumors (see Figure 3, C-E), and no poorly differentiated CaP cells showed Flk1 IHC staining signals (Figure 3H). Figure 3, G to H, shows high-power (×20, ×40) images demonstrating the comparison of IHC staining of GEM intact prostates (microimaging defined tumor negative), which are still pathologically graded as moderately to poorly differentiated CaP, with poorly differentiated CaP cells (in small-, medium-, and large-sized tumors). Figure 3I shows a graph of the comparison of Flk1 IHC-stained blood vessel counts in three different sizes of CaP tissues (small, medium, and large, each n > 5). Some increased Flk1 positively stained blood vessel counts were observed from the small- to medium-sized tumors (shown in Figure 3, C-E). Large-sized tumors showed weaker IHC staining of vessels (see Figure 3, E and H). We also tested microvessel density marker CD31 by IHC (see Figure 3F) in large-sized tumors. Flk1 stained only large vessels, whereas CD31 stained mostly microvessels (see Figure 3F).

Gross pathology of intact and three sized GEM-tumors. Flk1-targeted enhanced ultrasound (US) molecular imaging revealed a peak expression of Flk1 signals during the angiogenesis switch-on stage, which corresponded with a transition from intact and normal-sized prostates to tumor volumes approaching 1 to 2 mm3 (the detectable threshold of the Vevo 770 micro-US system). A, A genetically engineered mouse (GEM) (34 weeks of age) of the intact and normal-sized prostate of a volume approaching 1 to 2 mm3, which is the detectable threshold (to be tumor negative on three-dimensional US) of the Vevo 770 micro-US system, showing glandular regions with abnormal speckled pattern changes either by gross pathology or US B-mode imaging. B-D, Three pictures show the gross pathology of GEM prostate cancers (CaPs) of small (B, 40 weeks), medium (C, 40 weeks), and large (D, 47 weeks) sizes separately. Pelvic lymph node metastases are shown by arrows. J shows a summary of the comparison of intact prostate (red bar) with different-sized GEM tumors (small, medium, and large, see G-I). Both hyper- and hypovascular tumor core regions are shown. Wild-type (Wt) (three-dimensional US imaging detected tumor negative) animals were used as a negative control, whereas the areas surrounding tumors normally detected with high Flk1-targeted enhanced US signals were chosen as positive controls. K shows the tumor capsule regions measured in this study and compares their Flk1-targeted enhanced US with negative and positive controls. All numbers indicated tissue numbers tested. *Statistical significance (p ≤ .05). Error bars indicate ± SD. BL = bladder region; DP = dorsolateral prostate; VP = ventral prostate.

Immunohistochemistry (IHC) study of Flk1 and CD31 (microvessel marker) of genetically engineered mice with prostate cancer (GEM-CaP) selected corresponding with a transition from the angiogenesis switch-on phase to different-sized tumors. IHC staining by Flk1 monoclonal antibody of prostate tissue was from prostate samples from (A) wild-type, (B) intact US (negative), and (C) small-, (D) medium-, and (E) large-sized tumors. F, IHC staining of CD31 of a large tumor. G-H, Enlarged pictures (×20, ×40 original magnification) for comparisons of Flk+ IHC cells in GEM intact US (negative) prostate and poorly differentiated CaP tissues. I, Graph showing distribution of IHC Flk1 staining signals in three sizes of tumors. y-Axis: blood vessels counted. Error bars indicate ± SD. All figures in A to H were stained by hematoxylin (×20 original magnification).
Longitudinal Scanning of Flk1-Targeted Enhanced US in Areas Surrounding Tumors Provides Predictive Imaging on Tumor Progression for Encroachment and Invasion into the Boundary Segments of Prostate Lobes
To investigate the diagnostic meaning of the increased and persistent Flk1-targeted enhanced US images surrounding the tumor areas, we performed longitudinal scanning in several mice (n = 5). Figure 4A shows both Flk1-targeted enhanced US contrast and B-mode images of one animal (39 weeks of age) that was longitudinally scanned to follow the progression, encroachment to nearby prostate lobes, and vascular recruitment trends from the tumor starting point. Four transverse contrast images (see Figure 4A) are shown depicting the tumor growth and advancement into the remaining intact prostate lobe and intertumor boundary zones between developing masses (time points: days 1, 14, 20, and 32 following initial US and manual palpation examination). On day 1, a ventral prostate tumor approaching 10 mm3 could be seen growing in close proximity to the urethra, ipsilateral prostate lobe, and two larger masses. Figure 4B shows a graph of the image data processing of the first (day 1) Flk1-targeted enhanced US scanning session, demonstrating that the tumor boundary and the surrounding areas near the medium-sized tumor had high Flk1 imaging signals (shown by the red curve for the bound form of Flk1). A portion of the prostate lobe associated with the ventral tumor appears to be intact. However, as shown in the US images from days 14 and 20, the boundary between the two tumors is significantly diminished, as is the ipsilateral ventral prostate lobe. The hypoechoic connective tissue surrounding the smaller ventral prostate mass appears to be completely replaced by the uniform and hypoechoic-appearing tumor cells. Tumor boundaries are distinctly demarcated with the hyperechoic dense capsular tissue. Consistent with tumor encroachment in the boundary, the urethra also showed tumor-related changes (shown in the second scan of June 21). Figure 4C shows the histologic analysis of the frozen section of three CaP lobes of this mouse (see Figure 4A). The lower-power (×4) images show a narrow boundary between the two tumor lobes, and the higher-power (×20) images show some invasion cells between the two lobes. The urethra area appears in Figure 4C, which shows that it is also closely connected with the encroaching tumor tissues. A control image of nonurethra CaP invasion in a GEM-CaP is shown in the right panel of Figure 4D (×4).

Longitudinal scanning in living genetically engineered mice with prostate cancer (GEM-CaP): predictive imaging by Flk1-targeted enhanced ultrasound (US) imaging for the diagnosis of tumor progression. A, Flk1-targeted enhanced US images acquired on four different days from a representative GEM-CaP (40 weeks of age). Tumor progression and metastasis in the area of the urethra and ipsilateral ventral prostate (vp) lobe (the boundary between two prostate lobes) are indicated by arrows. B, An intact prostate was used for position registration. Data processing of Flk1-targeted enhanced US imaging on day 1. The targeted Flk1 microbubble-bound fraction is shown by the red curve in all prostate lobes and surrounding areas. Error bar: ± SD. C-D, Verification of the predictive Flk1-targeted US imaging in longitudinal scanning by hematoxylin-eosin staining for tumor boundary showing tumor progression to ipsilateral tissues (C, ×4 and ×20 original magnification) and tumor invasion to the urethra area (D, ×4 original magnification). A control of nonurethra metastasis in GEM-CaP is shown (D, ×4 original magnification) in the right panel of D.
Predictive Imaging of Metastatic Events with Vascular Recruitment and Pelvic Lymph Basin of Tumors Coincident with Increased Flk1-Targeted US Images
Figure 5A demonstrates that Flk1-targeted enhanced US imaging signals detected in a mouse (age of 29 weeks) in the area surrounding the tumor, proximal to the urethra, provide predictive images for subsequent tumor encroachment and vascular recruitment. This figure shows a record of four panels of transverse and coronal image planes selected from the longitudinal study, which was followed in 2-week intervals (June 8–21) by Flk1-targeted enhanced US and three-dimensional US imaging. Significant vascular recruitment was detected, and two newly developed large vessels appeared in less than 2 weeks. The size of the vessels, which branched from the urethra area, was measured in the US images to be 150 and 190 μm (Figure 4, shown in the coronal plane of June 21).
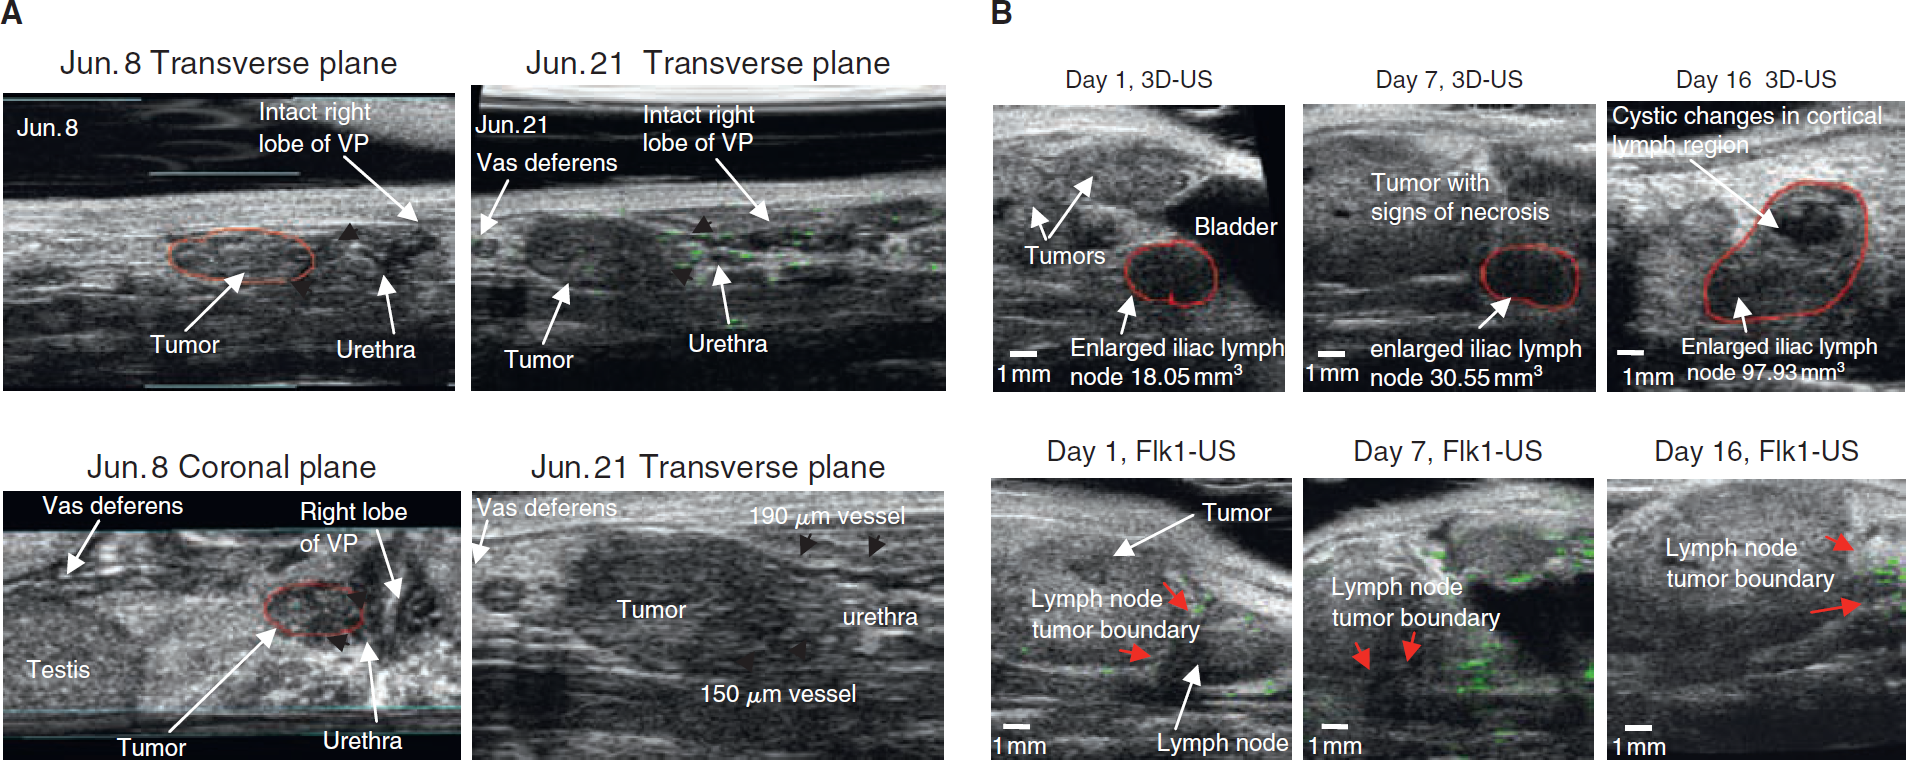
Longitudinal scanning by Flk1-targeted enhanced ultrasound (US) imaging of the tumor boundary area for predictive imaging of tumor-associated vascular recruitments near the urethra (A) and (B) lymphatic metastases. A, Transverse and coronal views of tumor growth and vascular recruitments near the urethra of the area surrounding the tumor as Flk1-targeted enhanced US predicted from day 1 (June 8). B, Longitudinal observation (16 days) by three-dimensional US B-mode sagittal scans (first three panels) and Flk1-targeted enhanced US (bottom three panels) of a representative genetically engineered mouse with prostate cancer showing lymph node enlargement. The mean caudal lymph node volume (mm3) enlarged at three time points. Persistently increased Flk1-targeted enhanced US signals in the areas surrounding the tumor near the lymph node correlated with this enlargement. Bar size: 1 mm. VP = ventral prostate.
Pelvic lymph node metastasis (shown in Figure 2D) is the first metastatic deposit site observed in our GEM-CaP model.11,12,19,20 Figure 5B demonstrates in a longitudinal observation of a GEM-CaP (40 weeks of age) that the increased Flk1-targeted enhanced US signal around the boundary of the tumor and pelvic lymph basin provided predictive imaging of lymph node changes. Flk1-targeted enhanced US images (middle three panels) reveal increased Flk1 signals in the surrounding area of the tumor, close to the pelvic lymph node. The first three panels show anatomic three-dimensional US images at three time points, demonstrating that the volume of the pelvic lymph node enlarged rapidly from 18.05 (day 1) to 30.55 mm3 on day 7 and 93.73 mm3 on day 16. Although the echogenicity of the majority of the node seen on day 16 remained constant, a cortical portion along the ventral surface, proximal to the largest tumor, appeared to have cystic changes. This may indicate metastatic changes downstream of preceding elevated levels of Flk1-targeted enhanced US imaging signals
Discussion
We report the application in a GEM-CaP model of molecular imaging technique using targeted enhanced US with US imaging contrast agent conjugated with an important angiogenesis controller Flk1 (VEGFR2). Transgenic GEM-CaP models, different from nude mice implants, demonstrate the salient aspects of CaP, including greater overall reproducibility of a complete process of tumorigenesis and tumor progression, pathologic grading, metastasis, and angiogenesis, offering the opportunity to explore the targeted MBs as a diagnostic agent at both early and late stages of the disease.
We demonstrate in our GEM models that the new imaging technique possesses high sensitivity and specificity at a molecular detection level comparable to histopathology and prior to the development of tumors detectable by conventional US imaging. This is because (1) higher levels of Flk1 molecular signals identified in GEM ranging in age from 4 to 6 months with intact and normal-appearing prostates (based on B-mode speckled pattern appearance) were actually all developed microscopic tumors.11–13 (2) We used the tissues surrounding the bladder as controls as they are the tissues closest to the prostate. Owing to a thus far unidentified reason, invasion or metastasis to the bladder in our GEM-CaP models was rarely observed, at least by gross pathology and microimaging, in contrast to pelvic lymph node metastasis.11,12,19 The bladder was clearly detectable by microimaging with three-dimensional US12,13 and high-frequency Doppler US, 14 as we have reported. However, we demonstrated that the bladder tissue provided no Flk1-targeted enhanced US signals, suggesting that molecular imaging was specific for the tumorigenic processes occurring within the prostate tissue.
The advantages of the Flk1-targeted enhanced US technique were demonstrated in most of the GEM (n > 5), in which abnormally elevated Flk1 signals were observed surrounding the prostate tissue with CaP development (see Figure 1, E and F; Figure 2, I, J, and K; Figure 4; and Figure 5), relative to the nearby bladder (external negative control tissue). This may indicate that the molecular diagnosis of micrometastases by Flk1-targeted enhanced US imaging is at a histopathologic level as well. Increased Flk1 expression could be found in four major regions outside the tumor margins: the margins between two developing tumors, the border between the urethra and the lobes of the prostate, areas close to the pelvic lymph node basin, and the perivascular regions of recruited tumor blood vessels. Histologic findings indicate that Flk1-targeted enhanced US could identify potential regions with active angiogenesis that were at risk of subsequent gross tumor development. Thus, we hypothesize that elevated Flk1-targeted enhanced US signal in regions outside the established tumor margin could serve as a predictive marker for locoregional spread by indicating where the developing tumor front might encroach and metastasize. The value of molecular imaging includes (1) early detection of tumor growth while the tumor is smaller than 2 to 3 mm in size, a range at which only biochemical or pathologic analysis on biopsy samples normally can provide diagnosis, and (2) early detection of locoregional spread by identification of molecular changes in uninvolved prostate tissue, adjacent soft tissues, and pelvic nodes at risk of metastatic involvement, which may implicate the predictive imaging potential of Flk1-targeted enhanced US for metastatic pelvic lymph node involvement. Lymph node metastasis is the most frequently (almost 100%) observed initial site of CaP metastasis11,12,19,20 (see Figure 2D) in our GEM model and in the TRAMP model.11,15 The potential for molecular diagnosis and prognosis by targeting Flk1 to CaP was confirmed by three-dimensional US microimaging (developed in our laboratory),12,14 as well as by gross pathology, histology, and immunohistochemical evidence.
This article demonstrates that, based on both molecular and microultrasound imaging of our GEM-CaP model, Flk1 expression must be upregulated and the Flk1 protein must be accumulated to a peak higher in all solid tumor sizes before angiogenesis is switched on, which is normally recognized to occur in solid tumors at the 2 to 3 mm size. Flk1 expression, based on targeted enhanced US signal, appears to rise during early tumor initiation phases, when US findings show no visible lesions but do detect subtle speckled pattern changes within the prostate region. Statistically significant (p < .05) higher levels of Flk1 molecular signals (showing a heterogeneous pattern) were identified in the abnormal yet intact prostate group compared with the normal and intact prostate group. This increase in Flk1 expression and signal occurred prior to the angiogenesis switch-on phase and vascularity peak, as we previously reported.12,14 Flk1-targeted enhanced US signal decreased to stabilized levels in all tumor-positive groups as imageable tumors (i.e., > 2–3 mm) developed. Tumors ranging in volume up to 500 mm3 showed no statistically significant difference in Flk1-targeted enhanced US imaging signals when comparing tumors within three volume subgroups. However, it should be noted that there were substantial heterogeneous regional Flk1-targeted enhanced US signals within small and medium tumors as demonstrated by IHC analysis by Flk1 antibody. We described that a vascularity peak must be established prior to tumor volume expansion after the angiogenesis switch-on stage (2–3 mm size solid tumor) using a functional angiogenesis imaging technique (power Doppler US) 14 in our GEM-CaP model. Apparently, this vascularity peak requires an expression peak of the tumor angiogenesis key factor VEGF and a receptor Flk1 (VEGFR2). This is consistent with a study in the TRAMP model, which reported that progression of GEM-CaP was correlated with increased expression of Flk1 (VEGFR2) and decreased expression of Flt1 (VEGFR1). 25
It is intriguing that the tumor requires an accumulation of Flk1 expression phase prior to passing over the angiogenesis switch-on stage and that this early signaling event is detectable by molecular imaging. Our finding that the accumulation of Flk1 expression in precancerous tissues fits well with the report that Flk1+ cells can act as “vascular progenitor cells,” 5 or at least the activated endothelium, for neoangiogenesis. We may explain that similar to the Flk1 role in embryonic stem cell development, cancer also requires such Flk1+ progenitor cells to be accumulated, or at least the activated endothelium, for neo-angiogenesis to break the angiogenesis barrier with the 2 to 3 mm size limit. This is supported by the results of our IHC of Flk1 studies, the salient points of which are as follows: (1) Only well-moderately differentiated CaP cells expressed Flk1, and poorly differentiated CaP cells (in small, medium, and large tumors, in neuroendocrine or small cell carcinoma cells) do not express Flk1 where only small vessels Flk1 are expressed (see Figure 3). This is the major reason why Flk1-targeted enhanced US imaging can detect the differences (see Figure 2J). It is possible that an improved Flk1-targeted enhanced US protocol might be applied to a noninvasive grading histopathology characterization tool rather than to detecting the presence or absence of cancer. (2) The multifocality and heterogeneity of CaP before the angiogenesis switch-on phase are the major features, and poorly differentiated CaP is mostly homogeneous. (3) The higher heterogeneity of Flk1+ expression was found cells in this stage (cells outside the ring of the gland, intra- and interductal and blood vessels) rather than poorly differentiated CaP (Figure 2, G and H). (4) Higher intensity of Flk1 staining at this stage is observed before the tumor angiogenesis switch-on stage (see Figure 2, B and G). We may assume that Flk+ tumor cells in well-moderately differentiated CaP are directing tumor-specific angiogenesis in poorly differentiated CaP. To fully address this issue, we need to probe more markers such as to co-stain the Flk1+ cells with CD133 and CD34 to evaluate if these are progenitor cells.
Molecular diagnosis and prognosis of tumor progression and metastasis are a milestone likely to alter clinical cancer research substantially in the near future. Our experiment supports the premise that Flk1-targeted enhanced US imaging has the potential to diagnose and stage tumor progression and metastasis; however, our results do not directly demonstrate the ability of Flk1-targeted enhanced US to enhance extravascular travel (such evidence would require colabeling experiments). US-targeted MB destruction takes advantage of the physical properties of MBs and provides a mechanism for the focal release of entrapped materials.1,2,16 A mechanism of plasma membrane “sonoporation” was proposed in which the reversible pore formation up to 100 nm in effective diameter with a half-life of a few seconds is the dominant mechanism underlying Flk1-targeted enhanced US. 2 MBs release their contents on destruction, including any hydrophobic substances, including plasmid DNA for transfection,16,26–29 which are larger than Flk1 antibodies. Targeting MB and US-assisted MB-based drug delivery systems might provide a step toward the application of targeted personalized diagnostics and targeted molecular therapy for cancer at its earliest stages.
Footnotes
Acknowledgment
Financial disclosure of authors: This work was supported by grants from the Canadian Institute of Health Research (MOP-77684), National Institutes of Health-National Cancer Institute (2 U01 CA084296-06), the Ontario Institute of Cancer Research (07NOV-52), the Canada Foundation for Innovation, the Ontario Innovation Trust, and the Ontario Research and Development Challenge Fund-Ontario Consortium for Small Animal Imaging. Aaron Fenster is a Canada Research Chair in Biomedical Engineering supported by funding from the Canada Research Chairs Program.
Financial disclosure of reviewers: None reported.