
Abstract
We used magnetic resonance spectroscopy to determine whether orthotopic mouse brain tumors grown as xenografts in immunocompromised mice either from human brain tumor cells implanted immediately after surgery or from cultured human tumor lines show metabolic profiles comparable to those of the original tumors. Using a 7 T scanner, spectra were acquired from mice with a human atypical teratoid/rhabdoid tumor (AT/RT) either implanted directly from the surgical specimen or first grown in culture, directly implanted choroid plexus carcinoma (CPC), and two medulloblastoma cell lines. The results were compared with spectra from these same tumors or tumor types in patients and with controls. Metabolic variability of tumors from a single cell line was also evaluated using the medulloblastoma lines. The main metabolic features of human tumors were qualitatively replicated in xenografts. AT/RTs in mice exhibited choline, creatine, and myo-inositol levels comparable to those observed in the patient. As in patients, choline was prominent in experimental CPC. Tumors from a single cell line were comparable. Significant correlations were found with key metabolites in humans and mice; however, differences including lower lipids in the implanted AT/RTs than in patient spectra and taurine observed in all animal spectra were also noted. The causes of these dissimilarities warrant further investigation.
ANIMAL MODELS of brain tumors are essential for the effective development and testing of novel therapies. Frequently, therapies that have been shown to be effective in animal models do not show the anticipated benefit in clinical trials. One reason for this is that until recently, these animal brain tumor models were typically heterotopic models in which brain tumor cells were injected subcutaneously. Tumor growth could then be easily followed with caliper-based methods, and the effects of treatment regimens could be assessed with little difficulty. However, it is well known that the tumor microenvironment plays a significant role in tumor growth and response to therapy. 1 One example is the differential sensitivity of orthotopic, intracranial versus subcutaneous U87MG glioblastoma and DAOY (medulloblastoma) tumors to the αvβ3/αvβ5 integrin inhibitor RGDfV (Cilengitide). 2 When grown intracranially, these tumors are efficiently inhibited by RGDfV, but subcutaneous tumors implanted in the flanks of the same mice were resistant to RGDfV. 2
With the realization of the importance of the tumor microenvironment has come the development of orthotopic models of brain tumor in animals. It remains to be established how well these new models reflect the clinical patterns of these tumors in humans. A particular subpopulation of tumor cells (eg, the most aggressive, robust, or most primitive cells) may be selectively cultured over time or grow more effectively once injected into the mouse brain, and the resulting tumors may not truly represent their clinical counterparts. Tumors may also undergo spontaneous phenotype changes and exhibit altered physiologic processes triggered by microenvironmental conditions such as hypoxia, which may occur as a result of the experimental methodology involved in implantation.3–6
Imaging has considerably streamlined animal research, mainly by providing noninvasive means to monitor tumor growth. Magnetic resonance imaging (MRI), owing to its excellent soft tissue contrast, is often the method of choice in diagnostic imaging of brain tumors but is now also increasingly used for animal research. MRI can be readily combined with magnetic resonance spectroscopy (MRS), which provides information about cellular metabolism. Both methods are unique and distinct from other imaging modalities because there is no harm associated with MRI and MRS, because they can be equally applied in humans and small animals, and because of the wealth of anatomic, functional, and metabolic information they provide.
The goal of this study was thus to determine the extent to which in vivo metabolic features of pediatric brain tumors are replicated in orthotopic mouse brain tumor models. Pediatric brain tumors are biologically very heterogeneous. In contrast to adults, in whom the majority of primary brain tumors are astrocytomas, a significant portion of pediatric tumors are primitive neuroectodermal tumors, ependymomas, germ cell tumors, and others. These tumor types show significant metabolic differences.7–10 If orthotopic mouse models of these tumors demonstrate characteristics similar to those of their human counterparts, then hypotheses can be tested. Additionally, although in humans these tumors are often removed surgically soon after discovery, in mouse models, they can be allowed to grow and metabolic patterns observed in particular tumors and tumor types can be followed over time, possibly leading to the development of novel biomarkers of malignancy, chemo- or radiation resistance, and recurrence that could otherwise not be easily obtained.
Materials and Methods
Patient Studies
Two patients, one (male, 1.5 years) with pathologically proven atypical teratoid/rhabdoid tumor (AT/RT) and a second one (male, 2 years) with a recurrent choroid plexus carcinoma (CPC), were prospectively enrolled for this study. Samples of the resected tumors were available for experimentation, which included direct implantation into mouse brain and the generation of cell lines under an established research protocol at this institution. Also, magnetic resonance spectra of 30 previously studied patients with confirmed medulloblastoma and 3 patients with confirmed CPC were reviewed. Control data for normal tissue were generated from 26 spectra (9 occipital gray matter, 9 parietal white matter, and 8 basal ganglia) acquired from 23 subjects (2–10 years) (Table 1). These subjects were healthy controls participating in unrelated research and patients with negative MRI and unremarkable clinical follow-up that had a clinically indicated MRS examination (eg, to rule out hypoxic injury, encephalitis). The retrospective review of the magnetic resonance spectra and clinical information for all subjects was approved by the local Institutional Review Board (IRB).
In all cases, in vivo MRS of untreated lesions or normal tissue was performed using single-voxel point-resolved spectroscopy with an echo time (TE) of 35 milliseconds and repetition time (TR) of 1.5 seconds. All studies were performed on a standard 1.5 T clinical scanner (Signa LX, GE Healthcare, Milwaukee, WI). Spectra were processed as described in previous publications using fully automated LCModel software version 6.1-4F (Stephen Provencher Inc., Oakville, ON).8,11,12 Metabolite concentration ratios relative to choline of N-acetylaspartate (NAA), creatine (Cr), total choline (Cho), myo-inositol (mI), glutamate + glutamine (Glx), taurine (Tau), and lactate (Lac, in mmol/liter), as well as lipids (and possibly underlying macromolecules) at 0.9 ppm (parts per million) and 1.3 ppm (LipMM09 and LipMM13), were determined. Cho was chosen as the reference instead of the more commonly used Cr because Cr levels were very small in some tumors, such as CPC, compromising the accuracy of its quantitation. In addition, metabolites normalized to Cho levels were computed.
Animal Studies
Orthotopic brain tumors were grown intracranially in mice both from cultured human tumor cell lines and from human tumor cells implanted directly as xenografts into mouse brains following resection from the brain of the patient and pathologic processing. Five different human tumor cell types were used in these studies. AT/RT and CPC tissue from the above patients was successfully directly implanted into the brains of two mice for each tumor type (a total of four mice). Three spectra from the resulting AT/RTs and two spectra from resulting CPCs in these mice were acquired before animals developed symptoms and had to be sacrificed according to the study protocol. Two separate cell lines were created and cultured from the original patient AT/RT tissue samples and later implanted and grown in two and three mice, respectively. Eight spectra from these five mice were acquired (see Table 1). For comparison with human medulloblastoma data, two medulloblastoma cell lines were studied: UW228-2 (four mice, six studies) and D425MED (four mice, five studies) (see Table 1). The human medulloblastoma lines UW228-2 and D425MED were generous gifts from Dr. John Silber (University of Washington, Seattle, WA) and Dr. Darell Bigner (Duke University, Durham, NC), respectively. Four age- and sex-matched mice without tumors were studied to generate control data for normal brain in mice.
Cell Preparation and Culture
CPC and AT/RT specimens (designated COG-CP-358× and COG-AR-359x, respectively) were obtained and processed at Children's Hospital Los Angeles as part of an IRB-approved Children's Oncology Group protocol for pediatric tumor processing, analysis, cell culture, and initiation of xenografts. Appropriate parent consent was obtained. The freshly resected tumor specimens were received in a sterile container following examination by the attending surgical pathologist. Tumor tissue was minced in Dulbecco's Modified Eagle's Medium (DMEM) using a surgical blade followed by pipetting under sterile conditions to generate a human serum-cell suspension mix and was ready for implantation within 20 to 30 minutes from the time of resection. Three to four microliters of the cell mix was then implanted stereotactically via a 27-gauge needle into the brains of immunodeficient mice, as described in the section below. All injections were completed within 1 to 1.5 hours after receipt of tumor.
Absolute Choline Levels (Relative to Normal Tissue) and Metabolite Ratios Relative to Choline for Orthotopic Tumors in Mouse Brain and Tumors in Human Brain Determined with In Vivo Magnetic Resonance Spectroscopy
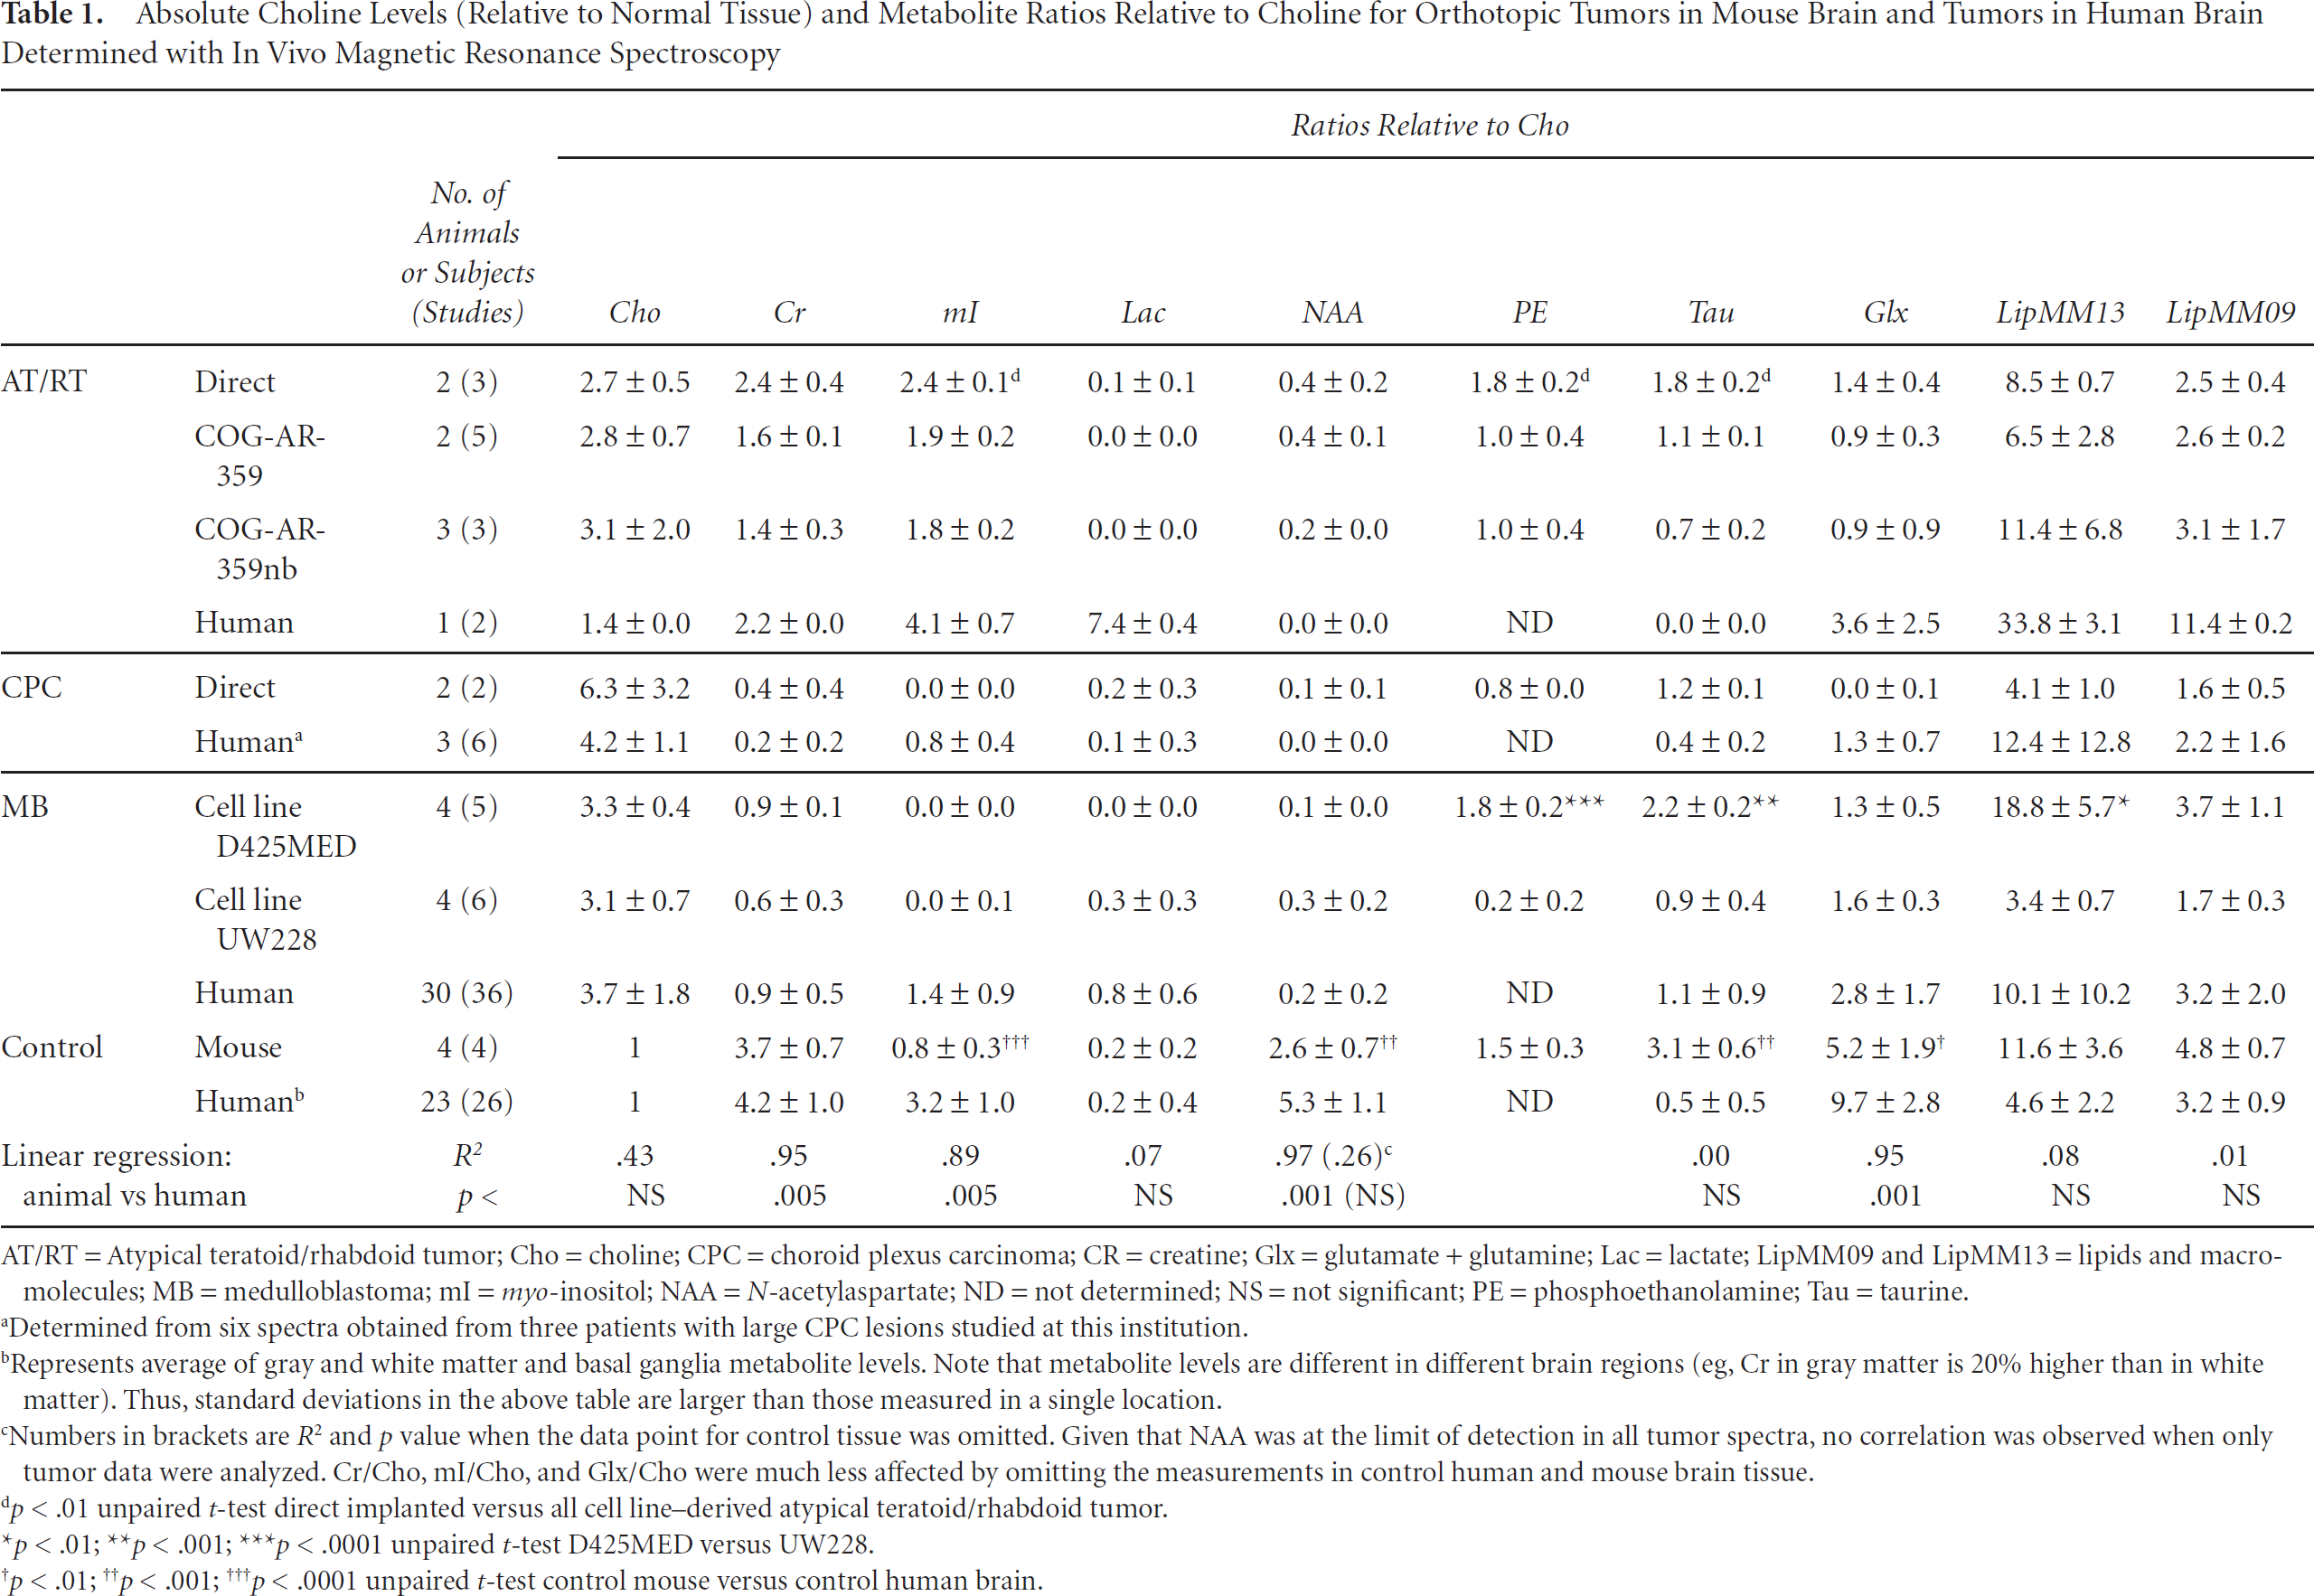
AT/RT = Atypical teratoid/rhabdoid tumor; Cho = choline; CPC = choroid plexus carcinoma; CR = creatine; Glx = glutamate + glutamine; Lac = lactate; LipMM09 and LipMM13 = lipids and macromolecules; MB = medulloblastoma; mI = myoinositol; NAA = N-acetylaspartate; ND = not determined; NS = not significant; PE = phosphoethanolamine; Tau = taurine.
Determined from six spectra obtained from three patients with large CPC lesions studied at this institution.
Represents average of gray and white matter and basal ganglia metabolite levels. Note that metabolite levels are different in different brain regions (eg, Cr in gray matter is 20% higher than in white matter). Thus, standard deviations in the above table are larger than those measured in a single location.
Numbers in brackets are R2 and p value when the data point for control tissue was omitted. Given that NAA was at the limit of detection in all tumor spectra, no correlation was observed when only tumor data were analyzed. Cr/Cho, mI/Cho, and Glx/Cho were much less affected by omitting the measurements in control human and mouse brain tissue.
p < .01 unpaired t-test direct implanted versus all cell line-derived atypical teratoid/rhabdoid tumor.
p < .01
p < .001
p < .0001 unpaired t-test D425MED versus UW228.
p < .01
p < .001
p < .0001 unpaired t-test control mouse versus control human brain.
Cell lines from the AT/RT surgical specimens were grown in two different media to test for optimal growth conditions. One line (designated COG-AR-359) was cultured in Iscove's Modified Dulbecco's Medium with 20% fetal bovine serum, 4 mM
Both medulloblastoma cell lines were grown in Ham's F12 media, 10% fetal bovine serum, 2 mM Hepes buffer, and 3.4 g/L of sodium bicarbonate in 5% CO2 at 37°C.
Brain Tumor Implantation
Female nude or NOD/SCID mice, 4 to 6 weeks old, were purchased from Harlan Sprague-Dawley (Indianapolis, IN) or the Jackson Laboratories (Bar Harbor, ME), respectively. Brain tumor cells were implanted intracranially under ketamine-xylazine (100 mg/kg and 10 mg/kg, respectively) anesthesia, using a stereotactic device as previously described.2,13,14 Briefly, skin was incised and a hole in the skull was made using the tip of a 25- or 27-gauge needle placed 2 mm lateral and 0.5 mm anterior to the bregma. Injection was in the frontal lobe to a depth of 3.3 mm from the dural surface. Tumor cells (1–2 × 10⁵ tumor cells in 1–2 μL of phosphate-buffered saline) were injected with a 30-gauge 5 μL Hamilton syringe using a Harvard Precision delivery pump that allows injection of as little as 1 μL tumor cell suspension (1 × 10⁵ cells/μL) over a 5- to 10-minute period. Minced tumor specimen samples (≈3 × 10⁵ cells in 3 μL cell mix media as in the section above) were injected through a 27-gauge needle because the cell mixture tended to be more viscous than the cultured lines. The needle was then retracted slowly (5–10 minutes), the hole in the skull was occluded with bone wax, and the skin was closed with dermal glue. Mice were given acetaminophen (Tylenol, McNeil Consumer Healthcare, Fort Washington, PA) in their drinking water postprocedure and were monitored daily for excessive pain or discomfort. The prolonged injection time and slow needle removal prevent increase in the intracranial pressure and leakage of tumor cells around the needle into the subarachnoid space at the time of tumor implantation, helping ensure that tumor growth remains in the brain parenchyma. The high viscosity of the tumor cell suspension precludes increasing tumor inoculum.
Animal Imaging
After injection, tumor growth was assessed with biweekly MRI using a 7 T animal magnetic resonance system (Pharmascan, Bruker, Ettlingen, Germany). Mice were first sedated with and then maintained under 1.5 to 2% isoflurane. Noncontrast T2-weighted RARE imaging (TR = 3 s, TE = 36 ms, number of excitations = 4) was performed with a 19 mm radiofrequency coil. The field of view was 2.6 cm, and the final voxel sizes were 0. 100 × 0.100 × 0.670 mm slice thickness, with contiguous slices. When tumors were deemed to be large enough for MRS studies, single-voxel point-resolved spectra (TE = 20 milliseconds, TR = 2.5 seconds, 512–1,024 averages) were acquired. Spectral width was 5,000 Hz, and 512 to 1,024 scans were averaged, resulting in acquisition times of ≈22 to 45 minutes. A separate spectrum acquired without water suppression was used for eddy current correction. Regions of interest (ROI) were typically 2.5 × 2.0 × 2.0 mm3 and were placed into the solid portions of the tumors. All images covering the ROI were reviewed to ensure that no surrounding tissue was enclosed. One CPC spectrum was omitted owing to significant partial volume of surrounding tissue. LCModel software was used for processing; however, this time, the basis set comprised spectra of model solutions acquired on the 7 T system. In addition to the metabolites named above, a model spectrum of phosphoethanolamine (PE), a metabolite of membrane phospholipids that cannot be quantified at low field strength, was added to the basis set. The Cho concentration normalized to Cho levels in control mice and metabolite concentration ratios relative to Cho were computed.
Animal preparations and care followed National Institutes of Health guidelines and were approved by the local animal care committee.
Statistical Analyses
Cho levels and metabolite concentration and lipid intensities relative to Cho were tabulated as mean ± SD. Ratios obtained from animal spectra were plotted versus human data and linear correlations were computed. Unpaired two-tailed Student's t-tests with unequal variance were used for statistical comparisons.
Results
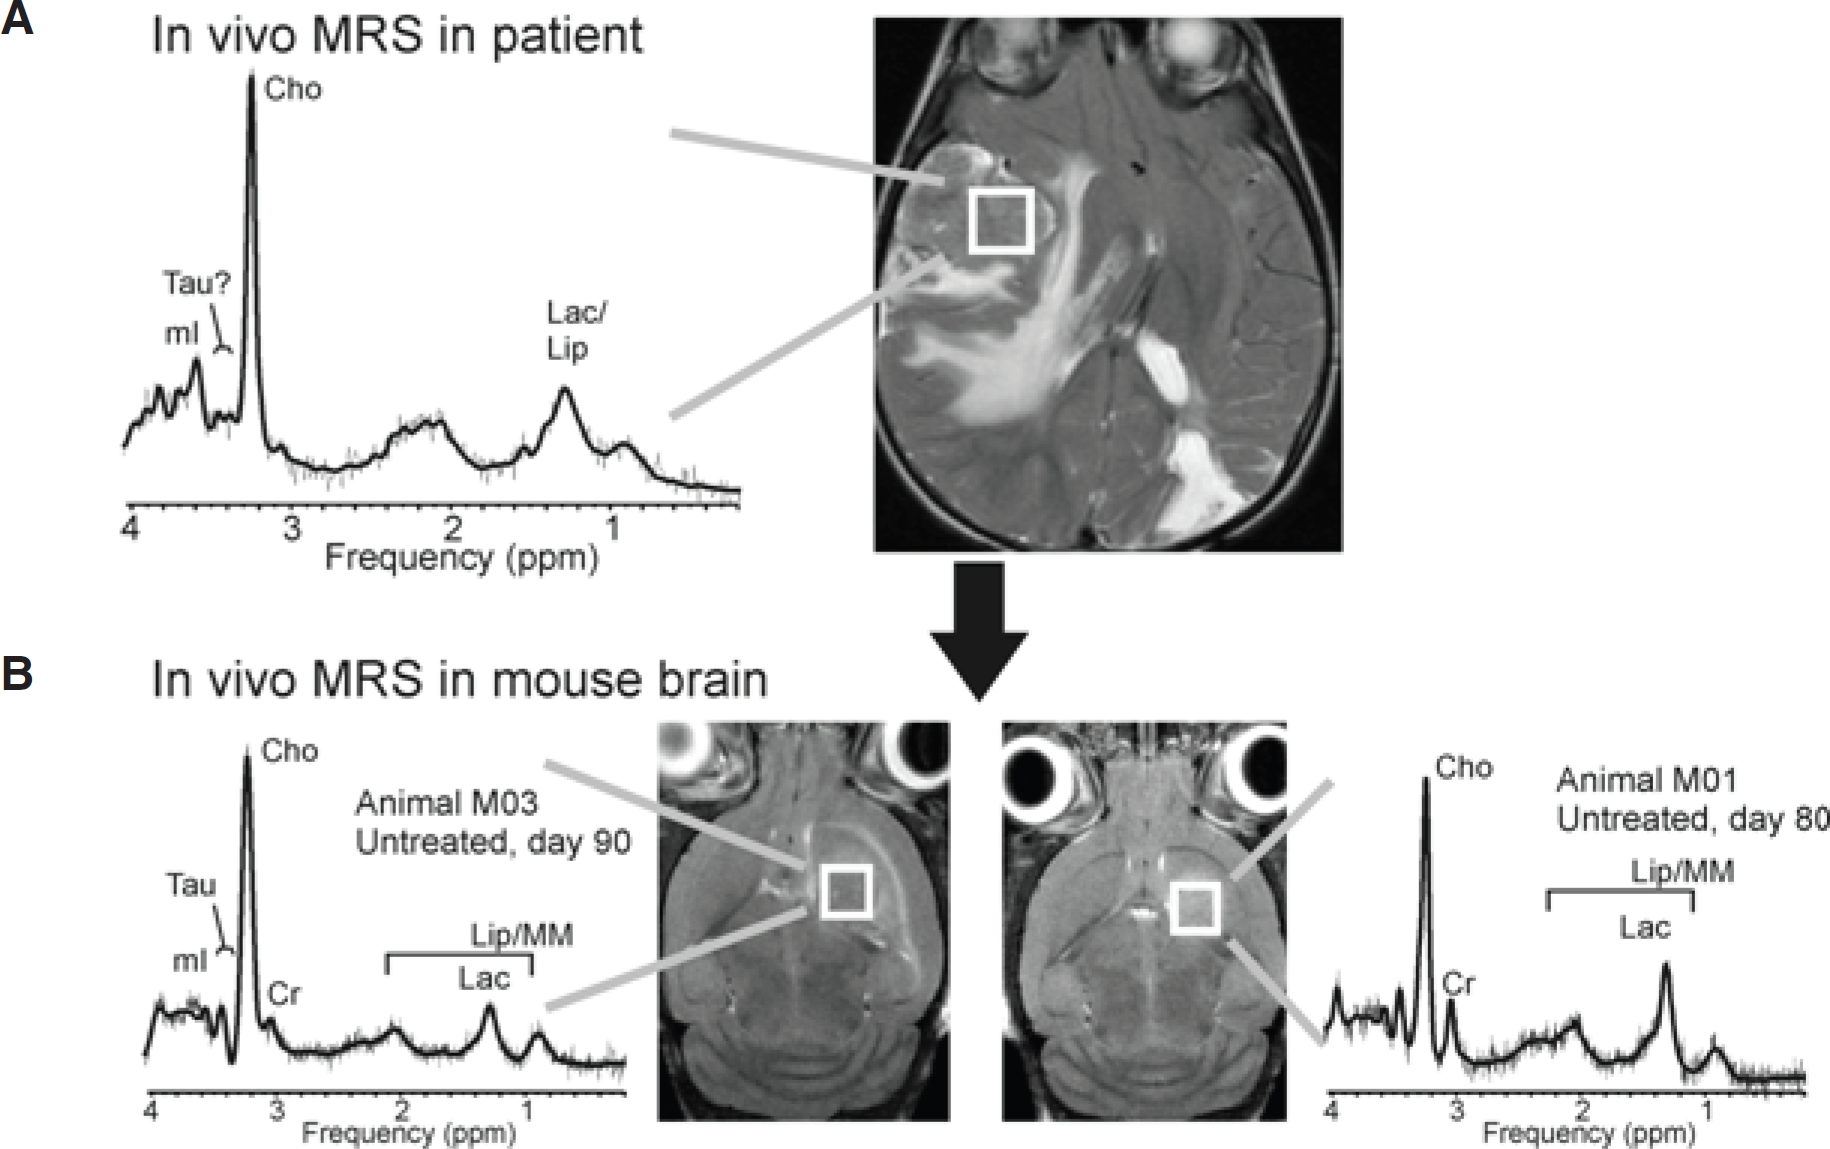
In vivo magnetic resonance spectra of AT/RTs and CPCs in patients showed readily distinguishable patterns. Whereas Cho dominates the spectrum of CPC, the spectra acquired from the AT/RTs showed prominent lipids, readily detectable Cr and mI, and Cho levels only moderately more prominent than Cr.

Plotted are creatine/choline (Cr/Cho) and myo-inositol/choline (mI/Cho) measured in mouse brain tumor (separate data points for direct implanted and cell line-derived atypical teratoid/rhabdoid tumor [AT/RT] and the two medulloblastoma [MB] cell lines) versus measurements in humans. Linear regression lines were fitted to the data. A significant correlation was observed between Cr/Cho, mI/Cho, and glutamate + glutamine/Cho (not shown for clarity) measurements in humans and mice (see Table 1). CPC = choroid plexus carcinoma.
Features of Human Spectra versus Orthotopic Mouse Tumor Model Spectra
Overall, there was a significant correlation of Cr/Cho, mI/Cho, and Glx/Cho measurements in human tumors and in orthotopic mouse brain tumors (see Table 1 and Figure 1). When all data points were included, NAA/Cho also correlated. However, NAA levels were generally very low in all tumor spectra (humans and animals), and the correlation disappeared when the control data point was omitted. No correlation was observed between mouse and human data for Lac/Cho, Tau/Cho, LipMM13/Cho, and LipMM09/Cho. As in human brain tumors, where Cho concentrations are generally higher than in normal tissue, the Cho levels of all orthotopic mouse brain tumors were higher than in control mouse brain tissue. Despite this, there was no significant linear correlation between Cho levels of the different tumors in humans and animals (see Table 1).
Differences between AT/RT in Human and Mice
In contrast to the spectrum acquired in the human subject, spectra of directly implanted and cell line-derived AT/RTs did not show a prominent signal from lipids and Lac. There was also no evidence for Tau in the patient spectrum, whereas Tau was identified in all mouse AT/RT spectra (Figure 2). When spectra of directly implanted AT/RTs were compared with AT/RTs derived from the cell line, mean mI/Cho, PE/Cho, and Tau/Cho were smaller (all p < .01) in cell line-derived tumors than in directly implanted tumors (see Table 1 and Figure 2A).

A, A 1.5 T in vivo spectrum of atypical teratoid/rhabdoid tumor (AT/RT) prior to surgical resection (upper left). A 7 T in vivo spectrum of a tumor grown from directly implanted tissue (lower left). From tumor samples, cell lines were generated that were subsequently used to grow tumors in mice. Typical spectra for cell line-derived tumors using different growth media are shown (lower middle and right). Human spectra, as shown here, demonstrate depleted N-acetylaspartate, choline (Cho) moderately more prominent than creatine (Cr), and clearly detectable myo-inositol (mI). The levels of these metabolites were similar in mouse AT/RTs. On the other hand, lipids and lactate (Lac) were prominent, and there was no evidence for taurine (Tau) in the patient spectra, whereas, in contrast, lipids and Lac levels were comparably small in mouse AT/RTs, whereas Tau was present in all spectra. B, A 1.5 T in vivo spectrum of recurrent AT/RTs in a patient. The spectrum contains prominent peaks of mI, Cho, Cr, and Lac + lipids (and possibly macromolecules) as in the original tumor; however, the relative peak heights of Lac and lipids correspond more closely to the mouse AT/RT spectra than the original patient spectra (A). Also noted was a peak consistent with scyllo-inositol at approximately 3.4 ppm that was not observed in the spectra of the lesion at diagnosis. bFGF = basic fibroblast growth factor; DMEM = Dulbecco's Modified Eagle's Medium; EGF = epidermal growth factor; IMDM = Iscove's Modified Dulbecco's Medium; LipMM = lipids and macromolecules.
In vivo magnetic resonance spectroscopy (MRS) of the same choroid plexus carcinoma (CPC) in a patient (A) and two mice with directly implanted tumor tissue (B). The tumor in the human subject was a recurrent CPC. The spectrum is highly consistent with the metabolic pattern, which was observed for untreated CPC at our institution, with the exception of the presence of signal attributable to taurine. We have not found elevated taurine (Tau) consistently in all CPC tumors studied at this institution, but it is noteworthy that fully automated LCModel processing of the recurrent CPC was suggestive for the presence of some Tau in this individual case. Two CPC spectra acquired in mouse brain strongly resembled the pattern observed in patients. Note that the spectral appearance of some metabolites, including taurine, is different at 1.5 and 7 T. Cho = choline; Cr = creatine; Lac = lactate; LipMM = lipids and macromolecules; mI = myo-inositol.
This patient returned with a recurrence several months following surgical resection, and a spectrum of the recurrent tumor was obtained. Although demonstrating similarities overall to the original tumor spectrum with peaks of mI, Cho, and Cr, this spectrum bears similarity to the AT/RT spectra obtained in mice, with less prominent lipid and Lac peaks (see Figure 2B).
Choroid Plexus Carcinoma
CPC spectra in humans are dominated by prominent Cho. 8 The spectrum of this recurrent CPC is highly consistent with the metabolic pattern, which was observed in other CPC patients who were studied at this institution at baseline (Figure 3). Two CPC spectra acquired in mouse brain strongly resembled the pattern observed in patients.
Medulloblastoma
As in medulloblastoma spectra in humans, Cho and Tau were prominent in all spectra (Figure 4). On the other hand, mI, which is present in human medulloblastoma, was not observed or was at very low levels in both medulloblastoma cell lines in all spectra. Spectra of the two medulloblastoma cell lines were metabolically not different with respect to Cho levels, Cr/Cho, mI/Cho, NAA/Cho, Lac/Cho, Glx/Cho, and LipMM09/Cho (all not significant). However, PE/Cho and Tau/Cho were significantly higher in D425MED than in UW228 (p < .0001 and p < .001). Also, LipMM13/Cho was higher for D425MED than for UW228 (p < .01).
Postnecropsy of the mice, all of these tumors showed histologic features consistent with the original human tumors or tumor types.

Representative spectra obtained from “typical” human medulloblastoma (left) and from cell line-derived (D425MED) medulloblastoma in mouse (right). High choline levels and prominent lipid as well as taurine can be found in medulloblastoma and in mouse brain. Cho = choline; Cr = creatine; mI = myo-inositol; MM = macromolecules; PE = phosphoethanolamine; Tau = taurine.
Discussion
In this study, we investigated for the first time to what extent in vivo metabolic features of human brain tumors are replicated in orthotopic mouse brain tumor models. Although several groups have used proton or phosphorus-based spectroscopy to examine brain tumors in animals, those studies focused on canine tumors, 15 tumor perfusion effects on inorganic phosphate-nucleoside triphosphate ratios, 16 hyperglycemia in gliomas, 17 and comparisons of glioma phenotypes. 18 In our experiments, we have found qualitative and quantitative similarities between original tumors in humans and these and similar tumors in mice. For example, two spectra of AT/RTs in the patient showed moderately prominent Cho and high levels of mI. Both features were also consistently observed in 11 spectra of directly implanted and cell line-derived AT/RTs in mice. Also, CPC spectra in patients and in mice are dominated by prominent Cho. Additionally, several groups, including ours, have reported high levels of Tau in human medulloblastoma,11,19,20 which was also found to be prominent in the spectra of the two medulloblastoma cell lines used in this study.
The quantitation of metabolite concentrations at different field strengths (1.5 and 7 Tesla) is not entirely equivalent owing to the different spectral appearances of metabolites at different field strengths. This may cause the measured concentrations of the same metabolite to be slightly and systematically different. But we were nevertheless able to detect significant correlations because correlation analyses such as we have used in these studies are “scale” independent.
The different culture media of the AT/RT lines did not lead to significant differences in their spectra in mice. There were also few significant differences between the AT/RTs that grew in mice after direct implantation and the cell line-derived ones; however, mean mI/Cho, PE/Cho, and Tau/Cho were smaller (all p < .01) in cell line-derived tumors than in directly implanted tumors. Given that mI and PE are involved in intracellular signaling and cell membrane formation, respectively, these differences may reflect differences in growth or signaling capacities affected by in vitro culture conditions. When data from all AT/RT mice spectra were pooled, lipid levels were slightly higher than in control mice (both LipMM13 and LipMM09 ≈ 150% of control levels) but less prominent than in the human AT/RT spectra. Compared with the human spectra, lipid levels were low.
Lac was also generally lower relative to Cho in the AT/RTs and medulloblastoma mouse brain tumors we studied compared with those same tumor types in humans. The reason for this is likely related to tumor growth and metabolism. The metabolism of tissue is affected by its environment. For example, under hypoxic conditions, Lac is expected to be elevated owing to relatively increased anaerobic metabolism in tumors. In tumors that outgrow their blood supply, cell death causes membrane degeneration and the release of fatty acids and lipid formation. It is possible that in orthotopic models in mice, the tumors are not large enough to develop extreme hypoxia and areas of necrosis relative to the levels observed in their larger counterparts in humans, thus rendering the Lac and lipid levels lower overall.
It is not clear why mI levels were lower in medulloblastoma lines growing in mice compared with humans. The lower levels may be a function of these two specific cell lines or related to changes in their properties during the course of cell line derivation, as well as differences owing to the microenvironment in the mouse frontal lobe compared with the human cerebellar milieu and implantation versus spontaneous tumor formation. It is also possible that these two medulloblastoma cell lines may be representative of the more malignant medulloblastomas and of different oncogenic backgrounds because continuous tumor cell lines can usually be derived only from the most malignant tumors.
Although elevated Tau levels in medulloblastoma may be a useful marker of this tumor type in patients, the exact cause and effect of this elevation remain unknown, 11 and the presence of Tau in all spectra in mice will mitigate its potential use as a biomarker in these models of human tumors. Clearly, the levels observed in the human-derived AT/RT and CPC in mice do not reflect the pattern typically seen in patients. Given that Tau levels were even more elevated in normal mouse brains, though, Tau may occur at naturally high levels in the mouse brain in the region of our tumor implantation. These areas, like the majority of the mouse brain, are dominated by gray matter, and our earlier work has indicated a higher level of Tau in gray matter than in white matter in the human pediatric population. Also, typical mouse chow contains a small level of Tau, and it may be that this Tau crosses the blood-brain barrier and accumulates for at least some period in the brains of mice, elevating these levels beyond what they would be in the presence of a Tau-depleted diet. Future studies will have to be performed to clarify the origin of the levels observed in mice.
Overall, in this study, metabolic differences between tumor types and similarities within tumor types were consistently observed in mice and largely reflected similar metabolic characteristics observed in MRS of brain tumors in patients. Resonances attributable to the metabolites Cho, Cr, Glu, glutamine, mI, NAA, and lipids and Lac were observed in all tumor types. Notable differences in lipids and Lac levels and metabolites such as Tau were, however, also revealed. Although many of the metabolic features of the human tumors AT/RT, CPC, and medulloblastoma in patients appear to be replicated in orthotopic mouse models, providing further evidence that these models are indeed reflective of the clinical conditions they are meant to represent, the root causes for and significance of their differences warrant further investigation. Importantly, the very foundation of our studies and those of others worldwide involving animal models relies on these in vivo tumors accurately reflecting the clinical condition, which our studies have begun to address. Future studies will determine which metabolic features separate highly and moderately aggressive growing tumor subtypes in the mouse brain.
Footnotes
Acknowledgments
We would like to thank Arabhi Nagasunder for help with processing animal spectra. We also thank Gevorg Karapetyan for help with the preparation of the model solution and Dr. Shahab Asgharzedah for providing us with the UW228-2 cell line.
Financial disclosure of authors: This work was supported in part by a Pre-Institute Award from the US Pediatric Brain Tumor Foundation and by the Rudi Schulte Research Institute. This work was also supported in part by National Institutes of Health grant CA98568, by a gift from Grayson's Fund, by the Michael Hoefflin Foundation for Cancer Research, and by the T.J. Martell Foundation for Leukemia, Cancer, and AIDS Research.
Financial disclosure of reviewers: None reported.