
Abstract
We present an ultrasonography (US)-magnetic resonance imaging (MRI) coregistration technique and examine its application in a preliminary multimodal, multiparametric study in a preclinical model of breast cancer. Nine mice were injected with 67NR breast cancer cells and imaged 6 and 9 days later with 4.7 T MRI and high-frequency US. Tumor volumes from each data set were segmented independently by two investigators and coregistered using an iterative closest point algorithm. In addition to anatomic images, vascular endothelial growth factor receptor 2 (VEGFR2) distribution images from the central tumor slice using VEGFR2-targeted ultrasound contrast agent (UCA) and measurements of perfusion and extravascular-extracellular volume fraction using dynamic contrast-enhanced MRI were acquired from five mice for multiparametric coregistration. Parametric maps from each modality were coregistered and examined for spatial correlation. Average registration root mean square (RMS) error was 0.36 ± 0.11 mm, less than approximately two voxels. Segmented volumes were compared between investigators to minimize interobserver variability; the average RMS error was 0.23 ± 0.09 mm. In the preliminary study, VEGFR2-targeted UCA data did not demonstrate direct spatial correlation with magnetic resonance measures of vascular properties. In summary, a method for accurately coregistering small animal US and MRI has been presented that allows for comparison of quantitative metrics provided by the two modalities.
FOR A TUMOR to grow beyond approximately 1 to 2 mm3, it must recruit and form new vasculature as it can no longer rely on the passive diffusion of nutrients. 1 During this process of angiogenesis, several growth factors, including vascular endothelial growth factor (VEGF), are released from both tumor and endothelial cells, and new vessels develop in response to these. 2 With the development of vascular-specific contrast agents, medical imaging techniques have become much more sensitive to particular aspects of angiogenesis.3,4 For example, the advent of contrast-enhanced ultrasonography (CEUS) using microbubbles targeted to specific receptors permits the study of angiogenesis at a molecular level.5,6 A specific target that has been studied using CEUS is vascular endothelial growth factor receptor 2 (VEGFR2), a well-characterized proangiogenic receptor for VEGF type A. 7 In addition, it has been shown that dynamic contrast-enhanced magnetic resonance imaging (DCE-MRI) can assess physiologic characteristics such as perfusion, blood vessel permeability, extravascular-extracellular volume fraction, and blood volume.8,9 These parameters are extracted from models fit to time-intensity curves that describe the kinetics of an injected contrast agent as it enters and exits a region of interest. Combining these two modalities could provide complementary information about tumor vasculature by fusing both physiologic (DCE-MRI) and molecular (targeted CEUS) data. Moreover, correlations and comparisons of these types of data may be useful for their proper interpretation; both measures have been used independently as a measure of treatment response.6,9 Combining these metrics could provide more information about the status of the tumor that may predict treatment response faster than using the two measures independently.
The ability to accurately coregister imaging data obtained from different modalities can, in principle, provide a more complete characterization of tumor status in clinical applications, as well as new insights into tumor biology and drug testing in preclinical studies. One motivation for multimodality imaging is that any technique has its own set of strengths and weaknesses, and appropriate combinations of modalities can not only increase existing strengths but also alleviate existing weaknesses. A primary example of this is positron emission tomography (PET)-x-ray computed tomography (CT), whereby the molecular data provided by PET is registered with high-resolution structural imaging from CT to provide anatomic landmarks for areas of increased tracer activity. Indeed, the combination of structural and functional imaging data is well known and has been covered in several excellent reviews.10,11 More recently, efforts have been made to combine imaging modalities to evaluate cancer across biologic scales; for example, MRI and PET have been coregistered to investigate the relationship between hypoxia measured by fluorine-18 fluoromisonidazole-PET and perfusion measured with DCE-MRI. 12 However, two modalities that have not previously been intimately combined for multiparametric studies of preclinical models of cancer are ultrasonography (US) and MRI.
In this study, we present an approach that facilitates the coregistration of small animal US and MRI data of a subcutaneous, preclinical tumor model; to the best of our knowledge, this is the first such study. Although there have been excellent contributions on the registration of human US and MRI data,13,14 there is a paucity of data in the small animal setting, which has its own set of obstacles. Additionally, we provide a relevant example of an application with this technique by examining the relationship between the molecular information derived using a VEGFR2-targeted ultrasound contrast agent (UCA) and physiologic information about tumor perfusion and vascular permeability using DCE-MRI. The results of this study suggest that the relationship between physiologic and molecular biomarkers of angiogenesis is indeed more complex than our initial hypothesis of direct spatial correlation.
Materials and Methods
Tumor Model
Murine 67NR breast cancer cells have been shown to express increased levels of VEGFR2 as measured by targeted CEUS.5,15 These cells were cultured in Dulbecco's Modified Eagle's Medium supplemented with 10% fetal bovine serum and 0.2% gentamicin. Cells were incubated at 37°C in a mixture of 5% carbon dioxide and 95% air. Cells growing at 80% confluence were harvested, and a single-cell suspension containing 5 × 10⁶ cells suspended in 100 μL of medium was injected subcutaneously near the flank. Tumors were allowed to grow for 6 to 9 days before imaging.
Animal Model
Nine adult female nu/nu mice (18–20 g, 8–10 weeks of age) were purchased from Charles River Laboratories (Wilmington, MA), housed in pathogen-free facilities with a 12-hour light/dark cycle (6 am-6 pm), and provided with rodent chow and tap water ad libitum. For targeted CEUS/DCE-MRI studies, a 26-gauge jugular catheter was surgically implanted to allow for delivery of US and MRI contrast agents. All animals were imaged at two time points; the second time point occurred 48 hours after the first imaging session. All animal procedures were approved by and adhered to our Institutional Animal Care and Use Committee guidelines.
UCA Preparation
MicroMarker Target-Ready (Visualsonics, Inc, Toronto, ON) contrast agent was prepared and used according to the manufacturer's guidelines. This agent consists of microbubbles (2–3 μm in diameter) with a lipid-based shell that has streptavidin incorporated to allow maximum binding of biotinylated target antibodies. Approximately 9.2 × 10⁸ dry microbubbles were reconstituted using 500 μL of sterile saline. Then 20 μg of biotinylated antimouse VEGFR2 antibodies (eBioscience Inc, San Diego, CA) was diluted to a total volume of 400 μL and added to the vial of reconstituted microbubbles, as per the manufacturer's instructions. The vial containing both the VEGFR2 antibodies and the microbubbles was gently agitated for 1 minute and allowed to bind for 15 minutes.
Data Acquisition
Magnetic Resonance Imaging
The mice were anesthetized using a 2%/98% isoflurane/oxygen mixture and placed in a custom-built mouse restraint to keep the animals stationary for transport between modalities. Body temperature was maintained via a flow of warm air through the magnet bore or warming plate on the US imaging stage. Temperature and respiratory rate were monitored throughout the entire experiment.
Figure 1 displays the imaging protocols used in the study. MRI was conducted with a Varian 4.7 T Inova scanner (Varian, Inc, Palo Alto, CA) equipped with a 38 mm quadrature coil. After the tumor region was localized via low-resolution spin echo sequences, three data sets were acquired: (1) high-resolution anatomic images covering the entire tumor for the purpose of coregistration with US; (2) a precontrast T1 map as required for quantitative DCE-MRI analysis; and (3) DCE-MRI data for the purpose of correlating with US characterization of VEGFR2 expression (see below). For the high-resolution data set on tumors smaller than approximately 100 mm3, a spin echo pulse sequence with a repetition time (TR) of 4,500 ms and an echo time (TE) of 30 ms was used to acquire 1282 T2-weighted axial images over a 35 mm2 field of view (FOV). The slice thickness was 0.25 mm, yielding a voxel size of 0.018 mm3. The number of excitations (NEX) was 8. For tumors larger than 100 mm3, the following parameters were used: TR/TE = 3000 ms/30 ms, slice thickness = 0.3 mm, and NEX = 6 to acquire 1282 T2-weighted axial images over a 352 mm FOV (voxel size ≈ 224 μm3).

Time line of the imaging protocols used in this study. A minimum of ≈1.5 hours are required for high-resolution anatomic and dynamic contrast-enhanced (DCE) magnetic resonance imaging (MRI) data acquisition. The VEGFR2-targeted ultrasound contrast agent (UCA) requires 4 minutes, per the manufacturer's guidelines, to bind in vivo. A destruction pulse is administered, destroying all UCA so that the unbound UCA that flows into the region (reference frames) can be subtracted from the frames containing both bound and unbound contrast agent (main frames), leaving only VEGFR2-bound UCA.
For both the T1 mapping and DCE-MRI acquisitions, the central 10 1.0 mm thick slices of the tumor were selected for imaging. Data for constructing a precontrast T1 map were obtained by employing a variable flip angle gradient echo sequence with flip angles of 8°, 16°, 24°, 32°, and 40°. Imaging parameters were TR/TE = 200 ms/2.83 ms and NEX = 4, FOV = 35 mm2, matrix = 1282. The DCE-MRI protocol employed a T1-weighted, gradient echo sequence to obtain 70 serial images for each set of 10 axial planes, translating to a temporal resolution of 25.6 seconds for each image set acquisition for 40 minutes. The parameters were: TR/TE/α = 100 ms/2.83 ms/25°, NEX = 2, with the same acquisition matrix and FOV as for the T1 map. A bolus of 0.2 mmol/kg gadopentetate dimeglumine (Magnevist, Wayne, NJ) was delivered over 20 seconds via a jugular catheter beginning after the acquisition of the fifth dynamic image.
Ultrasonography
After MRI, anesthesia was maintained as above, and the animal was transferred to a Visualsonics Vevo 770 high-frequency ultrasound imaging system (Visualsonics Inc, Toronto, ON) equipped with a 40 MHz center-frequency transducer with a mechanically scanned, single-element aperture. Coupling gel was applied to cover the entire region of interest, and two-dimensional B-mode scout images established the central slice of the tumor. The transducer was placed such that the 6 mm focal spot converged at the center of the tumor. After tumor localization, two data sets were acquired: (1) three-dimensional anatomic B-mode images covering the entire tumor for the purpose of coregistration with MRI and (2) images from the central slice of the tumor showing VEGFR2 distribution as estimated by targeted microbubbles. Anatomic B-mode images at 100% power (mechanical index [MI] of 0.50) were acquired using a 5122 acquisition matrix and a 10 to 15 mm2 FOV (depending on the size of the tumor). The transducer was automatically incremented by a three-dimensional motor with a 0.102 mm step size over the entire tumor volume, yielding an effective voxel size of 36 to 84 μm3.
The VEGFR2-targeted UCA protocol in this study was followed per the manufacturer's recommendation. A bolus of approximately 5.1 × 10⁷ targeted microbubbles in 50 μL of saline was injected via a jugular catheter, followed by a 10 μL saline flush. Images were acquired in contrast mode at 50% power (MI of 0.14). Following the protocol illustrated in Figure 1, imaging was halted for 4 minutes to allow optimal binding of the targeted UCA. Image acquisition resumed, acquiring 150 to 200 frames at a frame rate of 14 frames/second followed by a high-powered destruction sequence (20 cycles at a frequency of 10 MHz and an MI = 0.59). After this sequence, imaging parameters were returned to the previously set parameters and 200 reference images were acquired.
Data Analysis
Magnetic Resonance Imaging
High-resolution anatomic magnetic resonance data were exported to Matlab R2007a (The Mathworks, Natick, MA) for segmentation and registration. DCE-MRI data analysis was performed using routines written in IDL (Research Systems, Inc, Boulder, CO). The T10 maps (ie, a map of T1 values before contrast was administered) were obtained by fitting the variable flip angle spoiled gradient echo data to Equation 1:
where α is the flip angle, S0 is a constant that includes scanner gain and proton measurements, and TET2* is assumed. These T10 maps were used to estimate relaxation rate R1 (≡1/T1) time courses for each voxel in the tissue of interest (TOI). Maps of Ktrans (the blood perfusion-vessel permeability product) and ve (extravascular-extracellular volume fraction) were created using a reference region (RR) method outlined in detail in Yankeelov and colleagues.
16
Briefly, the RR calibrates signal intensity changes in the regions of interest (eg, a tumor) to that in a well-characterized RR (eg, muscle). The end result of the theory is a practical equation that does not require the measurement of an arterial input function (ie, the time rate of change of contrast agent in the blood pool). It is important to note that a significant advantage of RR modeling is that it does not require high temporal resolution data to quantitatively analyze the R1 time courses.
14
The theory (in the fast exchange limit
17
) is summarized by Equation 2:

Ultrasonography
High-resolution three-dimensional anatomic B-mode US image sets were exported to Matlab R2007a for segmentation and registration. For computational ease, US data sets were downsampled from an acquisition matrix of 5122 to 2562. Image processing for the VEGFR2 US data was performed using the Vevo 770 software. All image data, including reference and data frames, were log compressed, digitized to 12 bits, and then further compressed to 8 bits for screen display. Reference images were gathered immediately after the destruction sequence. Each predestruction frame was compared with each reference frame by an absolute sum-of-differences method to allow for the pairing of two images with the smallest total difference for subtraction:

where the reference image is a postdestruction frame and the data image is a predestruction frame. Once these images were paired, a subtracted image was generated, which presents an estimate of only the bound VEGFR2 microbubbles (predestruction frame containing both bound and unbound contrast agent; postdestruction frame containing unbound, freely circulating contrast agent) within the FOV. This processed image was then exported to Matlab R2007a for registration to the MRI data and subsequent correlation analysis.
Segmentation and Registration
Two investigators manually segmented tumor volumes from each MRI and US data set independently. Each corresponding segmented surface from MRI and US was manually aligned and then registered to one another using an iterative closest point (ICP) algorithm. 20 This algorithm registers two three-dimensional shapes by discretizing each surface into a set of points and rigidly aligning one to the other in an iterative fashion. At each iteration, a transformation is found by calculating closest point pairs between each shape and finding an optimal translation and rotation to minimize the root mean square (RMS) distance between all point pairs. This transform is applied to the one data set before the next iteration begins (104 maximum iterations were allowed). The registration is complete when the solution reaches convergence within a predefined threshold. Our application of the ICP algorithm followed the manual registration so that the surfaces were already well aligned, thus limiting the potential for inappropriate convergence of the algorithm. A custom animal holder was built so that the animal was not allowed to move between the US and MRI examinations. This limited the change in position and orientation of the tumor relative to the surrounding tissue and allowed us to use rigid alignment techniques to provide accurate coregistration between the two modalities. Also, it is well known that ICP approaches have limitations when registering objects with high degrees of symmetry. 20 We were concerned that the tumor surfaces acquired via US and MRI would not provide the required geometric anisotropy for accurate ICP refinement. However, in our experience, the tumor surfaces in each modality contained enough geometric features such that the ICP alignment did not converge to obviously incorrect solutions. Rather, the ICP approach correctly registers the manual registration in all cases studied. When coupled in this fashion, the manual coregistration and automatic refinement provided sufficiently accurate coregistrations for our voxel-by-voxel correlation analysis. As a measure of coregistration accuracy, RMS errors between the surfaces defined for each modality were recorded for each registration and compared between investigators. RMS errors were also compared between segmented data sets from each investigator to ensure minimum error contribution from segmentation.

Ultrasonography (US) and magnetic resonance imaging (MRI) coregistration steps. Tumor margins were manually segmented from MRIs and sonograms (A, D); contour lines (blue and green) and crosshairs (yellow) were drawn to demonstrate registration results (B, E); for clarity, segmented tumor volume from US (“jet” color scheme) was overlaid on MRI (C, F). Note the difference in field of view listed at the bottom of A and D.
Correlation Analysis
Anatomic B-mode US and two-dimensional multislice T2-weighted anatomic images were segmented and registered to US space using the ICP algorithm described above. Once the MRI to US transformation was found, it was applied to the maps of Ktrans and ve. Slices containing intensities from the VEGFR2-bound UCA, Ktrans, and ve were then analyzed using the Pearson correlation coefficient determined by the Matlab command “corrcoef” on a voxel-by-voxel basis within the tumor region.
Results
The coregistration steps employed for this study are displayed in Figure 2. The entire tumor volume was manually outlined from each MRI and sonogram slice (see Figure 2, A and D). Segmented US data were registered to MRI segmentation data (see Figure 2, B and E), and contour lines (blue and green) and crosshairs (yellow) were drawn to show the voxel-to-voxel registration. Figure 2F depicts one slice from the registered and segmented US data, where the signal intensity is represented with a different colormap so that overlaid MRIs and sonograms are easier to visualize. Additional registration results for two mice at each time point are shown in Figure 3.

Registration results for mice 4 and 7 at time points 1 (A, B; E, F) and 2 (C, D; G, H). Contour lines and crosshairs are drawn, as in Figure 2, to demonstrate registration results. Arrow = skin layer; M = surrounding muscle; T = center of the tumor.
Root Mean Square Registration Error Recorded for Each Investigator at Each Time Point

RMS = root mean square.
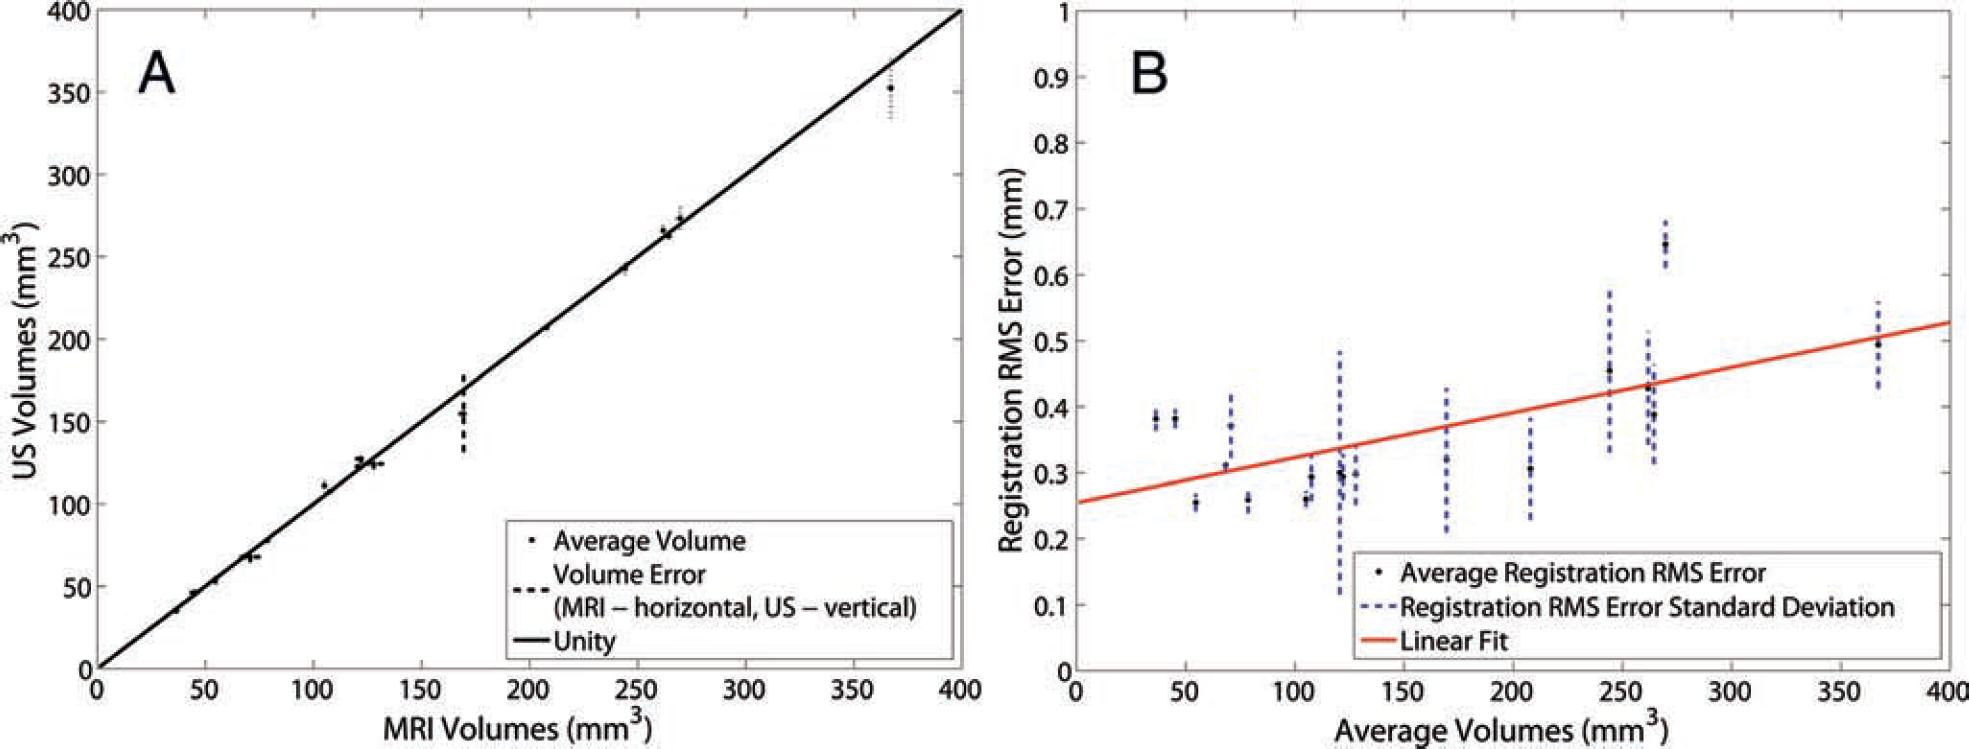
Results from ultrasonography (US)-magnetic resonance imaging (MRI) registration. A, To reduce interobserver variation, boundaries were assessed and volumes for each image were set for each modality. The “·” shows the average volume calculated from both investigators and both modalities, whereas the dashed lines (horizontal is MRI, and vertical is US) show the error associated with the volume for the respective modality. The data points fit the line of unity with an r = .9997 (y = 0.9808x + 1.8441). B, Average registration root mean square (RMS) error (·) and the associated standard deviations (dashed lines) are plotted versus average volume. The linear fit (solid line) shows an upward trend with increasing volume (y = 0.0007x + 0.2546, r = .657).
A to D represent one mouse at both time points, whereas E to H display the registration of another subject at both time points.
RMS errors for this study are listed in Table 1. The average RMS error for all time points was 0.36 mm, with a standard deviation of 0.11 mm, which is approximately less than two voxels. Before segmentation, both investigators agreed on the location of general tumor characteristics, such as tumor tissue, subcutaneous fat, and hyperechogeneity of the skin, to more accurately define tumor boundaries. Each investigator then performed segmentation independently. The use of two independent users allowed for investigation of segmentation variability for each modality and the effect on registration error. Volumes were calculated for all segmentations. The average volume (·) was determined, and errors for each modality (where a vertical line indicates the error in US volume, and a horizontal line indicates the error for MRI volume) are shown in Figure 4A; the error was defined as the distribution of segmented tumor volumes from both investigators. The line of unity (solid line) demonstrates the accuracy of the segmentation volumes between investigators (y = 0.98 x + 1.84, r = ≈1.00, p < .05). The average RMS error for the segmentation comparison was 0.23 ± 0.09 mm. Values for each subject are listed in Table 2.
As the tumor increased in volume over time, a slight increase in RMS error was noted and is displayed in Figure 4B (y = 7.0 × 10⁻⁴x + 0.25, r = .66, p < .05). To understand this trend further, error in segmentation between investigators was examined across the increasing volumes shown in Figure 5A. Given that segmentation error also increased (y = 5.0 × 10⁻⁴x + 0.15, r = .68, p < .05), segmentation error was graphed as a function of modality, and from Figure 5B, larger and more variable error was found with the US segmentation.
Segmentation Comparison between Investigators at Each Time Point

MRI = magnetic resonance imaging; RMS = root mean square; US = ultrasonography.
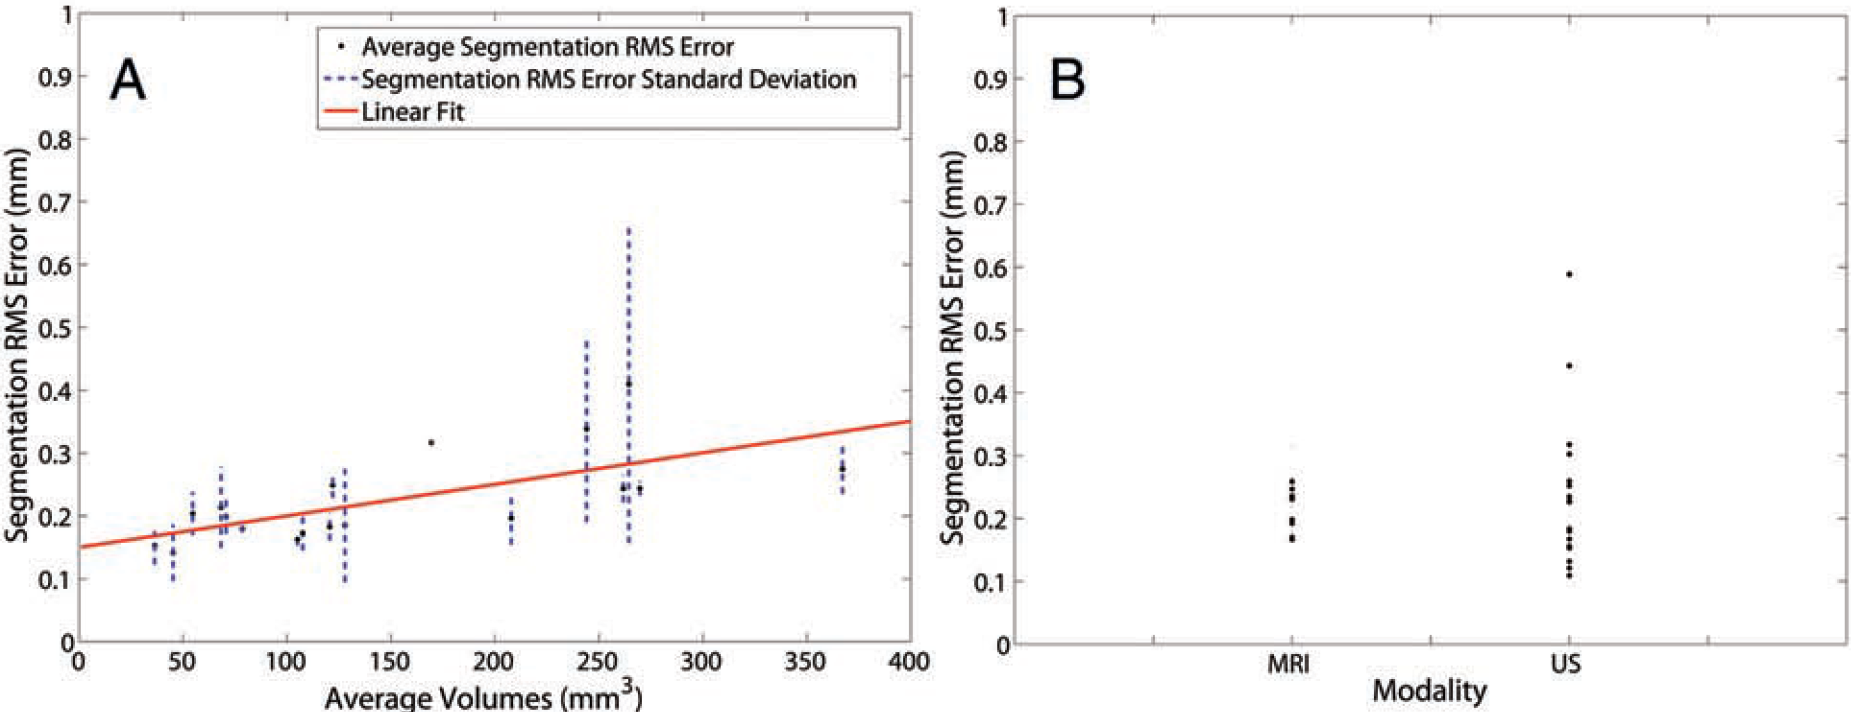
Results from ultrasonography (US)-magnetic resonance imaging (MRI) segmentation. A, Average segmentation root mean square (RMS) error (·) and the associated standard deviations (dashed lines) are plotted versus average volume. The linear fit (solid line) shows a similar increasing trend with increasing volume (y = 0.0005x + 0.1499, r = .680). B, RMS segmentation error is plotted for each modality, depicting a larger variability with segmentation in US than MRI.
Five of the mice examined in the registration study were used to perform preliminary investigations regarding the relationship between VEGFR2 as reported with targeted CEUS and perfusion measurements obtained from DCE-MRI. Pearson correlation coefficients were computed for each of the five mice at two different time points, with the exception of mouse 7, that, owing to problems with the jugular catheter, provided data only from the first time point. Additionally, an error occurred during injection for mouse 9 at time point 2, and no usable data were acquired. Figure 6 demonstrates the step-by-step method for registering the DCE-MRI maps to US space. After segmentation (A and D), MRI data were registered to US, shown in Figure 6, B and E. The transformation was then applied to the maps for each modality with the results shown in C and F. The voxel-by-voxel correlation analysis investigating the relationships between VEGFR2 and both Ktrans and ve within the tumor region yielded no significant spatial correlation. These preliminary results seem to indicate no direct spatial relationship between the distribution of VEGFR2 as estimated by CEUS and the pharmacokinetic parameters afforded by DCE-MRI (r = –.06, p < .05). Figure 7 confirms this visually by presenting two additional mice at two time points with corresponding VEGFR2 distribution maps (A, D, G, J), Ktrans (B, E, H, K), and ve (C, F, J, L) on the central slice of the tumor.
Although we did not expect to find a direct spatial correlation between VEGFR2 expression and ve, a direct correlation between measurements of VEGFR2 and the volume rate transfer constant Ktrans was anticipated. To investigate the nature of this relationship more fully, a temporal analysis was performed on the mice that had at least two time points. Histograms of identical regions of interest in the center and rim of the tumor were examined for each parametric map at each time point. Preliminary findings showed no distinguishable pattern in fluctuations of VEGFR2 and changes in perfusion (Ktrans); however, more subjects are needed to obtain a conclusive result. 21

Step-by-step demonstration of the registration between parametric maps produced by magnetic resonance imaging (MRI) and ultrasonography (US). A and D illustrate the segmentation of the tumor from both MRI and US, respectively. Once the image sets have been registered (B and E), transformations are applied to the maps of Ktrans and VEGFR2 from the respective modalities. The maps can then be compared on a voxel-by-voxel basis (C and F).
Discussion
During preclinical studies of anticancer drugs and/or treatment efficacies, multiple imaging modalities are often employed to report on the physiologic and/or molecular changes that occur.22,23 Tumors are well known to exhibit a variable phenotype, so obtaining multiple measurements from the same animal during a study is potentially advantageous to provide a more comprehensive understanding of tumor-host-drug interaction. In addition to combining various metrics on the same animal, multimodal coregistration permits corroboration of similar metrics obtained by different imaging techniques. The coregistration method presented in this study demonstrates, for the first time, the capability of combining small animal MRI and US data to examine the relationship of two potential biomarkers of angiogenesis in a preclinical cancer model.
Owing to the nonrigid, complex, and variable anatomy of tumors, the ICP algorithm was chosen over landmark-based registration techniques, which require external anatomic fiducials. It was also chosen over intensity-based techniques, such as mutual information, because there is insufficient information overlap between the sonograms and MRIs in many subcutaneous tumor models (unpublished results). Difficulties arise when registering data based on voxel information owing to differences in FOV and modality-specific image contrast and noise. 13 The custom animal holder allowed for the definition of a reliable initial position assignment required for convergence of the ICP algorithm to a true positive result. The ICP registration algorithm returns a transformation that minimizes the distance between corresponding points along the MRI and US surfaces. This distance is averaged and recorded as RMS error for each transformation. This metric provides a measure of how well the US reference shape fits the MRI target. Our registration errors are similar to those obtained in previous studies. For example, other groups have recorded average RMS errors of 7.6 mm (approximately five voxels) for clinical and 0.35 mm (approximately two voxels) for preclinical coregistration of CT and MRI.24,25 Barratt and colleagues reported average RMS errors of 3.3 mm (approximately four voxels on clinical equipment) when using an ICP algorithm for coregistration of US and CT of cadaver bones. 26
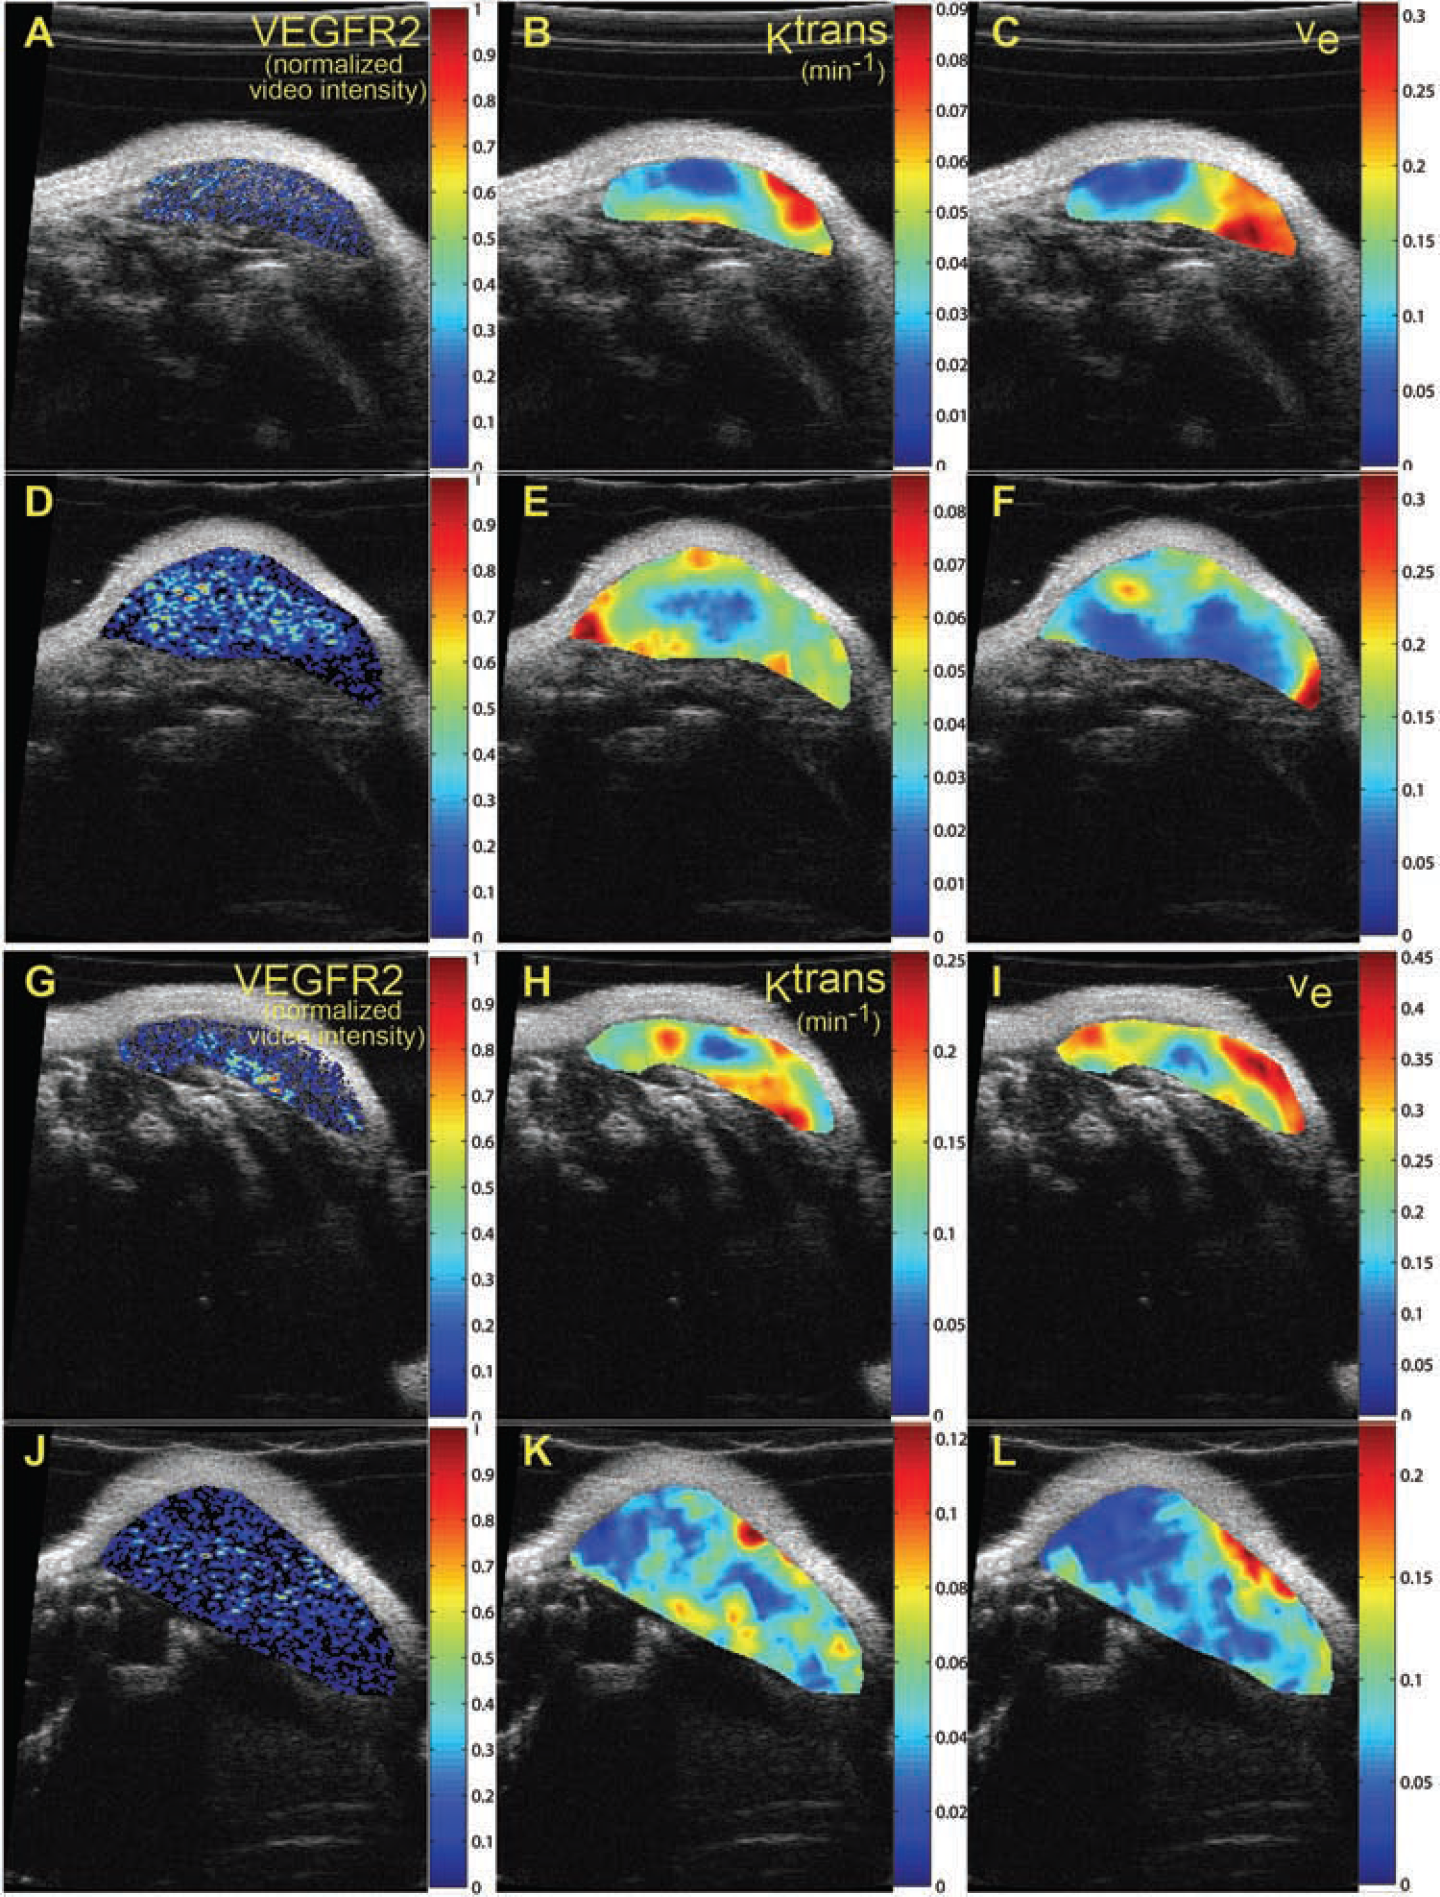
Parametric maps of VEGFR2 distribution, Ktrans, and ve for two mice at two time points. A and D and G and J show the VEGFR2 distributions for mouse 1 and mouse 4, respectively, at both time points, whereas B, E, H, and K demonstrate the Ktrans maps. ve maps are presented in C, F, I, and L. Although a spatial correlation between VEGFR2 and ve maps was not expected, correlation between VEGFR2 and Ktrans was anticipated; however, both visual and quantitative analyses show that there does not appear to be any significant correlation between these two metrics.
The ability to visualize tumor margins is an important factor for the accuracy of this registration technique. Therefore, ICP registration errors would increase if the surfaces of interest were no longer distinguishable from the background. Considering Table 2, the average segmentation error for MRI between time points is similar and has low variability. It is well known that MRI has excellent soft tissue contrast; therefore, tumor margins (for these subcutaneous tumors studies) were easily visible. It can also be deduced from Figure 5B that the difference in average segmentation error between time points is significant for US. It became increasingly difficult with increasing volume to determine tumor boundaries on the sonograms because a tradeoff exists between the depth of penetration and image resolution. For this study, a 40 MHz US transducer was used because high spatial resolution is desirable for accurate registration and investigation into murine models of cancer. However, as the volume increased, the majority of the tumor was no longer in the focal zone of the transducer, resulting in difficulties visualizing the lower tumor boundaries at time point 2. The use of a transducer with a lower frequency might improve the ability to visualize the lower boundary on larger tumors, but the decreased in-plane spatial resolution might make differentiating between the tumor and surrounding tissue more difficult. In addition to the difficulty with depth penetration, the skin exhibited hyperechogeneity, or increased signal intensity. Other tissues, including tumor and subcutaneous fat, also exhibited similar characteristics, which led to difficulty determining side, upper, and lower tumor boundaries. Investigators agreed on the differences between skin, fat, and tumor tissues; to compensate for ambiguity of tumor boundaries during independent segmentation, investigators attempted to use the whole three-dimensional tumor volume to interpret tumor boundaries, such as in Figure 1. Conversely, although MRI has excellent soft tissue contrast, it cannot acquire images at the same spatial resolution (in reasonable scan times) as US. Typical in-plane and through-plane resolutions for a quantitative image acquisition protocol such as DCE-MRI are approximately 200 and 500 μm, respectively (for an approximately 1 hour scan time); thus, tumors must be large enough for detection using MRI. Each modality has advantages and disadvantages that are important factors to consider when using this registration technique; a proper tumor volume range is essential such that RMS errors are minimized.
Preliminary data were collected during this study to show the possibility of combining metrics from both US and MRI. Based on the results of the VEGFR2 and DCE-MRI parameter comparison, the lack of direct spatial correlation suggests several possible avenues of investigation. The initial hypothesis investigated in this study suggested that VEGFR2 expression and the DCE-MRI parameter reporting on vascular perfusion and permeability (Ktrans) would positively correlate because both are biomarkers of angiogenic activity in cancer. Although only five mice were studied, no spatial correlation was found between these two parameters. In fact, the images shown in Figure 7 indicate (qualitatively) that areas of higher VEGFR2 expression might colocalize with regions of low perfusion and/or permeability. The consistently low correlation values found suggest that these parameters may have a more complex relationship; because these two biomarkers of angiogenesis measure different scales of activity, molecular and physiologic, a lack of direct spatial correlation might not be surprising. The true relationship between these measures may be better expressed as a spatiotemporal correlation.
Shalaby and colleagues showed the importance of VEGFR2 expression for vascular maturation by demonstrating that absence of VEGFR2 resulted in disturbed differentiation of endothelial cells, causing embryonic death in mice between days 8 and 9. 27 Other studies have probed the role of VEGFR2 in downstream effects of endothelial cell proliferation and migration toward hypoxic tissue.28,29 The binding of VEGF to VEGFR2 initiates a cascade of events that result in the development of mature vessels. Enzymes are released by endothelial cells that break down the surrounding extracellular matrix. Endothelial cells then migrate and proliferate as a chemotactic response to concentrations of VEGF; finally, they reorganize into tubes to form new mature vessels. Thus, the upregulation of VEGFR2 appears to happen as a precursor to vessel formation, establishing a potential time lag between the molecular VEGFR2 metric and measurements of perfusion. This potential time lag has yet to be well defined. As discussed in work reported by Li and colleagues in a skin window model, vessels dilate and alter their shape in response to proliferating tumor cells in as early as 1 to 2 days. 30 Neovasculature can be seen in as little as 8 days post-tumor implantation. Thus, although the time line of VEGFR2 expression and the resulting formation of perfused vessels are not definitive, the technique presented in this work offers a mechanism for noninvasively investigating this important relationship.
This effort has shown that US and MRI can be coregistered accurately in preclinical subcutaneous tumor models, and preliminary findings to a potential application of this technique have been presented. This US-MRI registration technique offers a way to noninvasively image two different angiogenic biomarkers in the same animal, providing a mechanism for further investigating this complex relationship that might not otherwise be easily characterized with in vivo preclinical models. In addition, the approach described here can return multiple biomarkers for individual animals to better characterize the efficacy of various anticancer treatments. Finally, given that MRI is readily coregistered to other common tomographic techniques, 31 the registration between US and MRI could be further extended to allow cross-validation of probes in other molecular imaging modalities, such as PET and single-photon emission CT, that are coupled with CT. By this merit, this method has the potential to become a valuable tool for multimodal studies of small animal cancer models.
Footnotes
Acknowledgments
We would like to thank the Mouse Metabolic Phenotyping Core at Vanderbilt University, Mr. Jarrod True, and Zoe Yu, MD, for assistance with animal care. We also thank Jeffrey Luci, PhD, and Richard Dortch, PhD, for expert technical MRI assistance.
Financial disclosure of authors: We thank the National Institutes of Health for financial support through U24 CA 126588, SAIRP CA126588, 1K25 EB005936-01, NCI P30 CA068485, and T32 EB003817 and an American Institute of Ultrasound in Medicine Endowment for Education and Research Grant.
Financial disclosure of reviewers: None reported.