
Abstract
Magnetic resonance imaging (MRI) of magnetically labeled stem cells has become a valuable tool in the understanding and evaluation of experimental stem cell–based therapies of degenerative central nervous system disorders. This comprehensive study assesses the impact of magnetic labeling of both human and rodent stem cell–containing populations on multiple biologic parameters as maintenance of stemness and oxidative stress levels. Cells were efficiently magnetically labeled with very small superparamagnetic iron oxide particles. Only under the condition of tailored labeling strategies can the impact of magnetic labeling on vitality, proliferation, pluripotency, and oxidative stress levels be minimized. In a rat model of Parkinson disease, magnetically labeled mouse embryonic stem cells were tracked by high-field MRI for 6 months. Significant interindividual differences concerning the spatial distribution of cells became evident. Histologically, transplanted green fluorescent protein–positive iron oxide–labeled cells were clearly identified. No significant increase in oxidative stress levels at the implantation site and no secondary uptake of magnetic label by host phagocytotic cells were observed. Our study strongly suggests that molecular MRI approaches must be carefully tailored to the respective cell population to exert minimal physiologic impact, ensuring the feasibility of this imaging approach for clinical applications.
There has been tremendous progress in understanding the biology of cell and tissue regeneration in the central nervous system. This is most evident in the field of stem cell research, where new insights have raised hopes for novel therapies of neurologic disorders such as Parkinson disease (PD) 1 3 and cerebral ischemia.4, 5 However, clinical applications will require long-term monitoring of transplanted cells in vivo with high sensitivity and specificity as even small variations of cell number can result in serious complications from the over- or underactivity of the graft.6, 7 This demand is paralleled by dramatic technological advances in the areas of cellular and molecular imaging. With the high spatial resolution achieved today, monitoring of cell-based therapies becomes amenable to investigation by magnetic resonance imaging (MRI). MRI has a high spatial resolution in both humans and small animals but requires efficient magnetic labeling of the transplanted cells to be visualized. The most successful strategy devised so far to achieve an adequate cellular contrast in MRI is to label cells with iron oxide nanoparticles, thereby shortening the transverse relaxation time of surrounding water protons and thus leading to hypointensities on T2*-weighted images. 8 10 Magnetically labeled stem cells have been visualized by MRI both in vitro 11 and in vivo. 12 14 However, the question of whether distinct stem cell populations differ concerning their uptake of the magnetic label has not been comparatively addressed up to now. 15 In addition to embryonic stem cells (ESCs), whose importance in regenerative medicine is unparalleled, we chose to investigate human umbilical cord blood mononuclear cell (hUCBC) fractions and murine bone marrow mononuclear cells (mBMCs) as these populations contain stem and precursor cells that are multipotent and can differentiate into a broad variety of cell types, including neurons and glia,16, 17 and are potential autologous cell sources for PD treatment. 18
In our view, cellular viability as the only measure of the impact of magnetic labeling on the complex physiology of stem cells does not suffice, in particular regarding the clinical perspective of this method. Iron or iron oxide interacts with a number of metabolic pathways. 19 Increased intracellular iron content may induce oxidative stress through an increased oxidative load, leading to higher levels of apoptosis. Furthermore, oxidative stress has been implicated in the pathogenesis of neurodegenerative disorders such as PD.20, 21 Injection of iron oxide–labeled cells, for example, into the brain, might affect both the labeled cells themselves and the cells of the target tissue in case of lysis. 22
In addition, our study investigated whether differences between stem cell populations regarding uptake of the magnetic marker result in distinctive MRI detectability. To investigate the cell-specific MRI detection limit in vivo, cells were injected into the rat striatum and imaged at 7 T, thereby providing insights into the comparability of imaging studies using different cell populations.
To address the demand for specific long-term monitoring, we transplanted 6-hydroxidopamine (6-OHDA)-lesioned rats with magnetically labeled ESCs and imaged the animals over 6 months using high-resolution MRI. The MRI signal changes were correlated with extensive histology.
The multimodal approach presented here is intended to provide a comprehensive view on the limitations and possibilities of cellular MRI, taking into account the effects of cell type, biologic impact of magnetic labeling, and imaging parameters as well.
Materials and Methods
Culture of ESCs
Mouse embryonic stem cell (mESCs) (CRL-1934, American Type Culture Collection [ATCC], Manassas, VA) were grown in Dulbecco's Modified Eagle's Medium (DMEM) (ATCC) containing 30% medium conditioned by feeder cells (CRL-1503, ATCC), 15% fetal calf serum (FCS; PAA, Pasching, Austria), 15 ng/mL leukemia inhibitory factor, 0.1 mM 2-mercaptoethanol, and 1% penicillin-streptomycin (all Sigma-Aldrich, Munich, Germany). Cells were cultured in 75 cm2 cell culture flasks (Nunc, Wiesbaden, Germany) in 20 mL medium at 37°C and 5% CO2 and passaged every 3 days. Only undifferentiated cells in suspension were used for the experiments. Prior to transplantation, cells were stably transfected with enhanced green fluorescent protein (GFP).
hUCBC and mBMC Preparation and Sample Analysis
hUCBCs were obtained from human cord blood samples that were donated in accordance with ethical guidelines immediately after delivery of full-term neonates. mBMCs were collected from the femur and tibia bones of five male CD-1 mice. Immediately after sacrificing, bones were removed and cut at both ends. Bone marrow was then flushed out and collected in 15 mL of RPMI 1640 medium (PAA). The mononuclear cell fractions of human cord blood and murine bone marrow were separated using Ficoll-Paque PLUS (Amersham Biosciences, Uppsala, Sweden) density gradient centrifugation according to the manufacturer's protocol.
Prior to transplantation, cryopreserved hUCBC and mBMC samples were thawed and transferred into 10 mL RPMI 1640 medium supplemented with 10% FCS, 1 mL DNAse I (75 U/mL), and 300 μL 0.5 M MgCl2 (Sigma-Aldrich). After washing, cells were resuspended in phosphate-buffered saline. Cell viability was assessed by dye exclusion (0.4% trypan blue, Sigma-Aldrich) in all cell populations. Only samples with viability above 95% were used in this study. Representative hUCBC and mBMC samples were analyzed after thawing using a FACSCalibur Scanner (Becton-Dickinson, Franklin Lakes, NJ) in at least three independent experiments. hUCBCs were incubated with the following antibodies: mouse antihuman CD3, CD14, CD19, CD34, and CD56 (all Beckman Coulter, Krefeld, Germany) and mouse antihuman CD133/2 (Miltenyi Biotech, Bergisch Gladbach, Germany). mBMCs were analyzed using the IT-Box-233 antibody kit (Immunotools, Friesoythe, Germany) against murine antigens CD3e, CD11b, CD19, CD34, CD117, and Gr-1. All antibodies were applied for 20 minutes at 4°C.
Magnetic Labeling of Cells with and without Lipofection
Very small superparamagnetic iron oxide particles (VSOPs) (C200, Ferropharm, Teltow, Germany) consisting of a 5 nm iron oxide core coated by monomer citrate were used for cell labeling, yielding a diameter of 9 nm. For magnetic labeling, various quantities of sterile VSOP solution (0.5 M, referring to Fe2+/Fe3+ content) were added to the cells, yielding concentrations of 1.5 to 12 mM Fe2+/Fe3+ in the incubation media as described previously. 12 Cells were incubated for 1.5, 4, and 24 hours with and without additional lipofection. Cellular viability was determined before and after magnetic labeling as described above. We further used FuGENE6 (Roche, Mannheim, Germany) as a transfection agent according to the supplier's recommendations. Briefly, the VSOPs were coincubated in a concentration of 1.5 mM with the FuGENE6 liposomes in DMEM for 30 minutes before adding the VSOP-FuGENE6 complex to the cells. Relaxometry and atomic absorption spectroscopy were performed as described previously. 12
For transplantation of labeled cells, the distinctive labeling efficacies and the impact of labeling on the cellular viability of the cell populations investigated (as stated below) were taken into account. Hence, mESCs were incubated with 1.5 mM VSOP, mBMCs, and hUCBCs with 6 mM VSOP for 1.5 hours without the use of additional lipofection agents.
Flow Cytometric Assessment of Apoptotic and Necrotic Cells and Measurements of Oxidative Stress Levels
Apoptosis and necrosis rates were quantified using the FACSCalibur Scanner in at least three independent experiments. The rate of apoptosis was determined using annexin V conjugated with fluorescein isothiocyanate. Necrotic cells were identified using propidium iodide. Protein carbonyls were measured according to Buss and colleagues. 23 The concentration of malonyldialdehyde (MDA) as a measure of lipid peroxidation was determined as already described. 22
6-OHDA Lesion, Amphetamine-Induced Rotation
All experimental procedures on animals were approved by the Experimental Animal Committee of the Government of Berlin. Wistar rats (Charles River Laboratories, Sulzfeld, Germany) weighing 190 to 210 g were used in the experiments.
For 6-OHDA lesioning, rats were anesthetized intraperitoneally with pentobarbital (32 mg/kg) and placed in a stereotactic frame (Kopf Instruments, Tujunga, CA). Thirteen animals were lesioned by unilateral injection of 2 μL 6-OHDA (3.5 μg/μL) into the middle forebrain bundle.
Four weeks after lesioning, animals were tested for amphetamine-induced rotation as previously described. 24 In summary, animals were injected intraperitoneally with 2.0 mg/kg amphetamine, rotations were assessed for 60 minutes, and full 360° turns in the direction ipsilateral to the lesion were counted. Animals were divided into two groups (n = 6) in such a way that the sum of the rotation scores of animals of each group was matched. Ten weeks after transplantation of mESCs (see below), animals were retested.
Cell Transplantation
For cell transplantation, rats were anesthetized using 100 mg/kg ketamine chloride (Merial Ltd., Hallbergmoos, Germany), 10 mg/kg xylazine (Bayer Inc., Leverkusen, Germany) and 0.1 mg/kg atropine (Ratiopharm Inc., Ulm, Germany), all delivered intraperitoneally. All rats received stereotactic injections into the striatum at the following coordinates, anterior-posterior, –0.5 mm; medial-lateral, ± 3 mm; and dorsoventral, –5 mm (all in relation to bregma) using a 10 μL Hamilton syringe mounted at the stereotactic frame. The needle was inserted and withdrawn over 5 minutes; injection was performed at a constant rate over 10 minutes.
For detection of magnetically labeled mononuclear cells, five animals were injected in both striata: 10,000 hUCBCs/10,000 mBMCs; 1,000 hUCBCs/1,000 mBMCs; 500 mBMCs/NaCl; 100 mBMCs/100 hUCBCs; and NaCl/NaCl.
For the PD MRI study, 12 6-OHDA-lesioned rats were divided into two groups: 6 animals were injected with 1 × 10⁵ mESCs, and six animals received an injection of NaCl. One additional 6-OHDA-lesioned animal was injected with 1 × 10⁴ magnetically labeled mESCs.
MRI at 7 T
For 7 T MRI measurements (Pharmascan, Bruker Biospin, Ettlingen, Germany), rats were anesthetized with 1% isofluorane delivered via 100% O2 using a facemask and placed in the center of a 68 mm designated rat head radiofrequency coil on a heated circulating water blanket. Breathing was monitored using the Bio Trig system (Bruker). T2*-weighted images were obtained using a two-dimensional gradient-echo sequence (relaxation time/echo time = 400.4/5.4 ms), yielding an inplane resolution of 117 μm with a slice thickness of 400 μm. Twenty axial slices were positioned with the center slice covering the injection tract. All 13 rats of the PD study underwent MRI at 2 days and 4, 8, 16, and 24 weeks after transplantation. Rats injected with hUCBCs and mBMCs were scanned once directly after transplantation.
Histology
For detection of intracellular iron in vitro, cells were fixed with 4% paraformaldehyde at 1 and 14 days after incubation with VSOPs. Cells were stained with nuclear fast red for visualization of cell nuclei and Prussian blue for intracellular iron. For the detection of stage-specific embryonic antigen 1 (SSEA-1) expression, cells were incubated with primary anti-SSEA-1 antibody (1:300) (Millipore, Schwalbach, Germany) overnight. After washing, the cells were incubated with secondary antibody (rabbit antimouse, 1:200, phycoerythrin labeled) for 2 hours at room temperature. Cells were subsequently analyzed by flow cytometry.
For in situ histologic analysis, animals were sacrificed after the final MRI experiment, and frozen sections of 20 μm thickness were prepared using a Jung cryostat (Leica, Bensheim, Germany). Sections were stained with hematoxylin and eosin and Prussian blue for iron. For detection of transplanted mESCs, their endogenous GFP fluorescence was recorded using confocal laser scanning microscopy (CLSM, Leica). For detection of macrophages, brain slices were incubated with monoclonal anti-CD11b primary antibody (Millipore, 1:200, from rat) at 4°C overnight, followed by secondary antibody (goat antirat, Cy-5 labeled) for 1 hour at room temperature.
Detection and quantification of protein carbonyls were realized by using a modified protocol according to Smith and colleagues and Jung and colleagues.25, 26 Protein carbonyls are a common structure induced by oxidative protein modification and commonly used for the quantification of oxidative stress.25,2729
Statistics
Statistical analysis was performed using the SPSS software package (SPSS Inc, Chicago, IL). Atomic absorption spectroscopy (AAS) and relaxometry data were analyzed using the t-test for the comparison of two independent samples after the Kolmogorov-Smirnov test confirmed normal distribution of the data. A p value < .01 was considered statistically significant. All data are presented as mean values ± standard error of the mean.
Results
hUCBC and mBMC Sample Analysis
The analysis of adult stem cell–containing population is provided in Table 1. Flow cytometric analysis yielded a higher concentration of stem/early progenitor cells in mBMCs (3.97 ± 0.23% CD117+/CD34– cells) compared with hUCBCs (0.44 ± 0.17% CD133+/CD34–). In contrast, the number of cells positive for both antigens (CD133+/CD117+ and CD34+) was 1.22 ± 1.02% in hUCBCs but only 0.52 ± 0.18% in mBMCs. Further, the vast majority of lymphocytes analyzed in the hUCBC samples were CD3-positive T lymphocytes (73.04 ± 10.24%), whereas in the bone marrow samples, the majority of cells were B lymphocytes (92.79 ± 0.43%).
FACS Flow Cytometry—Based Analysis of Human Umbilical Cord Blood Mononuclear and Mononuclear Bone Marrow Cells
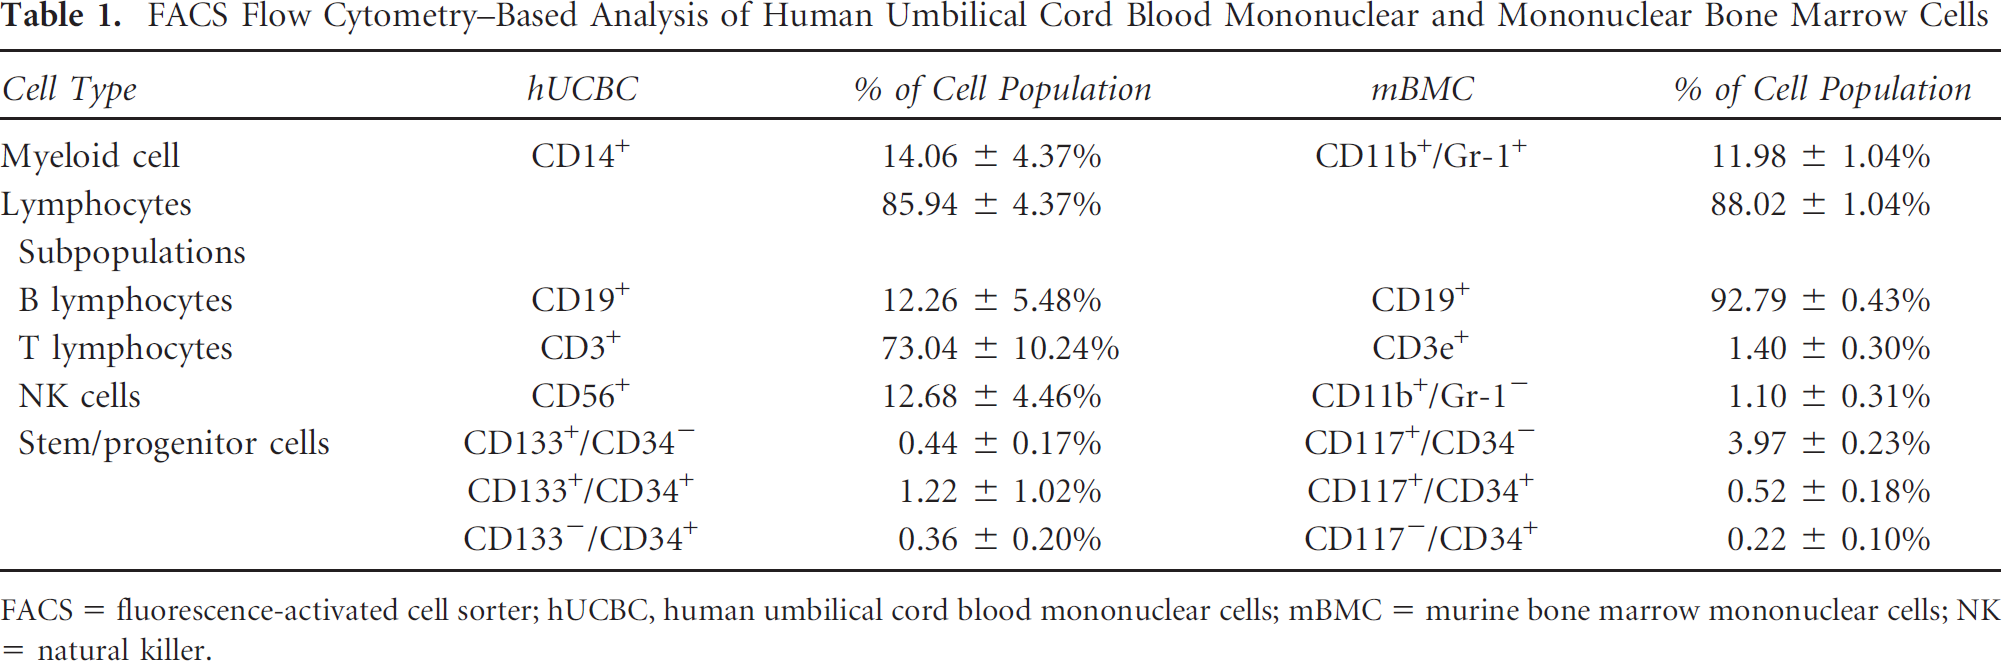
FACS = fluorescence-activated cell sorter; hUCBC, human umbilical cord blood mononuclear cells; mBMC = murine bone marrow mononuclear cells; NK = natural killer.
Cell Type–Dependent Uptake of Iron Oxide Particles
Cellular uptake of iron oxide particles was measured by both AAS and relaxometry. AAS enables the direct measurement of cellular iron oxide concentration, whereas relaxometry takes advantage of the shortening effect of iron oxide on transverse relaxation time. Measuring relaxation times in vitro can predict MRI contrast change after cell transplantation. No transfection agents were added during incubation with iron oxide particles. ESCs exhibited a significantly shorter transverse relaxation time (T2 time) after incubation with VSOP for 90 minutes (Figure 1A), black bars). The mean relaxation time of the cell suspension was reduced to 34% (1.5 mM VSOPs) and 25% (3 mM VSOPs) compared with nonlabeled ESCs, serving as controls. Labeling of hUCBCs and mBMCs resulted in a significant reduction of T2 time only after incubation with high concentrations of 6 and 12 mM VSOPs. T2 reduction never reached ESC levels, even at 12 mM VSOPs. Saturation occurred when the incubation concentration of VSOP was increased from 6 to 12 mM, not being associated with a further significant reduction in T2 time.
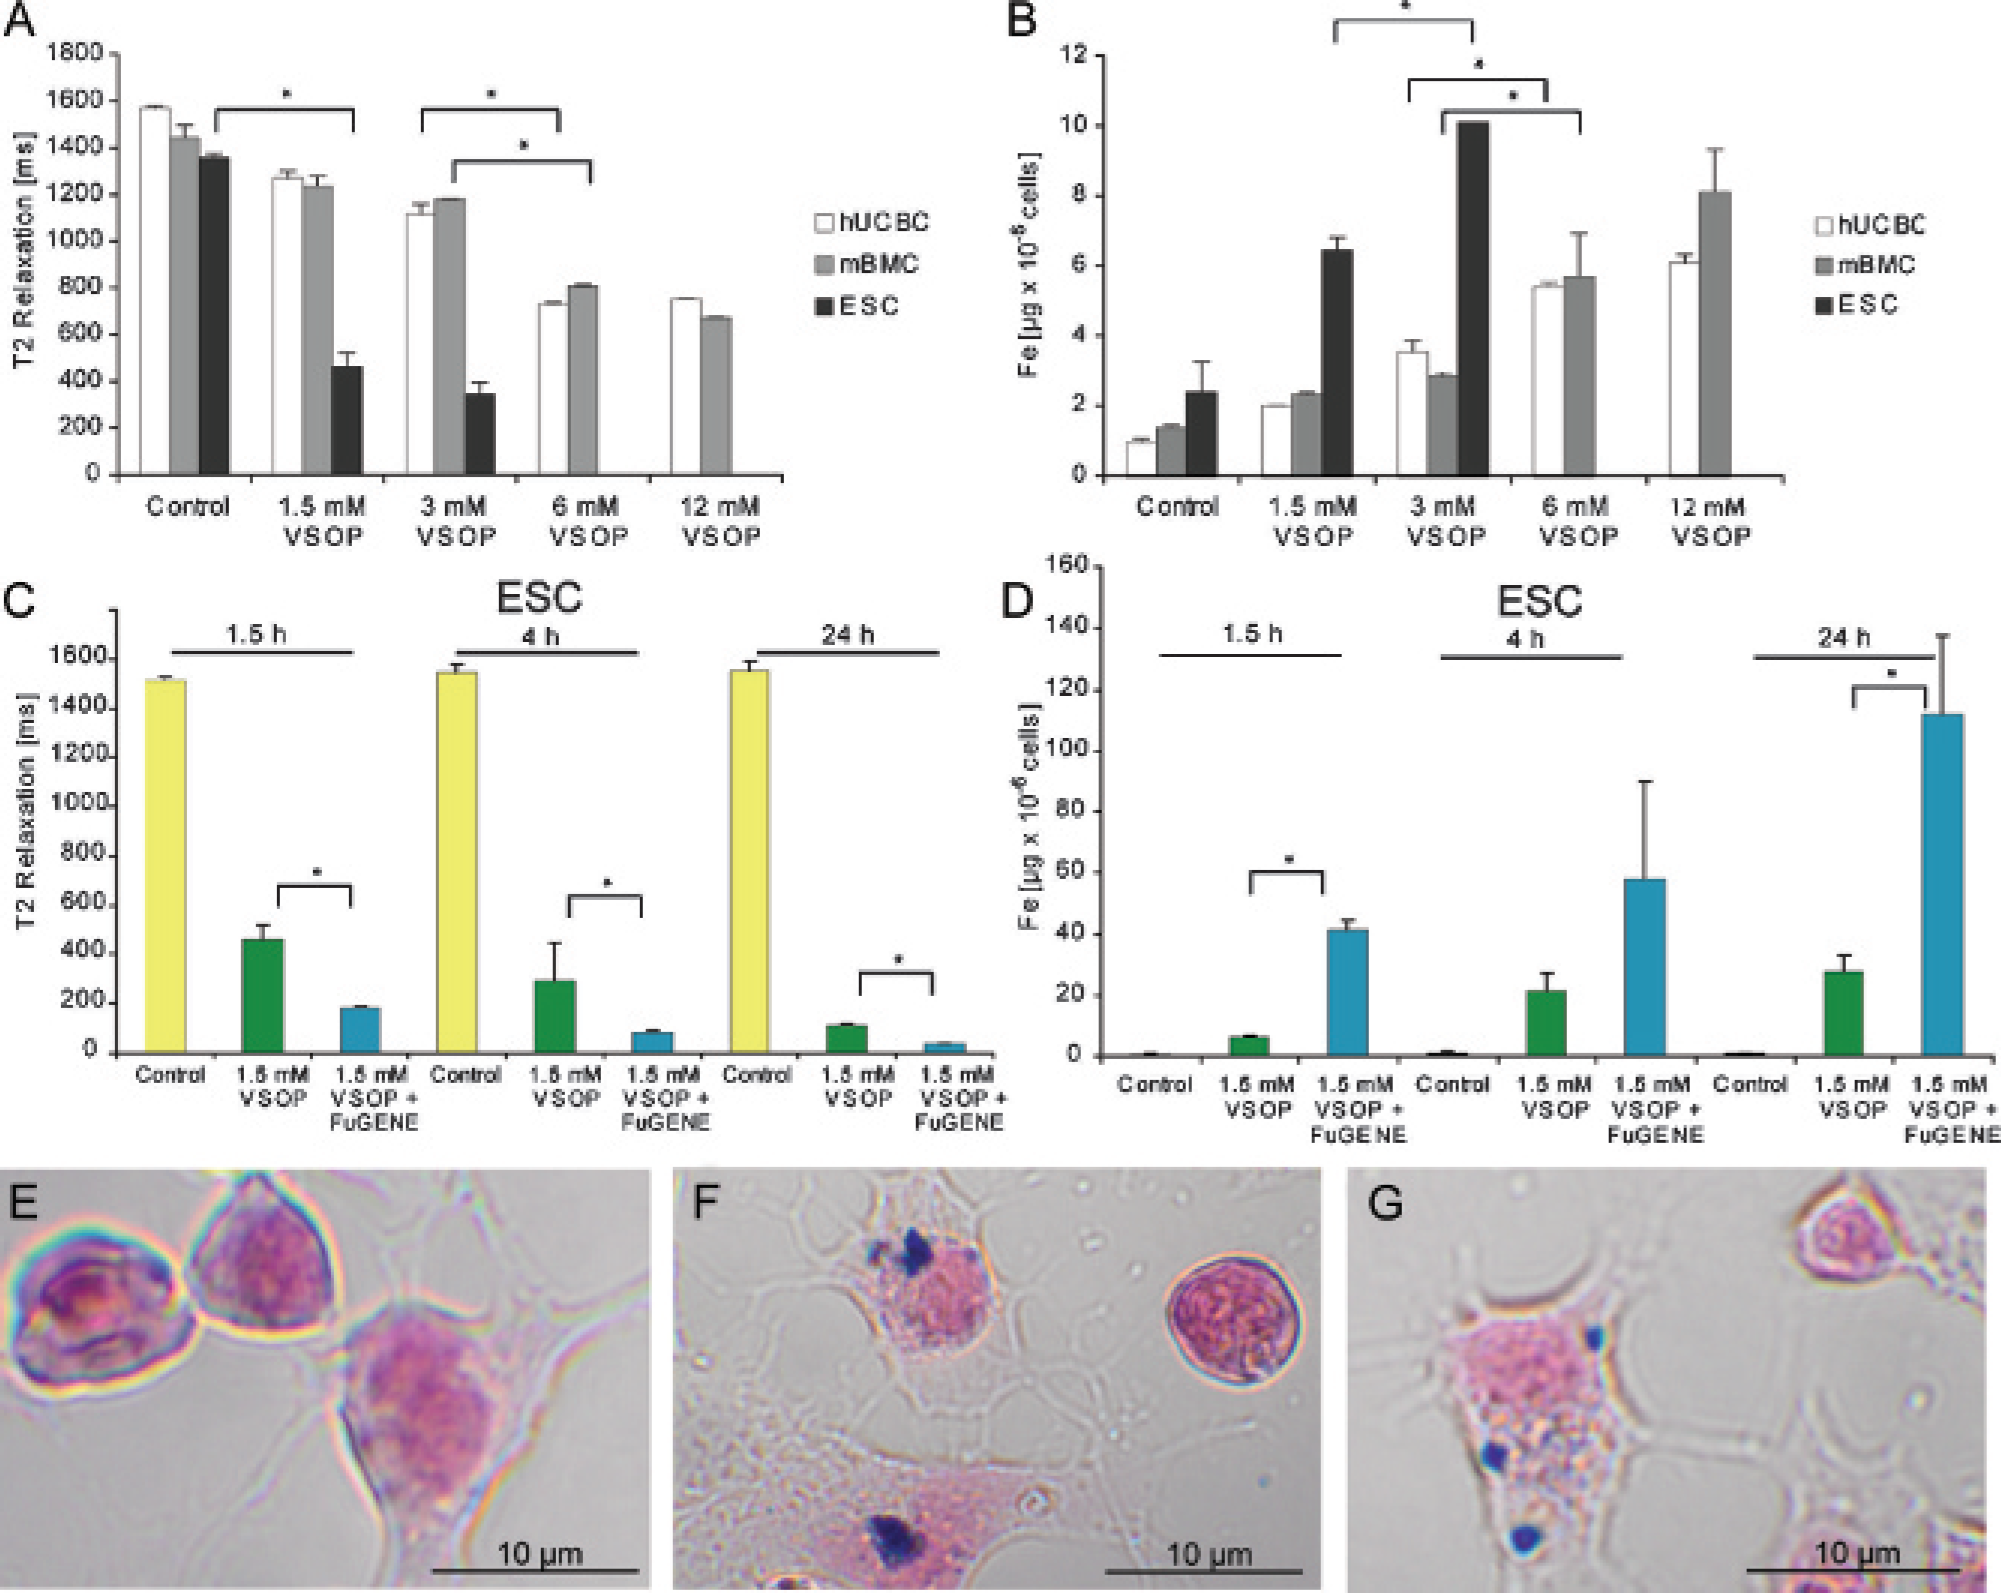
Uptake of magnetic label (very small superparamagnetic iron oxide particles [VSOPs]) by stem cells. VSOP incubation leads to a reduction in T2 time (A) and an increase in intracellular iron (B). Both the use of lipofection agents and longer incubation times increase iron oxide uptake by mouse embryonic stem cells (ESCs) (C and D). Micrographs reveal the cellular iron oxide uptake pattern 14 days after simple incubation of ESCs with 1.5 (F) and 3 mM (G) VSOPs compared with controls (E). hUCBC = human umbilical cord blood mononuclear cell; mBMC = murine bone marrow mononuclear cells.
Measurement of intracellular iron concentration by AAS demonstrated significant, concentration-dependent incorporation by mESCs. mBMCs and hUCBCs exhibited a smaller but still significant iron uptake (Figure 1B). Next, we tested for proportionality between T2 relaxation time and intracellular iron concentration as measured by AAS. We conducted a regression analysis (SPSS) and both linear and exponential fittings of relaxometric and AAS data. All three cell populations investigated revealed a correlation coefficient of nearly –1 (data not shown). This inverse proportionality was not significantly dependent on the cell type investigated.
Impact of Lipofection and Incubation Time and Intracellular Location of VSOPs
We next tested whether the intracellular iron oxide concentration could be further increased by both extending the incubation time and using lipofection agents. An incubation concentration of 1.5 mM VSOPs was chosen as this concentration ensured significant uptake by mESCs even at the 90-minute incubation time without reaching saturation. Increasing the incubation time led to a significant reduction in the T2 relaxation time of mESCs (Figure 1C), which was paralleled by a significant increase in the amount of incorporated iron (Figure 1D). Additional incubation with lipofection agents resulted in a further increase in cellular iron content. Incubation of mESCs with 1.5 mM VSOPs for 24 hours with the additional use of lipofection resulted in a cellular iron content of up to 111.7 μg Fe/106 cells. Histologically, we observed a clear intracellular location of VSOPs even 14 days after incubation of ESCs (Figure 1, E and F). Directly after incubation, we observed incubation efficiency of over 95%, and after 14 days, about 70% of the cells still displayed Prussian blue positivity. The iron oxide was compartmentalized within the cytosol; no Prussian blue signal was observed adjacent to the outer membrane or in the nucleus. Increasing the incubation concentration from 1.5 to 3 mM VSOPs did not lead to a significant increase in Prussian blue staining (Figure 1 F and G), as reflected in the relaxometry and AAS data (see Figure 1, A and B).
Impact of Magnetic Labeling on Cellular Physiology
Immediately after labeling, viability assays did not reveal a decrease in viability rates in both mononuclear cell fractions (hUCBCs and mBMCs) after incubation with the VSOP concentrations investigated (1.5–12 mM). mESCs exhibited a slight decrease in viability from 93% (controls) to 90% (1.5 mM VSOPs) and 87% (3 mM VSOPs) (data not shown).
However, these differences were only partly reflected in apoptosis and necrosis rates (Figure 2, A and B). mESCs exhibited significantly higher rates of apoptosis and necrosis in contrast to the mononuclear cells at concentrations up to 3 mM. A further increase in VSOP concentration led to a sharp increase in both apoptosis and necrosis rates in mononuclear cells, up to a level of 8%. At higher concentrations, hUCBCs were more resistant toward VSOP labeling compared with mBMCs.

Impact of iron oxide label on stem cell physiology. Apoptotic (A) and necrotic (B) cells quantified using flow cytometry. (C) Exponential proliferation curves of embryonic stem cells after iron oxide uptake. D, Maintenance of pluripotency is indicated by stage-specific embryonic antigen 1 immunofluorescence. Concentrations of malonyldialdehyde (E) and protein carbonyls (F) as measures of oxidative stress levels. ESC = embryonic stem cell; hUCBC = human umbilical cord blood mononuclear cell; mBMC = murine bone marrow mononuclear cells; VSOP = very small superparamagnetic iron oxide particle.
Next, we tested for proliferation and maintenance of stemness in mESCs. Both tests were not possible with mononuclear cell fractions. VSOP labeling did not affect proliferation of nondifferentiated mESCs in the first 3 days after labeling (Figure 2C). The SSEA-1 expression level indicative of pluripotency was retained at a high level of 95% over the 3 days; no significant effect of VSOP labeling could be observed (Figure 2D).
Measuring both MDA as a marker for lipid peroxidation and protein carbonyls as a marker for protein oxidation, we observed a significant increase in MDA and protein carbonyl levels in mESCs incubated with 3 mM VSOPs compared with controls (Figure 2, E and F). Incubation with 1.5 mM VSOPs showed a nonsignificant tendency toward higher MDA levels; however, no effect on protein carbonyls could be detected. Notably, when measured 24 hours after incubation, both the MDA and protein carbonyl levels of cells incubated with 3 mM VSOPs returned to control levels.
In Vivo Detection Limits of Mononuclear Cells at High-Field MRI
Transplantation of 10,000 hUCBCs and mBMCs could be clearly identified as a hypointense signal change in T2*-weighted images (Figure 3A). Transplantation of 1,000 cells resulted in smaller but clearly visible hypointensities (data not shown). The detection limit was reached with 500 labeled cells, whereas transplantation of 10,000 nonlabeled cells in the contralateral striatum did not result in detectable signal changes (Figure 3B). Very small signal changes after transplantation of 100 magnetically labeled cells could not be clearly assigned to labeled cells (data not shown).

Detection limit and long-term tracking of magnetically labeled cells in vivo at 7 T. A, Transplantation of 10,000 murine bone marrow mononuclear cells (mBMCs) into the left striatum (dotted arrow) and 10,000 human umbilical cord blood mononuclear cells (hUCBCs) into the right rat striatum (solid arrow). B, Transplantation of 500 mBMCs (arrow). C, Signal extinction after transplantation of 10,000 labeled mouse embryonic stem cells (ESCs) (arrow). D to I, Transplantation of 100,000 labeled ESCs into a 6-OHDA-lesioned rat. D to F, Time course of signal distribution: (D) 2 days; (E) 8 weeks; (F) 16 weeks after transplantation. G to I, Corresponding threshold-based three-dimensional volume renderings.
Magnetic Resonance Tracking of Labeled mESCs in a PD Rat Model
First, we imaged animals injected with NaCl 2 days after injection and 6 weeks after the 6-OHDA lesion. No significant signal alterations in T2*-weighted images could be observed, besides a slight demarcation of the needle tract (data not shown). In contrast, injection of 10,000 magnetically labeled mESCs led to significant hypointense signal changes, most prominent in the lower third of the injection tract (Figure 3C). The area of hypointense signal change increased with the number of injected cells (Figure 3, C and D). Two days after injection of 100,000 labeled mESCs, the volume of hypointense signal change was 7.7 mm3, based on normalized threshold-based three-dimensional volume reconstruction (Figure 3, D and G). The shape of the hypointense volume reflected the needle tract; however, in the area of the corpus callosum, a significant enlargement could be observed. The volume of the hypointense signal change first increased in volume to 11.6 mm3 (8 weeks; Figure 3, E and H) before decreasing to 5.4 mm3 (16 weeks; Figure 3, F and I). Twenty-four weeks after transplantation, 5.2 mm3 hypointense voxels could still be observed. All six animals of this group showed comparable signal dynamics. However, when comparing the spatial distribution of hypointense signal change, significant differences between the injected animals became visible (Figure 4, comparing A and D with B and E and C and F). Injection of magnetically labeled cells was performed stereotactically to the previously described coordinates, and the pressure of injection and number of cells were held constant as well. Animal 1 displays a homogeneous distribution of hypointense signal change along the needle tract, whereas animal 2 shows a lateral expansion alongside the corpus callosum; almost no signal change in the striatum was detected.
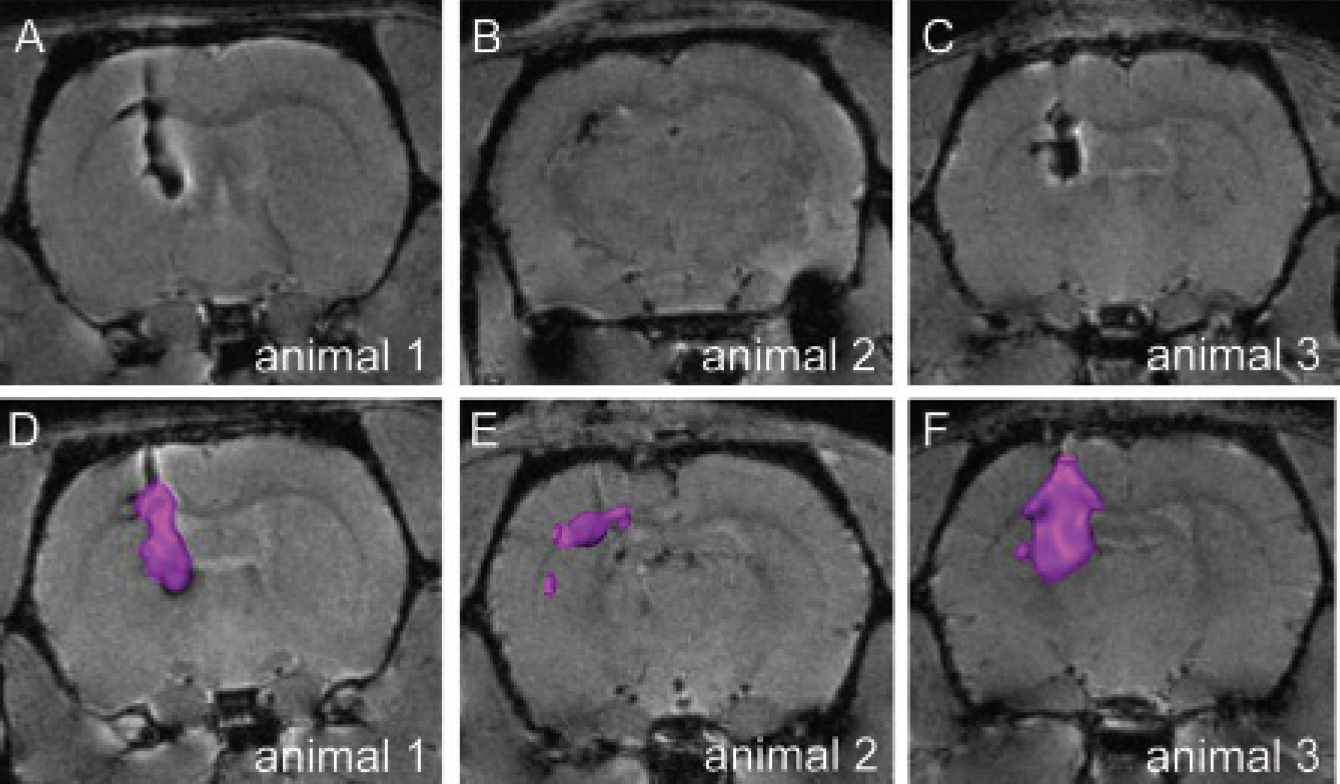
Interindividual comparison of MRI signal distributions 8 weeks after transplantation of 100,000 magnetically labeled mouse embryonic stem cells into the striatum of 6-OHDA-lesioned rats. A to C, Three different animals revealed interindividual differences of cell distribution. D to F, Volume reconstructions of hypointense signal changes of the same animals. Cells are visualized as colored three-dimensional objects.
Functionally, no decrease in the number of amphetamine-induced rotations could be observed when comparing animals transplanted with mESCs with controls injected with NaCl (data not shown).
Histologic Correlation of MRI Signal and Detection of Oxidative Stress Levels
To test whether the MRI signal changes are indeed caused by magnetically labeled mESCs, we performed an extensive histologic analysis after the final imaging session 6 months after injection. mESCs were labeled with both a magnetic marker (VSOPs) and a genetic marker (GFP). First, we stained with Prussian blue for detection of iron oxide–labeled cells. Figure 5A) reveals magnetically labeled cells within the injection tract in a coronal section. Clearly, spatially confined Prussian blue–positive cells could be detected; no significant background staining indicative for extracellular iron could be observed. No clear Prussian blue–positive cells could be observed distant from the injection tract. Next, we localized GFP-expressing cells by CLSM. In all seven animals injected with GFP-VSOP-mESCs (one animal 1 × 10⁴ cells, six animals 1 × 10⁵ cells), cells exhibiting strong fluorescence in the GFP emission band (500–550 nm) could be detected on excitation with 488 nm blue light. Figure 5B) shows a CLSM image of a coronal section of the adjacent histologic slice of Figure 5A) of the same animal. The injection tract is clearly visible; around 30 cells with high fluorescence intensity can be delineated. In the neighboring brain parenchyma, single cells exhibiting comparable signal intensity can be detected. Also in transverse sections, the injection tract is visible as a central defect. Cells with high fluorescence intensity could be found mostly within the central injection tract; a few cells were identified within a maximal distance of 1 mm. However, in most cases, the cells were not distributed in a random fashion radially around the injection tract but rather in stripes, suggesting distribution alongside white matter tracts. Next, the micrographs displaying Prussian blue–positive cells (Figure 5C) were overlaid with the CLSM image (Figure 5D) to test for colocalization. Figure 5E) shows an overlay of the two imaging modalities. All Prussian blue–positive cells could be correlated with GFP fluorescence in all sections investigated. However, about 10% of GFP-positive cells exhibited no or very slight Prussian blue staining. For the estimation of the number of surviving mESCs 6 months after transplantation, GFP-positive cells were quantified in 130 subsequent transverse sections of one animal injected with 1 × 10⁵ mESCs, spanning 2.6 mm of the length of the injection tract of 3 mm. The upper 400 μm could not be analyzed owing to technical reasons. A total of 5,300 cells were counted, or about 5% of the number cells injected initially. To test for secondary uptake by macrophages, transverse sections were immunostained for macrophage marker CD11b and incubated with a red fluorescent secondary antibody. A ring of CD11b-positive cells around the injection tract indicative of inflammation became visible (Figure 5F). No overlay of GFP fluorescence with CD11b-positive cells could be detected, and the Prussian blue staining of the adjacent section did not colocalize. No significant augmentation of oxidative stress levels became evident in histologic sections containing the injection tract (Figure 5H). In contrast, incubation of histologic slices with H2O2 led to a significant increase in fluorescence intensity (Figure 5G).

Cellular origin of MRI signal changes and detection of oxidative stress levels in situ. A, Prussian blue–positive cells delineating the injection tract. B, Corresponding confocal laser scanning microscopic image of native green fluorescent protein (GFP) fluorescence. C to E, Colocalization of GFP-positive cells with iron-positive cells: (C) Prussian blue staining; (D) GFP fluorescence; (E) overlay. F, Overlay of GFP fluorescence (green channel) with red fluorescence of macrophage marker CD11b. G and H, Detection of protein cabonyls in situ: (G) incubation with H2O2; (H) slice adjacent to the injection tract.
Discussion
This study gives a comprehensive view of the relationships between cell type, incubation parameters, and MRI detection, taking into account the impact of magnetic labeling on the biology of stem cells. Notably, we were able to track cells for as long as 6 months in a rat model of PD.
For cell labeling and magnetic resonance tracking, diverse types of iron oxide particles are being used, mostly differing in the size and composition of coating, resulting in distinct cellular uptake properties and magnetic resonance detectability. 30 32 VSOPs are coated with citrate, yielding a total diameter of 9 nm and an acidic surface charge, whereas the diameter of dextran-coated ultrasmall superparamagnetic iron oxide particles typically ranges between 20 and 40 nm. The intracellular uptake of iron oxide particles is mediated by adsorptive endocytosis 33 ; however, receptor-mediated uptake has also been reported. 34 In our view, the question of which particles are best suited for safe and efficient stem cell labeling remains open. However, VSOPs do not require additional lipofection agents for efficient stem cell labeling, as shown in this study, and aggregate intracellular in lysosomes, shielded from the cytosol. 22 In addition to magnetic labeling of stem cells for detection with MRI, transfection of stem cells with bioluminescence reporter genes and subsequent noninvasive bioluminescence imaging in vivo represent an alternative stem cell labeling technique.35, 36 Bioluminescence-based imaging of stem cells has the clear advantage of a genetic encoding of the reporter and thereby high specificity; however, the spatial resolution of MRI cannot be achieved owing to tissue scattering and absorption.
Our study identified considerable differences among the cell populations investigated with regard to the amount of nanoparticles incorporated. mESCs showed a very high iron uptake at low incubation concentrations (1.5 mM). In contrast, much higher incubation concentrations (6 mM) were needed to obtain a comparable magnetic labeling of mBMCs and hUCBCs. The labeling efficacy of mESCs at 3 mM could not be reached by mBMCs and hUCBCs, even at highest concentrations of up to 12 mM VSOPs. The higher incorporation rate of mESCs may be attributable to their high proliferation, leading to a high metabolic rate and finally resulting in a higher phagocytotic activity. 37 Also, the cell diameters are significantly different: the diameter of mBMCs and hUCBCs ranges between 8 and 12 μm, in comparison with mESCs, with an average diameter of 18 to 20 μm. Thus, a much higher probability of surface area–dependent, endocytotic events can be estimated for mESCs. Furthermore, a higher spatial storage capacity of VSOP-containing organelles can be estimated for mESCs. On the other hand, very high incubation concentrations (above 3 mM) led to decreased viability of mESC after labeling (data not shown), excluding these protocols from further experimental use. Adult cell populations displayed higher resistance to oxidative stress caused by VSOPs in the incubation medium without a significant reduction in viability even at the 12 mM incubation concentration. This might at least partially be due to the fact that both hUCBCs and mBMCs mainly consist of mature cells that are generally less sensitive to oxidative stress.
The additional use of lipofection agents further significantly increased the uptake of iron oxide nanoparticles by ESCs, as indicated by previous studies.8, 38 However, we suggest caution when considering the use of lipofection agents. It cannot be excluded that significant numbers of iron oxide particles are adherent only to the outer cell membrane; furthermore, iron oxide uptake appeared to be less homogeneous in the cell population, which would render the quantifiability of the magnetic resonance signal changes after transplantation impossible.
To exclude an effect of magnetic labeling that might induce apoptotic cell death in case of additional stress, for example, after transplantation into host tissue, we additionally measured oxidative stress levels in ESCs at concentrations that have been shown to have no effect on apoptosis levels. The role of free iron in the generation of oxidative stress is undoubted and has been shown clearly.39, 40 Free radicals and highly reactive particles from secondary reactions originate from the *OH radical–releasing Fenton reaction catalyzed by an iron (Fe2+/Fe3+) redox cycle driven by the highly reducing environment of the cytosol. Oxidative protein modification and lipid peroxidation by transition metals such as copper (Cu+/Cu2+) and iron have been shown to play an important role in many different (neuro)pathologies, such as PD 41 43 and Alzheimer disease,44, 45 and transport or storage or metabolic disorders of transition metals, such as Wilson disease in the case of copper 46 or increased oxidative stress in the case of iron. 47 49
The measurement of oxidative markers revealed that incubation with 3 mM VSOPs augments oxidative stress levels in mESCs, similar to the results of previous studies on macrophages. 22 Hence, stress levels returned to control levels 24 hours after incubation. Incorporation of the particles into membrane vesicles seems to shield off the cytosol. Adverse effects on adjacent cells in the case of lysis with release of VSOPs into the target tissue are therefore unlikely. Moreover, the effective local concentration in this case is several orders of magnitude below the incubation concentration investigated here.
The question also remains whether mononuclear cells with a significant lower VSOP uptake compared with mESCs may still be detected with comparable sensitivity in vivo. Our group, 12 as well as other groups, 50 52 has shown that the detection of small numbers or even single stem cells is feasible. T2*-weighted imaging sequences have been shown to be extremely sensitive to susceptibility changes caused by iron oxide–loaded cells. Even though clear differences in iron oxide uptake between the cell populations became obvious, this was not reflected by corresponding changes in magnetic resonance detectability, assuming that the saturation point is already reached. This finding has important implications for the design of future studies as it recommends the use of an incubation protocol, which affects the cells as little as possible, rather than one aimed at increasing iron oxide uptake.
Monitoring and tracking of labeled stem cells, paralleled by functional assessments, are expected to be essential for control of both the safety and therapeutic efficacy of novel stem cell–based therapeutic approaches. This holds especially true for chronic diseases such as PD, which require long-term observation of cell-treated experimental animals or patients. In this study, cell-specific sensitivity of long-term MRI observation of labeled mESCs was shown in a relevant model of PD for up to 6 months. Whereas no significant migration patterns could be observed, probably owing to the absence of migratory clues in a chronic disease model, 53 substantial differences in the interindividual distribution of transplanted cells became apparent. These differences in the spatial distribution of grafted cells are most likely due to small variations in the injection procedure, which cannot be completely avoided. Detecting the exact distribution of cells noninvasively is therefore in our view vital for the assessment of stem cell–based therapies as these differences will be reflected in distinct therapeutic outcomes. Clearly, MRI alone is not yet capable of quantifying the number of surviving cells as only about 5,000 surviving cells still exhibited significant hypointensities—about half the size compared with immediately after transplantation; this result is consistent with the results of other studies. 54 However, subsequent Prussian blue and CD11b stainings indicated specificity of the labeling protocol as iron oxide particles were clearly shown in CD11b-negative, GFP-positive cells, thus excluding possible iron uptake by microglia or macrophages on transplantation, as discussed by other groups. 55 However, in contrast to other studies, 56 functional improvement following cell transplantation was not observed. This might be related to the use of nonpredifferentiated mESCs as there are indications that the best functional results are observed after transplantation of predifferentiated cell populations. 6
In conclusion, the magnetic labeling procedure should be individually tailored to the cell type of interest. We have shown that simply measuring intracellular iron concentration and conducting a viability assay are insufficient to evaluate the safety of the method as the effects on apoptosis rate and oxidative stress levels are not taken into account. In our study, the viability assays alone would have suggested the safety of high incubation concentrations, which later proved to induce a significant augmentation in oxidative stress levels and apoptosis rates. These elevated stress levels could become significant in transplantation studies, where exogenous stem cells need to survive and integrate in the host environment, and survival rates are already poor even without additional magnetic labeling.
Significant differences in the amount of incorporated iron oxide particles between the cell types remain even after the tailoring of incubation protocols. Importantly, our imaging experiments show that despite these differences, the MRI detectability of all three cell populations was not significantly affected. When designing a cellular MRI approach, strong emphasis needs to be placed on the safety of the incubation procedure, not necessarily on maximizing the amount of incorporated iron, as these differences have been shown to play a minor role in the MRI tracking of cells.
Notably, our findings underscore the need for noninvasive cell tracking for the evaluation of stem cell–based therapies as interindividual differences in cell distribution seem to be significant.
Footnotes
Acknowledgments
We thank J. Schnorr, M. Taupitz, and B. Hamm for support; H. Pilgrimm for the generous gift of VSOPs; P. Lorenz for injection of stem cells; R. Schober for help with immunohistochemical analysis; and C. Easton for editing the manuscript. Financial support was provided by the Bavarian State Ministry of Sciences, Research and the Arts, “ForNeuro-Cell.”
Financial disclosure of reviewers: None reported.