
Abstract
Molecular imaging with magnetic resonance imaging (MRI) may benefit from the ferrimagnetic properties of magnetosomes, membrane-enclosed iron biominerals whose formation in magnetotactic bacteria is encoded by multiple genes. One such gene is MagA, a putative iron transporter. We have examined expression of MagA in mouse neuroblastoma N2A cells and characterized their response to iron loading and cellular imaging by MRI. MagA expression augmented both Prussian blue staining and the elemental iron content of N2A cells, without altering cell proliferation, in cultures grown in the presence of iron supplements. Despite evidence for iron incorporation in both MagA and a variant, MagAE137V, only MagA expression produced intracellular contrast detectable by MRI at 11 Tesla. We used this stable expression system to model a new sequence for cellular imaging with MRI, using the difference between gradient and spin echo images to distinguish cells from artifacts in the field of view. Our results show that MagA activity in mammalian cells responds to iron supplementation and functions as a contrast agent that can be deactivated by a single point mutation. We conclude that MagA is a candidate MRI reporter gene that can exploit more fully the superior resolution of MRI in noninvasive medical imaging.
CELLULAR CONTRAST for magnetic resonance imaging (MRI) relies on the introduction of exogenous contrast agents for most molecular imaging applications. Usually, cells are transiently labeled with superparamagnetic iron oxide (SPIO) particles 1 3 ; however, with time, these particles are degraded and dissipate from the cell, making them impractical for long-term studies. In addition, SPIO particles alone cannot provide information on cellular and molecular function. To circumvent these shortcomings, gene expression systems are under development to couple protein expression with the formation of suitable contrast agents. Such endogenous contrast for localizing cells in vivo is particularly valuable to the field of cell therapy, where migration of transplanted stem cells, long-term viability, and capacity for differentiation strongly influence therapeutic outcomes. This is essential for advancing myocardial stem cell therapy 4 and pancreatic islet transplantation5, 6 in the treatment of cardiovascular disease and diabetes, respectively. Equally important is the need to localize cancer cells, track metastasis, and trace the path of tumor cell invasion into vascular or other tissue targets. 7 Accurate localization provides information about critical cell–cell interactions and leads to a greater understanding of cell fate decision making, the processes that influence a cell's biologic program and the clinical outcomes of disease.
To enhance endogenous cell contrast for molecular MRI, we examined the potential of iron regulatory proteins to act as contrast agents. Several research groups have exploited methods of packaging and concentrating iron in the cell, with some success. 8 Adenocarcinoma cells have been virally transduced to overexpress modified, heavy and light ferritin subunits. 9 On culture in iron-supplemented medium, elevated cellular levels of ferritin provide a sufficient quantity of the crystalline ferrihydrite core for MRI. Cohen and colleagues reported increased magnetic resonance relaxation rates through overexpression of the intact heavy ferritin chain in C6 glioma cells and tumors, in the absence of iron supplementation. 10 They extended this expression system to the analysis of transgenic mice, 11 using MRI to monitor inducible expression in both fetal and adult tissues.
We adapted strategies used by magnetotactic bacteria for the biomineralization of iron. Magnetite produced by these freshwater prokaryotes is compartmentalized in magnetosomes, subcellular structures that arise from invaginations of the inner plasma membrane. 12 Similar to SPIO particles in size and composition, magnetosomes respond comparably to magnetic fields. 13 There is also evidence that some eukaryotic cells contain biogenic magnetic particles called magnetite. Some migratory species of fish and birds contain magnetite, 14 16 and these particles may be involved in geomagnetic field sensing. There is also evidence that magnetite is synthesized in human and rat brains 17 and is increased in some neurodegenerative diseases. 18 The conservation of magnetosome genes, their homology to other bacterial actin-like proteins, 12 and their evolutionary relationship to eukaryotic cytoskeletal proteins 19 further suggest that higher organisms, including mammals, may be amenable to magnetosome formation.
In bacteria, magnetosomes are formed in response to the coordinated activity of approximately 20 genes. 20 Although not all of these genes have been characterized, Matsunaga and colleagues identified MagA, a putative iron transporter from magnetotactic bacteria if not the magnetosome. 21 23 We investigated the ability of mammalian cells to produce magnetosome-like particles by expressing the MagA gene from Magnetospirillum sp. AMB-1. 4 Zurkiya and colleagues recently reported inducible MagA expression in 293FT cells using a tetracycline-responsive promoter and MagA complementary deoxyribonucleic acid (cDNA) from Magnetospirillum magnetotacticum strain MS-1. 24 In a MagA-expressing clone, increased R2 relaxivity correlated with MagA expression and increased iron uptake in pellets of 105 cells. Bolus injection of 5 × 10⁵ cells into the mouse striatum confirmed the possibility of MRI detection of MagA-expressing cells. Therefore, MagA may be useful in molecular MRI of gene expression.
We used the MagA gene to impart magnetic sensitivity to mammalian cancer cells and provide a basis for cell tracking by MRI. Here we compare MagA with a mutated form, MagAE137V, which has a dominant negative effect on intracellular contrast and abolishes the magnetic properties of MagA. We report a new radiofrequency (RF) pulse sequence for cellular detection by MRI at 11 Tesla (T), which resolves clusters of cells from a population of selected, MagA-expressing neuroblastoma cells. Examination of iron uptake suggests that MagA-expressing cells incorporate iron at extracellular iron concentrations preferred by magnetotactic bacteria and convert these stores into MRI-detectable contrast not achieved by MagAE137V-expressing cells. These activities do not alter the viability or proliferation of transfected cancer cells. In addition, we show that MagA-expressing cancer cells will form tumors in vivo that are detectable by MRI at 3 T. Together, these data provide insight into the mechanism of MagA function and outline a method for molecular MRI of MagA-based reporter gene expression.
Materials and Methods
Cells and Vectors
Mouse neuroblastoma (N2A) cells were cultured in Dulbecco's Modified Eagle's Medium (DMEM) containing 4.5 g/L
The MagA cDNA was obtained by polymerase chain reaction (PCR) of M. magneticum sp. AMB-1, using primers 5′-GCTGCCTTCGTGATAAGAACGCGTCC-3′ and 5′-TTGAGATCGGCGGCATCGTCA-3′ and cloned into pCR2.1-TOPO. The gene was subcloned into the enhanced green fluorescent protein (EGFP) vector pEGFP-C3 at EcoR1. A mutation in MagA at E137V was isolated from the initial cloning and corrected by site-directed mutagenesis, using the QuikChange XL Site-Directed Mutagenesis Kit (Stratagene, Cedar Creek, TX). Consistent with reported sequences, MagA contains glutamic acid at residue 137.
Gene Expression: Reverse Transcription PCR
Total ribonucleic acid (RNA) was isolated from approximately 2 × 10⁶ N2A cells expressing vector, MagAE137V, or MagA using the GenElute Mammalian Total RNA Miniprep Kit from Sigma-Aldrich Co. (St. Louis, MO) and quantitating by A260. Reverse transcription (RT) was conducted by standard procedures using the SuperScript II Reverse Transcriptase Kit from Invitrogen and 1 μg RNA. PCR was performed on an Applied Biosystems (Foster City, CA) thermal cycler, model 2720, with 2 μL (one-tenth) of the RT reaction and 1.5 mM MgCl2. Primers for MagA were designed to amplify a 503-base oligonucleotide using a forward 5′ external primer, which recognizes linker sequences used in MagA cloning, and a reverse 3′ internal primer. The sequences are 5′-GCTGCCTTCGTGATAA-GAA-3′ and 5′-GATTCCAGCACCAGCATCAT-3′, respectively. Human β-actin primers, forward 5′-GCCC-CTCTGAACCCTAAG-3′ and reverse 5′-CATCACAA-TGCCAGTGGTA-3′, generated a 150-base oligonucleotide and were included for reference. Amplification was achieved in 30 cycles, annealing at 56°C.
Magnetic Resonance Imaging
Cells were cultured as described above in the presence or absence of 250 μM ferric nitrate and immobilized in gelatin, porcine type A (Sigma-Aldrich Canada, Mississauga, ON), for imaging. 25 Briefly, cells were cultured to subconfluency, harvested, washed three times with phosphate-buffered saline (PBS) pH 7.4, and counted with a hemacytometer. Wells from a 96-well, Nunc-immunomodule break-apart plate, Nunc A/S (Roskilde, Denmark), were cleaned in ethanol and allowed to air-dry. The bottom of each well was coated with 90 μL molten 4% gelatin/PBS and allowed to set at room temperature. To this, 1 million cells in 70 μL 1% gelatin/PBS (fluid at room temperature) was added and given 1 to 2 hours at 20°C to settle on top of the 4% layer, prior to setting the mold at 4°C. The cells were sealed from the surface with approximately 150 μL 2% gelatin/PBS. All gelatin/PBS solutions were sterile filtered at 37°C.
Three-dimensional MRI was acquired on an 11 T Bruker system using a dual echo sequence: spin echo at an echo time (TE) of 5 ms and a gradient echo at TE 15 ms. The repetition time (TR) for this sequence was 1,000 ms, with eight averages resulting in a 137-minute acquisition for a 128 × 128 × 8 matrix. The field of view was 8 × 8 × 1.2 mm3, providing 65 × 65 × 75 μm3 resolution. Positive contrast images were produced by subtraction of the gradient echo image from the spin echo image. Images were analyzed using Northern Eclipse software (Empix Imaging Inc., Mississauga, ON).
In Vivo Imaging
Human MDA-MB-435 cells were transfected with pcDNA3.1Zeo+ containing the MagA insert. Stably expressing cells were selected using 800 μg/mL Zeocin in DMEM containing 1.0 g/L
Fixed mice were imaged using a 3 T MRI scanner fit with a custom-built solenoid RF coil and a custom-built high-performance gradient insert. 25 Images were obtained using a three-dimensional steady-state free precession imaging sequence with the following parameters: bandwidth 62 kHz, TR/TE 16/8 ms, scan time 20 minutes, and resolution 100 × 100 × 200 μm3.
Iron Measurement
Prussian Blue Stain
3,3′-Diaminobenzidine tetrahydrochloride (DAB)-enhanced Prussian blue staining was performed using the Prussian Blue Stain Kit (Polysciences Inc., Warrington, PA) and DAB (Sigma-Aldrich Canada). A Zeiss Axioskop microscope (Thornwood, NY) and Northern Eclipse v7.0 were used to acquire the images. N2A cells expressing vector, MagAE137V, or MagA were cultured in the absence or presence of 250 μM ferric nitrate and then transferred to a six-well plate with cover slips and grown to confluency on the cover slips. Plates of cells were washed three times with PBS and incubated 20 minutes in 2% paraformaldehyde/PBS. The cells were incubated twice in 2% potassium ferrocyanide/2% HCl for 10 minutes. Following three washes in PBS, cells were incubated for 15 minutes with 0.6 mg/mL DAB/0.05 M Tris-HCl pH 7.6/0.03% H2O2. Cover slips were then washed 1 minute with distilled water, wiped dry, and mounted with Fluoromount G (Electron Microscopy Sciences, Hatfield, PA).
Mass Spectrometry
N2A cells expressing vector, MagAE137V, or MagA were cultured at least 7 days in medium in the absence or presence of various concentrations of ferric nitrate, ranging from 31.25 to 250 μM. Protein extracts were prepared using confluent plates of cells, washed three times with PBS, and scraped into 1 mL ice-cold lysis buffer. The latter consisted of 850 μL 10 mM Tris-HCl pH 7.4/5 mM ethylenediaminetetraacetic acid (EDTA) and 150 μL Complete Mini Protease Inhibitor solution, prepared by dissolving 1 tablet in 1 mL of distilled water according to the manufacturer's specifications (Roche Diagnostics, Basel, Switzerland). The cell suspension was sonicated three times with 12-second bursts using a Sonic Dismembrator, model 500 (Fisher Scientific, Ottawa, ON), set at an amplitude of 29%. Protein was quantified using the bicinchoninic acid assay. 26 Inductively coupled plasma mass spectrometry (ICP-MS) for iron and zinc was performed by Elemental Analysis Inc. (Lexington, KY).
Cytotoxicity Measurement
MTT Assay
Mitochondrial dehydrogenase activity was measured using the 3-(4,5-dimethylthiazol-2-4′)-2,5-diphenyltetrazolium-bromide (MTT) assay as described previously.27, 28 Parental N2A cells were used to calibrate cell number with tetrazolium salt absorbance. Comparison of growth among vector-, MagAE137V-, and MagA-expressing cells was made, plating 50,000 cells and monitoring growth over 4 days with the MTT assay. MagA expression, in the presence and absence of iron supplementation, was compared to parental cells, cultured in the presence and absence of growth inhibitors. Apoptosis was induced by culturing for 16 hours with either 0.02% sodium azide (NaN3)/medium, 29 24 mM ethylene glycol tetraacetic acid (EGTA)/medium, 30 or both.
Statistics
Global comparison of MRI data from vector, MagAE137V, and MagA expression was performed with analysis of variance. The Tukey test was used to determine significance among multiple comparisons. All tests were two-tailed, with the threshold for statistical significance set at p ≤ .05.
Results
MagA Expression in Mammalian Cells
MagA was expressed in N2A cells as a green fluorescent protein fusion protein, linking the N-terminus of MagA with the C-terminus of EGFP. The levels of expression were measured by RT-PCR and revealed MagA transcripts in mutant (MagAE137V) and wild-type (MagA) populations of selected cells (Figure 1). As expected, transcripts from cells expressing vector alone were negative for MagA expression. Evidence of protein expression was examined by fluorescence microscopy of the EGFP tag. Whereas vector-transfected cells displayed relatively intense green fluorescence throughout the cytosol, cultures of mutant- or MagA-expressing cells exhibited decreased fluorescence that was often restricted within the cytoplasm (data not shown). Localization of MagA in both the cytoplasmic and membranous compartments of magnetotactic bacteria has been reported using a MagA-luciferase construct. 23

MagA is expressed in N2A cells. RT-PCR was performed using total ribonucleic acid from cells transfected with vector (pEGFP-C3) alone or bearing either mutant (MagAE137V) or MagA inserts. A 500 bp MagA PCR fragment was amplified only from cells expressing the inserted gene. For reference, primers to human β-actin indicate the efficiency of RT-PCR and approximately equal amounts of sample by ethidium bromide staining of a 1% agarose gel.
DAB-enhanced Prussian blue staining showed the effect of iron loading in the presence of MagA expression and various concentrations of an iron supplement (Figure 2). Compared with parental or vector-transfected cells (data not shown), there was a more intense iron reaction in cells expressing MagA and MagAE137V when cultured in the presence of an iron supplement. Both 62.5 and 250 μM ferric nitrate were effective at promoting iron retention in MagA-expressing cells. In contrast, the reaction in MagAE137V expression did not appear to be as intense at the lower extracellular iron concentration.
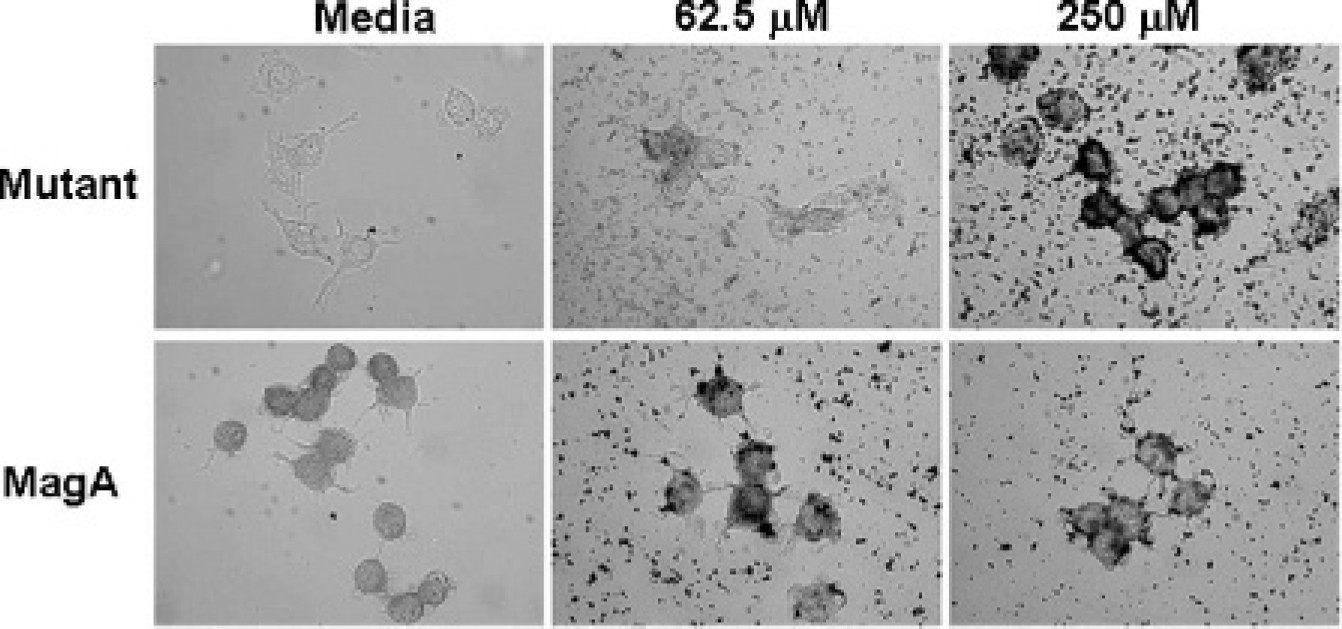
MagA expression increases iron retention. DAB-enhanced Prussian blue staining (×100 original magnification) was performed on both wild-type and mutant MagA-expressing N2A cells, cultured at least 7 days in the presence and absence of an iron supplement. Cells expressing MagAE137V respond to increasing concentrations of extracellular iron, exhibiting the greatest staining at 250 μM ferric nitrate. In contrast, MagA expression raises the sensitivity of N2A cells to extracellular iron, showing intense staining in cultures supplemented with 62.5 μM ferric nitrate. Media alone contains 0.25 μM ferric nitrate.
MRI of MagA-Expressing Cells
We examined the ability of MagA expression to generate intracellular contrast suitable for detection of cells by MRI at 11 T. One million cells expressing vector, MagAE137V, or MagA were mounted in gelatin/PBS and analyzed by a dual echo sequence: spin echo followed by gradient echo (Figure 3A). Overexpression of EGFP-MagA fusion protein significantly increased cellular contrast in N2A cells compared with vector or mutant (Figure 3B). The dual echo sequence provides two complementary pieces of data: a short spin echo image and a gradient echo image. The short spin echo (TE 5 ms) will minimize most susceptibility artifacts; thus, whether or not a cell contains a susceptibility agent, the water signal will be evident in the MRI. Objects that contain little water, such as the reference hair or air bubbles, will appear as signal voids on the short spin echo. The gradient echo image (TE 15 ms) will not discriminate between the cells containing a susceptibility agent, air bubbles, and/or hair as all will be devoid of signal. Subtraction of gradient echo (Figure 3B-E) from spin echo (Figure 3B-D) provided a convenient way to represent the full information from the data and to create a positive contrast image (Figure 3B-F). Analysis of positive contrast images by Northern Eclipse software gave an objective estimate of the number of signal voids per field of view obtained from each expression system (Table 1). An initial three-group comparison by ANOVA indicates that vector, mutant, and MagA samples are significantly different (p = .015). Post hoc testing for differences with the more conservative Tukey test reveals differences between paired data and shows that MagA-expressing cells generated significantly more signal voids than either vector (p = .017) or MagAE137V (p = .023) expression. There was no significant difference in MRI-detectable contrast between vector- and mutant-expressing N2A cells.
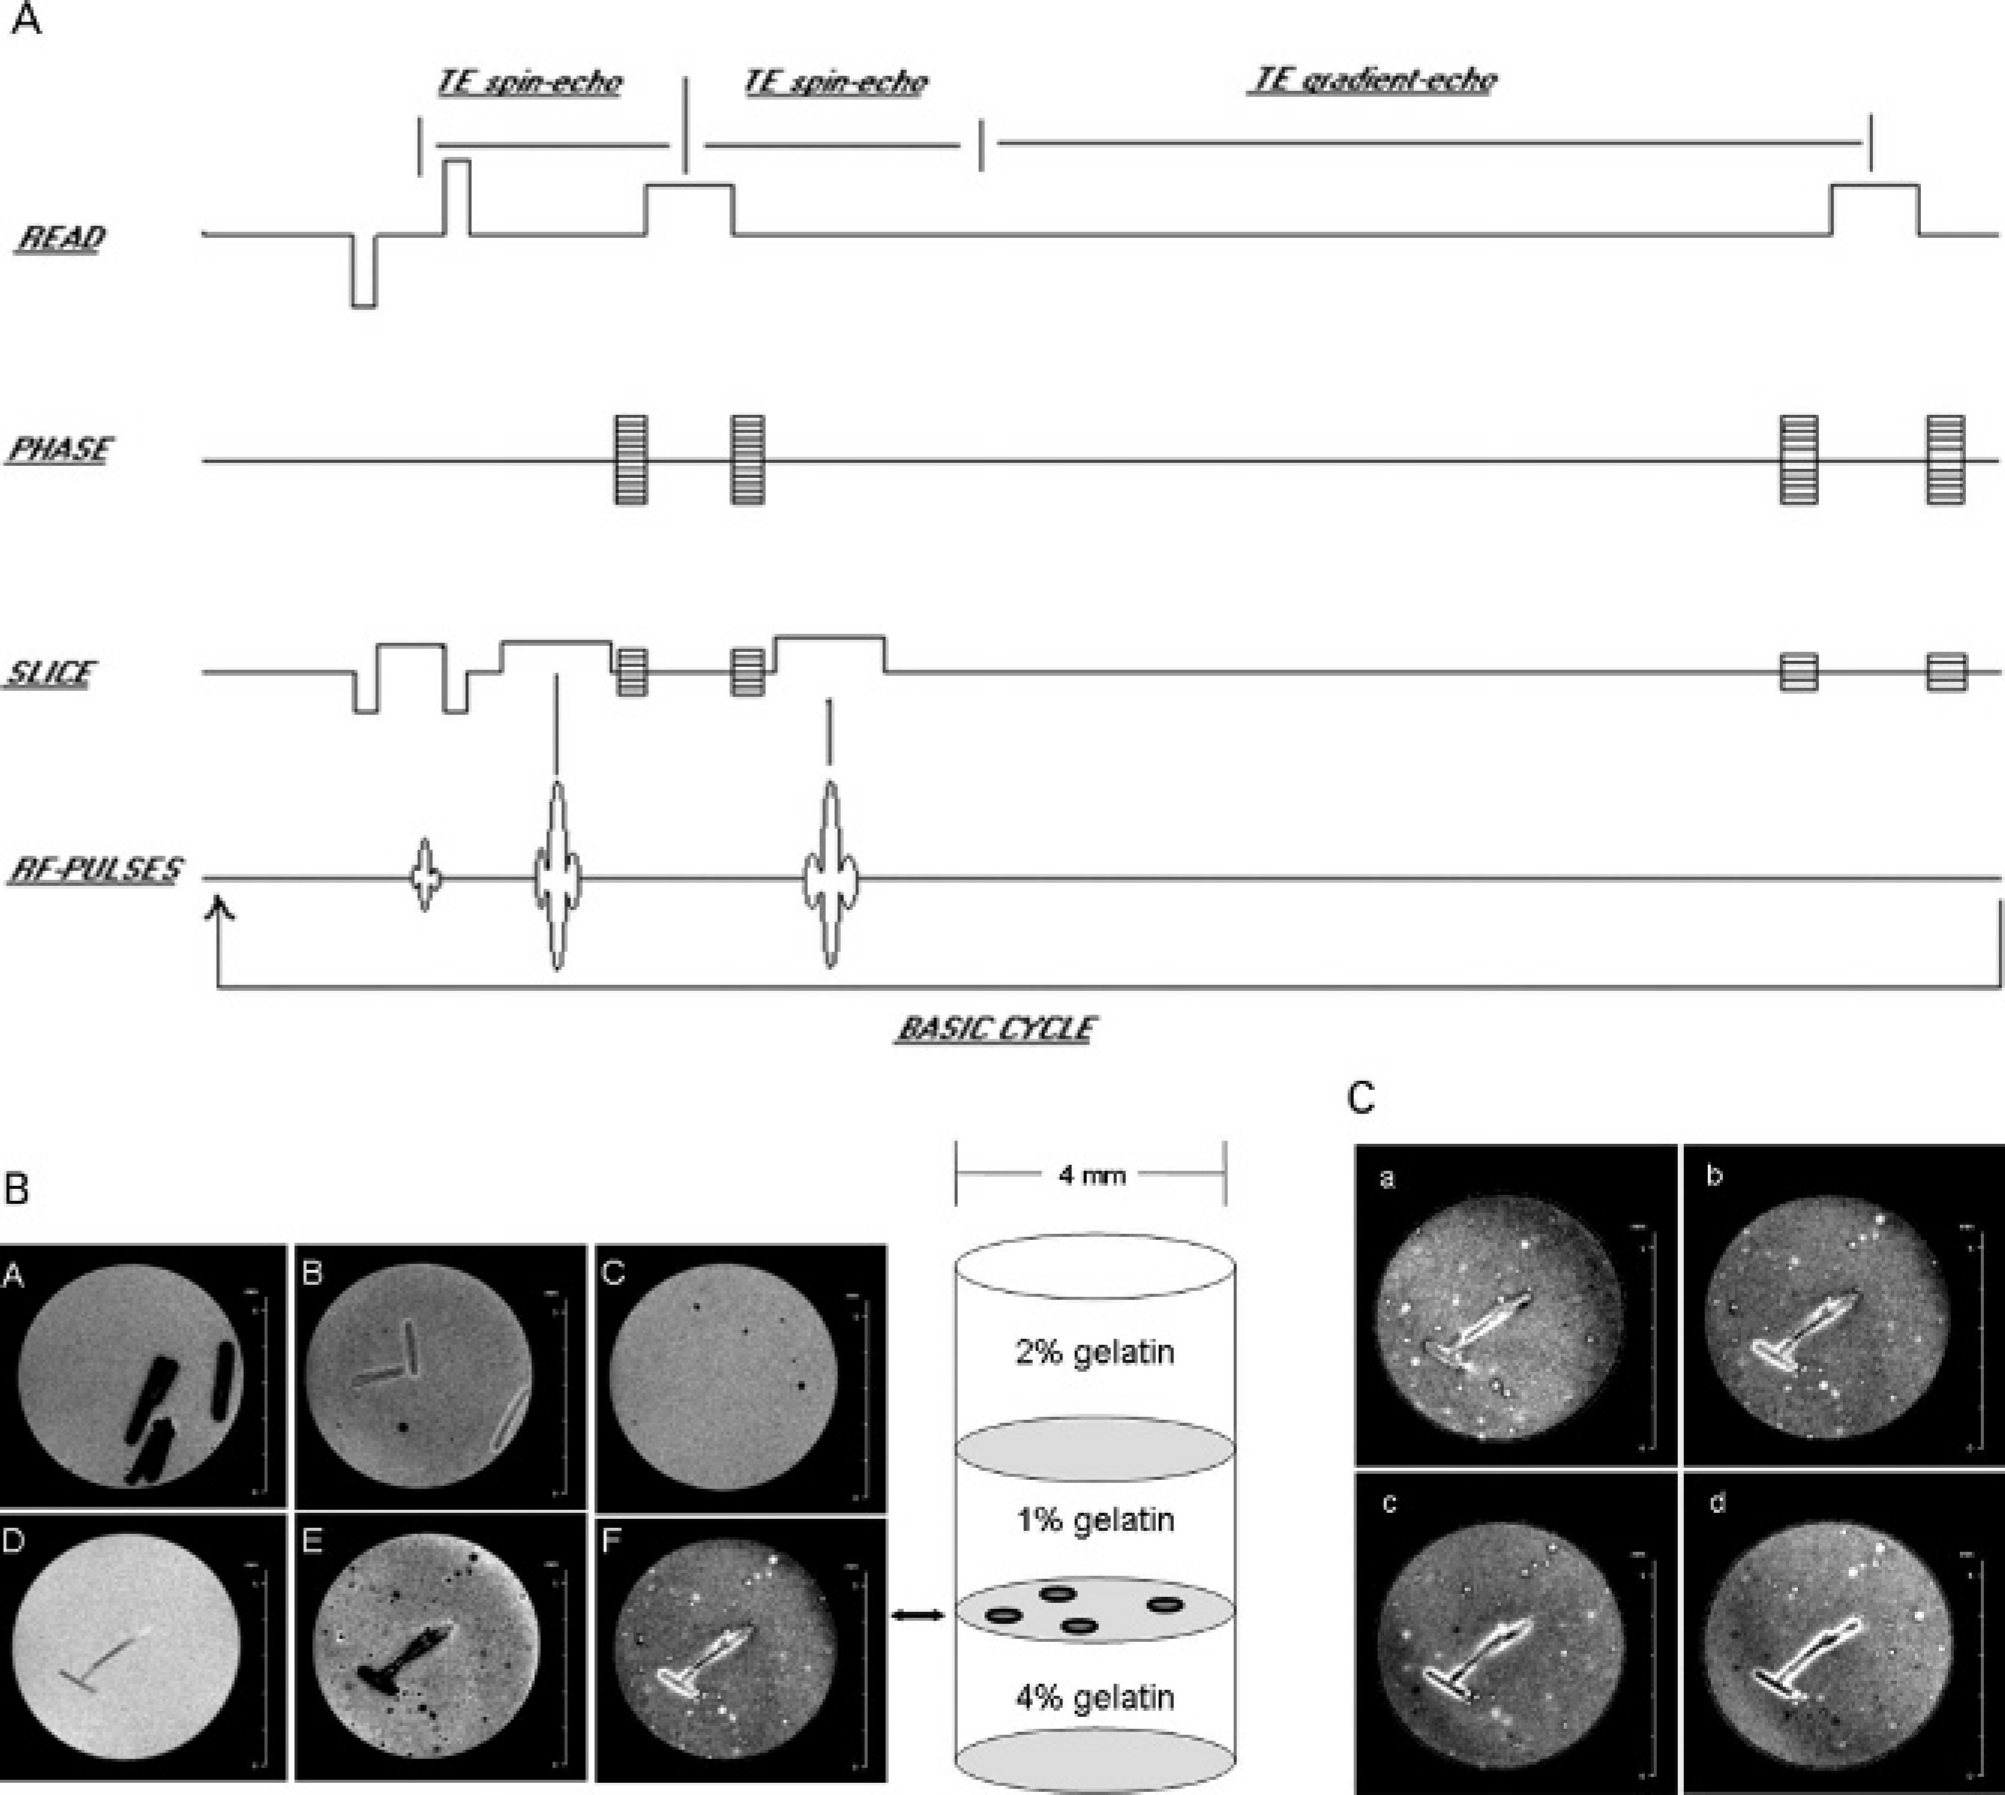
MagA-expressing cells can be imaged by magnetic resonance imaging (MRI). Transfected N2A cells were cultured as previously described in medium containing 250 μM of ferric nitrate. After 7 days in iron supplement, cells were harvested by trypsinization and mounted in 1% gelatin/phosphate-buffered saline (PBS) between 2% and 4% gelatin/PBS, above and below the cellular layer, respectively. A, The MRI pulse sequence used for the 11 T, three-dimensional imaging shows a 5 ms spin echo acquired 5 ms after the slab selecting 90° radiofrequency (RF), whereas the 15 ms gradient echo is acquired 15 ms after the spin echo formed by the second 180° RF. Note that the TR is 1,000 ms (not shown to scale). B, The diagram at the right shows the sample layout in a single well from a break-apart 96-well plate. A to F show axial cross sections captured by MRI through 106 cells. A to C show gradient echo images of gelatin-alone, vector-expressing, and MagAE137V-expressing cells, respectively. Below, images of MagA-expressing cells show spin echo (D), gradient echo (E), and positive contrast (F). C, In serial sections through MagA-expressing cells, positive contrast images (a–d) show variations in the number, location, and size of the MRI signal.
Tukey's Test Analyzing Gene Expression and Magnetic Resonance Imaging Signal
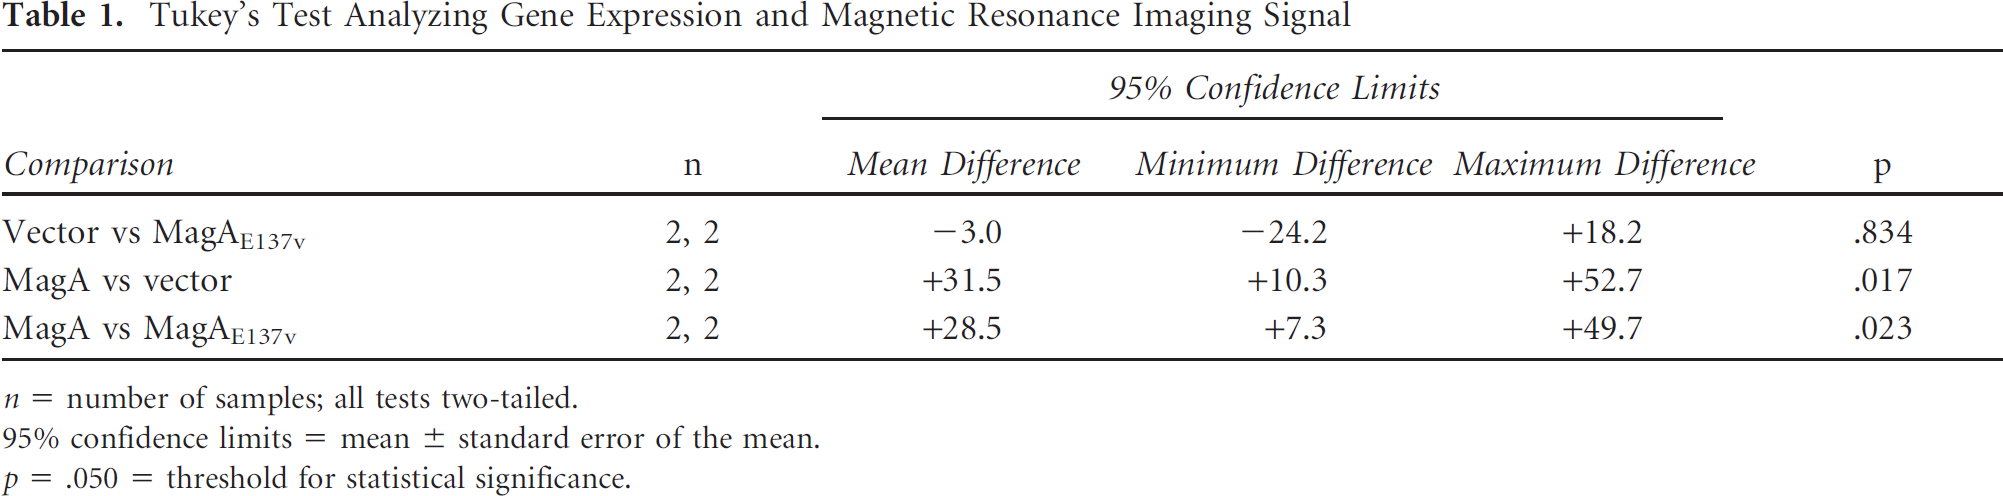
n = number of samples; all tests two-tailed.
95% confidence limits = mean ± standard error of the mean.
p = .050 = threshold for statistical significance.
A sample with 106 cells immobilized in 1% gelatin provided a layer of cells approximately 1 mm thick that could be imaged across several slices. MagA expression allowed the detection of cells in serial planes, resolving cellular detail from a mixed population of cells (Figure 3C). This result demonstrates the feasibility of imaging small numbers of cells and implies that adequate intracellular contrast depends on sufficient MagA activity, presumably characteristic of highly expressing cells.
Function and Viability of MagA-Expressing Cells
During the initial cloning of MagA, a variant form was obtained that resulted in a single point mutation changing glutamic acid 137 to valine. This mutation occurs in the domain of MagA bearing homology to the Na/H exchanger superfamily, and cells expressing MagAE137V showed no significant change in the number of signal voids (see Figure 3) and Table 1), suggesting that this mutation compromises the ability of MagA to increase iron uptake or generate iron contrast. We sought to quantify iron uptake in MagA- and MagAE137V-expressing cells with ICP-MS trace metal analysis of cellular iron and zinc (Table 2). Zinc content in vector-, MagAE137V-, and MagA-expressing N2A cell lysates was relatively constant, 110 to 170 ng Zn/mg protein, regardless of whether cells were cultured in the presence of an iron supplement. In contrast, the iron content varied with iron supplement. In all cell lysates collected from cultures lacking supplementation, the iron content was relatively low: 27 to 52 ng iron/mg protein. However, lysates from iron-supplemented cultures contained approximately 4 (190/52) to 108 (2,900/27) times more iron than nonsupplemented cultures. Surprisingly, lysates from vector-expressing cells incorporated more iron at 62.5 μM ferric nitrate than at 250 μM extracellular iron. Although it appeared that iron uptake in MagAE137V- and MagA-expressing cultures was greatly enhanced at 250 μM, further interpretation of the data is restricted by the wide variability and small sample size.
ICP-MS Analysis of Iron and Zinc in MagA-Expressing Cell Lysates*
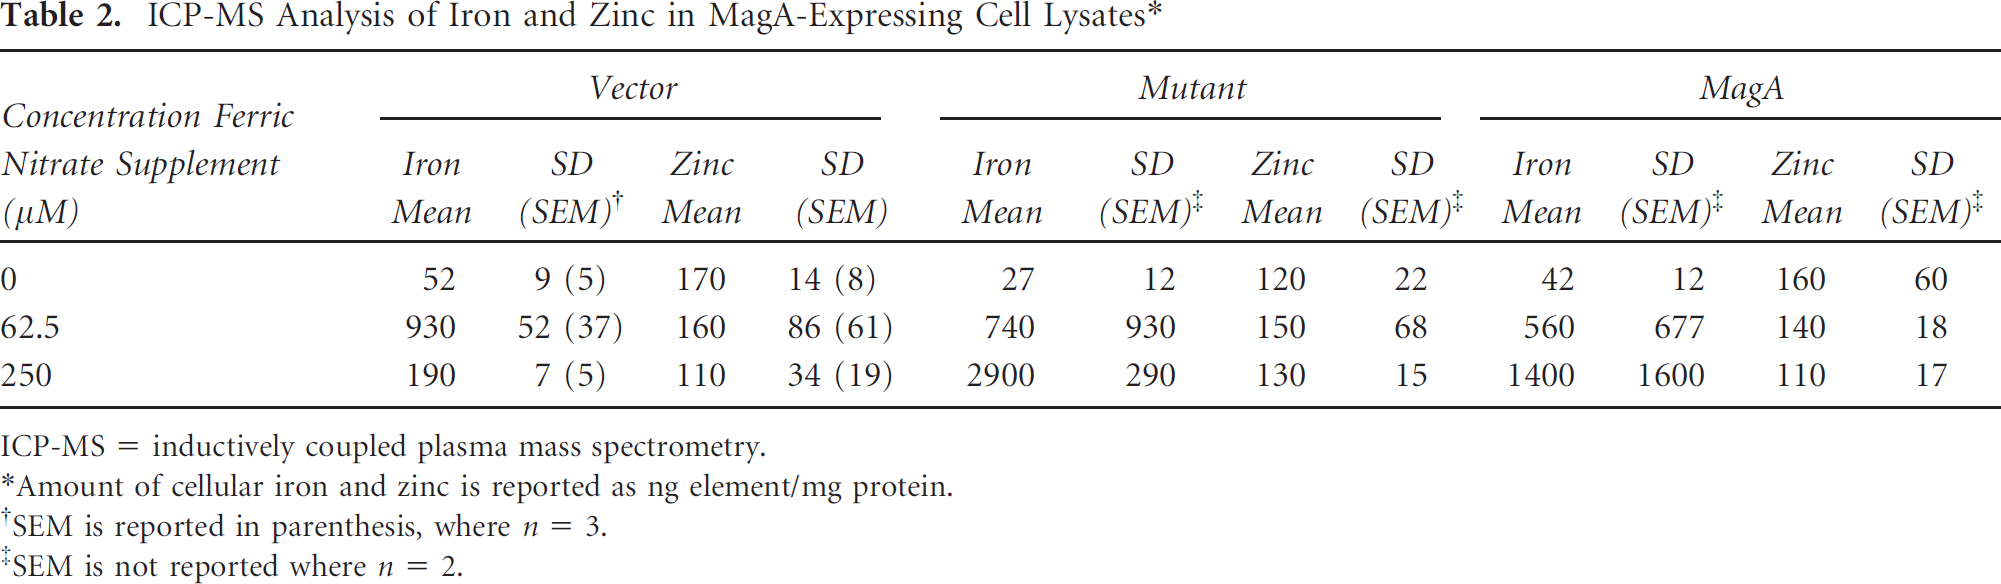
ICP-MS = inductively coupled plasma mass spectrometry.
Amount of cellular iron and zinc is reported as ng element/mg protein.
SEM is reported in parenthesis, where n = 3.
SEM is not reported where n = 2.
To complement in vitro analyses, we examined the ability of MagA-expressing cancer cells to form tumors in vivo (Figure 4). Cells were injected subcutaneously into the hindlimb of nude mice and allowed to grow for 3 weeks. MRI at 3 T on formalin-fixed mice showed tumors in both untransfected control and MagA-expressing MDA-MB-435 cells, with no evidence of necrosis on dissection. Although the tumors were somewhat smaller in the MagA expression system relative to parental growth, further experiments are necessary to understand the degree to which animal variability may impinge on this result. The apparent contrast enhancement in MagA-expressing tumors was obtained when both cell cultures and mice received an iron supplement. Large areas of signal void in the mouse gut were visualized only in animals receiving a dietary iron supplement.

MagA-expressing tumors can be detected in vivo. Nude mice received subcutaneous injections of either parental (R) or MagA-expressing (L) MDA-MB-435 cells. At 3 weeks postinjection, fixed mice were imaged on a 3 T MRI scanner fitted with a custom-built radiofrequency coil. Axial cross sections reveal tumors in both hindlimbs, as indicated by arrows. The same animal is shown in two different planes to present the tumors on each flank.
The viability of transfected N2A cells was also assessed using the MTT assay (Figure 5). Cultures of MagA-expressing cells were compared with those of untransfected parental N2A cells and to vector and MagAE137V expression. The growth rate of transfected cells monitored over 4 days was consistent with the absorbance produced by cells that are approximately doubling in number every 24 hours (see Figure 5A), and Figure 5A). Each expression system displayed comparable growth curves, suggesting little or no effect of MagA on cell proliferation. The effect of iron supplementation was also examined and compared to cells undergoing a programmed cell death (see Figure 5C). MagA-expressing cultures grown for several weeks in 62.5 or 250 μM ferric nitrate were no different from MagA-expressing or parental (wild type) cells cultured in media alone. Furthermore, parental N2A cell cultures exposed to azide and/or calcium ion chelation showed a moderate to severe drop in absorbance, not observed in iron-loaded, MagA-expressing cells. Taken together, these results indicate that MagA expression in a mammalian cell cancer line does not alter its growth characteristics.

MagA expression is not cytotoxic. The MTT assay was used to measure N2A cell growth and viability in the presence and absence of MagA expression. All results represent the average of three experiments; error bars show standard error of the mean (SEM). A, Untransfected cells were plated at the desired confluency and incubated 24 hours prior to analysis. The number of cells plated was correlated with absorbance at 575 nm. B, The growth rate of vector-, MagAE137V-, and MagA-expressing cells was examined. Cultures of 50,000 cells were monitored over 4 days, correlating absorbance at 575 nm with the length of time in culture. C, MagA-expressing cells cultured in the presence and absence of iron supplementation were compared with parental cells cultured in the presence and absence of proapoptotic factors. EGTA = ethylene glycol tetraacetic acid; WT = wild type.
Discussion
We have examined a gene expression system that harnesses the ability of cells to use iron in the production of intracellular contrast for noninvasive molecular imaging with MRI.
MagA is a putative iron transporter from magnetotactic bacteria that converts mammalian cells from low-contrast into contrast-enhanced cells that respond to a magnetic field. Although all cells examined in the present study and cultured in iron-supplemented media have some capacity to incorporate iron, only MagA-expressing cells used this iron for intracellular contrast. A single point mutation in the Na/H antiporter homology domain of MagA reduced the formation of intracellular contrast to background levels. These results demonstrate a role for the conserved transporter sequences in iron handling and suggest the importance of negatively charged residues in this interaction.
A number of methods have been used to image single cells under insufficient low-resolution imaging techniques. These methods rely on superparamagnetic contrast agents being incorporated into each cell, with the effect of disturbing the local magnetic field around the cell to the point of rendering each of them visible on low-resolution images. Broadly speaking, the imaging techniques used in combination with the contrast agent could be classified as frequency- and phase-selective techniques. The frequency-selective techniques are specifically designed to excite a range of frequencies around each cell, with the exclusion of the bulk water farther away. 31 These techniques can be difficult in practice because of the need for very good field homogeneity in the bulk water. To their advantage, they will provide a positive contrast image of the cells against the darkened background of the bulk water. In contrast, phase-selective techniques, such as gradient echo imaging, will rely on loss of phase coherence of the spins in the vicinity of the cell to establish a negative contrast image of the cells against the bright background of the bulk water. These techniques have a very straightforward implementation.
Here we propose a technique that produces both the advantage of positive contrast imaging and the simplicity of use of the phase-selective encoding technique. In addition, as is explained below, the new technique allows for a clear distinction between air bubbles and real cell concentrations. As usual, it is assumed that the cells have been loaded with a proper contrast agent. The imaging technique relies on a single two-echo imaging sequence, with one echo being a spin echo and the other a gradient echo. The spin echo serves as a reference image to the gradient echo. The spin echo will largely refocus all spins in the sample, including those in the vicinity of the cells, so the contrast from the cell will be minimal. If the signal void is actually a hole, as with an air bubble, then it will appear as such in both spin echo and gradient echo images. A cell or cluster of cells will be distinguished by the detectable signal in the spin echo image. The gradient echo image will show strong negative contrast for the cells, air bubbles, or any solid particles. The combined information obtained from the two images allows for the distinction between the cells and the other possibilities. Also, a positive contrast image of the cells can be obtained by subtracting the gradient echo image from the spin echo image, largely removing the bulk water signal while positively enhancing the water signal around the cells. It should be noted that this positive contrast imaging technique works well for the relatively homogeneous cell culture used in our experiment. For in vivo work, in which there could be large field inhomogeneities arising from susceptibility differences and the shimming of the main magnetic field, the spin echo time used may not be short enough to prevent signal decay in those regions.
In our analysis of MagA contrast at high magnetic field strength, we obtained discrete regions of signal void, suggesting that not all cells in the field of view were producing the same amount of iron contrast. Given that a population of selected cells may nevertheless comprise cells with varying levels of MagA expression, we speculated that a clonal cell line may display more uniform contrast. However, clonal populations under the same conditions provide similar images (data not shown). Alternative explanations include cell turnover and the activity of other iron regulatory proteins. The latter control mechanisms are complex, often cell specific, and potentially dysregulated in disease.32, 33 Furthermore, in magnetotactic bacteria, electron microscopy has shown that not all magnetosomes within a given microorganism contain the same size of iron mineral.20, 34 Given these differences in the size of the iron oxide particle and the evidence for membrane-enclosed magnetite in other MagA-expressing mammalian cells, 24 variation in the contrast signal may reflect the normal state of cellular iron biomineralization.
Our initial in vivo study of MagA-expressing tumor growth demonstrates the ability of transfected cancer cells to carry out their biologic program. Further study is required to resolve issues of MRI contrast heterogeneity in cancerous and surrounding healthy tissue and to optimize conditions for in vivo iron mineral formation and detection. Comparison of MagAE137V and MagA expression systems may facilitate this process. Both Prussian blue staining and mass spectrometry indicate the capacity for iron uptake in mutant- and MagA-expressing cells. Inconsistencies in trace metal analysis may have arisen from sampling errors inherent in the handling of particulate cell lysates but nonetheless show changes in iron uptake not seen in cellular zinc. The dominant negative phenotype of cellular iron contrast in MagAE137V expression is consistent with a multistep process for iron biomineralization. 19
In conclusion, despite the superior spatial resolution of MRI, distinguishing cellular detail still requires the use of some type of contrast agent. Although iron homeostasis in mammalian cells is tightly regulated along the transferrin-transferrin receptor-ferritin axis, bacterial genes involved in iron handling may not be subject to the same control. MagA expression in mammalian cells provides magnetic resonance contrast without cytotoxicity and in an iron-responsive manner. Further study of MagA properties will enable long-term tracking of cells and molecular events, including reporter gene activity for MRI.
Footnotes
Acknowledgments
We are grateful for the technical expertise of Kuyilini Balasundaram, Andrea Mitchell, and Andrew McClennan. Nigel Banner from Empix Inc. provided software support for the analysis of MRIs. S.D. is a scholar of the Canadian Diabetes Association.
Financial disclosure of authors: The research presented herein was funded by grants from the Cancer Imaging Network of Ontario and the Canadian Diabetes Association. Multi-Magnetics Inc. helped defray the cost of MRI use.
Financial disclosure of reviewers: None reported.