
Abstract
Connecting fluorescence signals with anatomic structures enhances our ability to monitor biologic processes in mice. Here, we present a semiautomated approach to correlate two-dimensional (2D) noninvasive near-infrared fluorescence (NIRF) imaging with three-dimensional (3D), high-resolution, flat-panel volume computed tomography (fpVCT). We developed an algorithm to colocalize fluorescence signals of NIRF-labeled antibodies directed against matriptase and urokinase plasminogen activator receptor (uPAR) to orthotopic carcinomas in mice visualized by fpVCT. For this purpose, mice were anesthetized and fixed on a multimodality animal bed containing fiducial markers filled with iodine-containing contrast agent and fluorescent dye. After intravenous administration of contrast agent and Cy5.5-labeled antibodies, NIRF and fpVCT images were obtained, without repositioning the mice. Binding of Cy5.5-labeled matriptase-specific antibody to pancreatic tumors and Cy5.5-labeled uPAR-specific antibody to mammary carcinomas was assessed by time-domain NIRF imaging measuring the location of fluorescence intensity and its lifetime. In summary, we developed a novel 2D-3D registration technique for image fusion with NIRF imaging and fpVCT to provide complementary information in tumor models on the in vivo association of functional information with anatomic structures. The combination of fpVCT with NIRF imaging will now allow targeted and effective monitoring of preclinical tumor therapies.
Given that morphologic structures cannot be visualized with optical imaging modalities, other imaging devices, such as magnetic resonance imaging (MRI), ultrasonography (US), and computed tomography (CT), are in high demand to provide complementary anatomic information. To image the skeleton and the uptake of contrast in blood vessels and soft tissues, we applied flat-panel volume computed tomography (fpVCT), which allows three-dimensional (3D) visualization of mice in vivo with high isotropic imaging resolution. Compared with other imaging methods, fpVCT enables shorter scanning times of approximately 8 seconds, producing an isotropic resolution of about 150 μm.10–12 Therefore, fpVCT is an excellent compromise between the extremely high resolution of micro-CT (ie, 10 μm), which is not applicable for living mice because of long scanning times and high x-ray exposure, and the normal clinical CT with scanning times down to 0.5 seconds but a resolution of only about 300 μm, which is not sufficient for tumor studies in mice models.10–15
Fusion of data sets from NIRF and morphologic imaging devices allows coregistration of fluorescence signals and anatomic structures in living mice. This coregistration can be achieved by using either different imaging modalities within a single device or by a “software“-based approach that combines images from separate devices. For the latter method, a multimodality bed is commonly used to visualize an object of interest in different devices without repositioning. Image properties, tissue geometry, and texture are generally used to align the data sets. With the assumption that major structures in both modalities appear homogeneous, a function can be formulated that will be extremal for exact registered data. Thus, fusion of such data sets can be achieved by estimation of the extreme points of such a global cost function.16,17 Given that no dual-modality contrast media is available for both CT and NIRF imaging, morphologic data from CT and functional information from the optical imager are completely decoupled and show no overlapping homogeneous regions. For these reasons, algorithms based on global cost functions are not applicable, so we applied a landmark-driven 2D-3D registration process as described by Weese and colleagues 18 and Penney and colleagues. 19
We validated the fused NIRF-fpVCT images of two orthotopic tumor xenografts by applying iodine-containing contrast agents and Cy5.5-labeled antibodies directed against matriptase (a trypsin-like transmembrane serine protease) and urokinase plasminogen activator receptor (uPAR), a surface receptor of the urokinase pathway. Both matriptase and uPAR are known to be highly expressed in pancreatic or mammary carcinomas, respectively, and are thought to play important roles in extracellular matrix degradation during the process of cancer cell invasion.20,21 We proved the feasibility and accuracy of our approach by employing an experimental model and by comparing the fused data sets from NIRF and fpVCT for the murine orthotopic tumor models with the corresponding macroscopic appearance of tumors during autopsy. Here, we present an approach that allows the visualization of functional information obtained by NIRF imaging within an adequate anatomic framework and will therefore be an important tool for in vivo cancer research.
Material and Methods
Animal Tumor Models
Female severe combined immunodeficient (SCID) mice, strain C.B-17/ Ztm-scid, and male athymic nude NMRI-Fox1nu/nu mice (Winkelmann, Borchen, Germany) were used and maintained in a sterile environment in special cages with filter huts and in a scantainer (Scanbur, Koge, Denmark). Cages, bedding, and water were autoclaved, and the food was gamma-irradiated. All animals were handled according to German regulations for animal experimentations, and all animal protocols were approved by the administration of Lower Saxony, Germany. To reduce fluorescence background, mice were fed with chlorophyll-reduced GLP Nafag 890 food (Provimi Kliba AG, Kaiseraugust, Switzerland) for approximately 1 week before NIRF imaging.
To evaluate the utility of the in vivo two-modality imaging approach, we used two orthotopic tumor models: mammary carcinoma in SCID mice (n = 6) and pancreatic carcinoma in nude mice (n = 8). For this purpose, estrogen-independent human breast cancer cells, MDA-MB-231 and BT474, or human pancreatic adenocarcinoma cells, AsPC-1 (both from American Type Culture Collection, Rockville, MD), were cultivated at 37°C in a humidified atmosphere containing 5% CO2. MDA-MB-231 cells were grown in Dulbecco's Modified Eagle's Medium (PAN Systems, Aidenbach, Germany) and AsPC-1 and BT474 cells in RPMI 1640 medium with GlutaMAX enriched with 4.5 g/L glucose and 10 mM HEPES (Gibco BRL, Germany). Both media were supplemented with 10% fetal calf serum and 1% L-glutamine (PAN Systems). Tumor cells were harvested near-confluence by brief trypsination in 0.25% trypsin–ethylenediaminetetraacetic acid solution (Gibco), washed several times, and placed in sterile phosphate-buffered saline (PBS) shortly before implantation.
Animals were anesthetized by 75 mg/kg ketamine hydrochloride with 15 mg/kg xylazine, applied intraperiotenally prior to the implantation. For the mammary carcinoma model, 1 × 10⁶ MDA-MB-231 cells suspended in 25 μL of PBS were implanted orthotopically into SCID mice as described by Missbach-Guentner and colleagues. 12 All mice developed palpable solid tumors within the mammary gland within 3 weeks. Implantation of pancreatic tumor cells, AsPC-1 cells (1 × 10⁶), into the proximal part of the pancreas of nude mice (n = 8) was performed as previously described. 22 Before injection, cells were additionally mixed with 20 μL of precooled Matrigel (BD Biosciences, Heidelberg, Germany) to avoid leakage from the organ. For the validation of the experimental procedure, a mixture of 5 μL of Cy5.5 (10−7 M; GE Healthcare Bio-Sciences, Little Chalfont, United Kingdom), 5 μL of Isovist 300 (Bayer Schering, Berlin, Germany), and 25 μL of precooled Matrigel was injected slowly into the mammary glands of anesthetized female SCID mice (n = 2). All manipulations were conducted under aseptic conditions using a laminar flow hood. Intraoperatively and during the next 2 days after implantation, mice received analgesic intraperitoneally (Rimadyl; active substance carprofen; dose 5 mg/kg). They were inspected daily for body weight loss and general condition. All animals tolerated the procedure well. At the end of the experiment, autopsies of mice were performed. Tissue sections (2.5 μm) were stained with hematoxylin and eosin as described previously.12,22
Immunocytochemistry and Microscopy, Western Blot Analysis
Cytospins from MDA-MB-231, BT474, and AsPC-1 cells were fixed in methanol-acetone (1:1), blocked for 30 minutes in 2.5% bovine serum albumin, and incubated for 2.5 hours either with murine monoclonal antibody against human uPAR, uPAR-mAb, or rabbit polyclonal antibody against matriptase (MT-Ab), followed by Alexa Fluor 488-labeled secondary goat antimouse/antirabbit antibodies. Samples were mounted in Prolong Gold Antifade Reagent with DAPI for nuclear staining (all from Invitrogen GmbH, Karlsruhe, Germany). Fluorescence was analysed by an Axiovert 200M microscope equipped with an ORCA-ER Hamamatsu Digital Camera using standard fluorescein isothiocyanate (FITC) and DAPI filter sets. Data were acquired with AxioVs40 software (Carl Zeiss). For Western blot analysis, proteins of cell lysates of AsPC-1 and MDA-MB-231 cells were separated on a 7% polyacrylamide gel, transferred to a nitrocellulose membrane (Amersham Biosciences, Freiburg, Germany), blocked with 3% milk powder, immunoblotted for 2 hours with 2 μg/mL of MT-Ab, and developed using horseradish peroxidase–coupled secondary antibody (1:10,000; Bio-Rad Laboratories GmbH. Munich, Germany) and enhanced chemoluminescence (Amersham Biosciences).
Multimodality Animal Bed, Marker, and Contrast Media
To overcome the problem of repositioning mice during transfer between different imaging devices, we developed a multimodality animal bed on which mice were gently fixed with thin rubber bands (Figure 1). The bed consisted of a wooden plate covered with black foam rubber; these materials introduced no artifacts in computed tomographic (CT) images and provided a sufficient contrast between mice and the background in images taken with the camera of the optical imager. For continuous anesthesia during both scans, the anesthesia mask was also fixed to the bed. Reference points for a landmark-driven process of image registration were created by attaching eight marker objects, visible in both modalities, to the animal bed. For this purpose, we filled hollow spheres with a mixture of the iodine-containing x-ray contrast agent Ultravist 150 (Bayer-Schering, Berlin, Germany) and the fluorescence dye Cy5.5, in a ratio of 2:1.
Flat-Panel Volume CT
For CT, we used the fpVCT (Figure 2A), a nonclinical CT prototype equipped with two flat-panel detectors (GE Global Research, Niskayuna, NY) as previously described by Missbach-Guentner and colleagues.11,12 Mice were anesthetized with vaporized isoflurane at a 1.5 to 2% concentration and placed on the multimodality bed throughout both imaging sessions (see Figure 1). Iodine-containing contrast agent, 150 μL of Isovist 300 per mouse, was administered intravenously approximately 28 seconds before the scan. To highlight the gastrointestinal tract with contrast, fasting mice with pancreatic tumors were fed 2 to 4 hours before scanning, with pellets soaked in water-diluted oral contrast agent (Ultravist 150; 1:10). To further highlight the stomach, 200 μL of water-diluted contrast agent (Ultravist 150; diluted 1:10) was administered orally by gavage directly before the fpVCT scan. All data sets were acquired with the same protocol: 1,000 views per rotation, 8 seconds of rotation per step, 360 used detector rows, 80 kVp, and 100 mA. To image the whole mouse, we applied scans with three continuous z-steps. A modified Feldkamp algorithm implemented on a simultaneous computer with eight nodes was used for image reconstruction, resulting in isotropic, high-resolution volume data sets (Figure 2B).
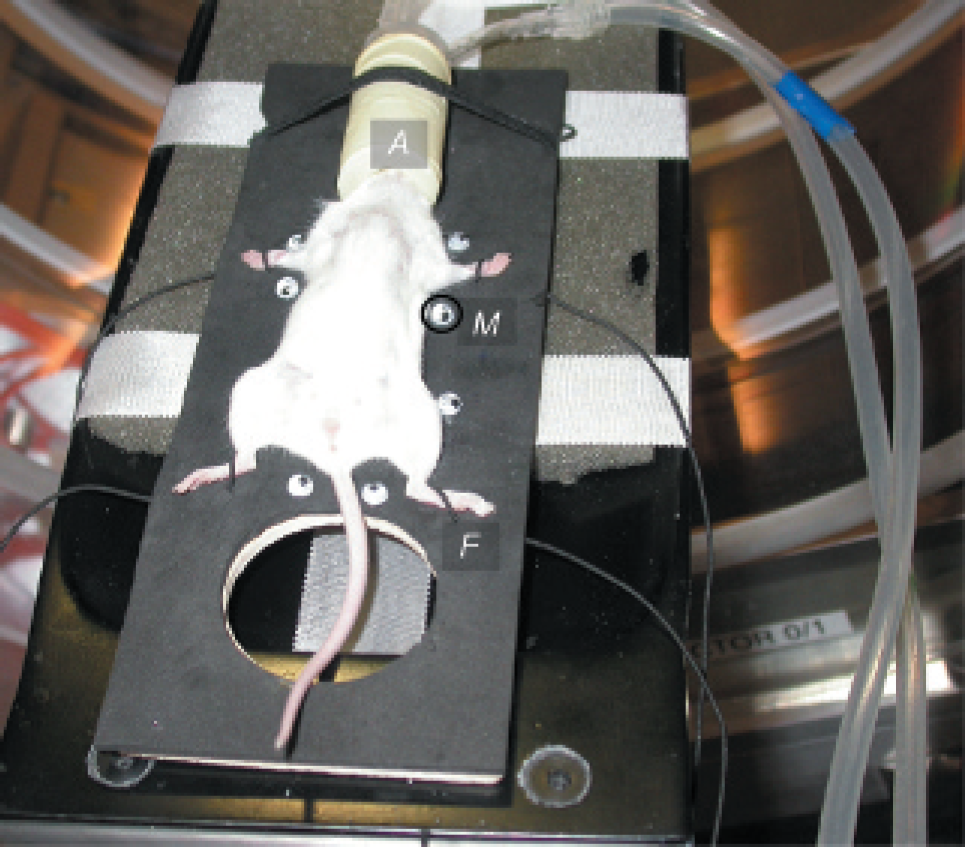
Tumor-bearing mouse fixed on the multimodality animal bed in the fpVCT gantry. The animal bed (black), anesthesia mask (A) with its connections for isoflurane and exhaust air, small rubber bands for fixation (F), and spherical markers (M) are displayed.
Near-Infrared Fluorescence Imaging
For NIRF imaging, we used the eXplore optix system (GE, ART Advanced Research Technologies Inc., Montreal, QC). Unlike most commercially available devices that use continuous excitation, the eXplore optix works with fastpulsed, monochromatic laser diodes, within a raster scheme as described by Ma and colleagues and McCormack and colleagues.2,7 Therefore, the system is able to measure NIRF time resolved, generating photon time of flight histograms for each raster point by measuring the times between every excitation pulse and the detection of a fluorescence photon. This enables lifetime analysis of the fluorescence signals. The so-called lifetime describes the mean residence time of the fluorophore in an excited state. In addition to the emission wavelength, it is a characteristic parameter for the fluorescent dye. The value of the lifetime can be calculated as an exponent of the slope of decay of the photon time of flight histogram by underlying a one-exponent model. 2 Such a model is adequate in our experimental setup because the fluorescence dyes used showed strong mono-experimental decay and dominated the measured signal with a signal to background ratio of 4 and higher. The lifetimes of fluorescent dyes are influenced by the surrounding tissue but were found to be shorter than analyzed values for autofluorescence. Here, lifetime measurements were used to suppress unspecific signals (mainly autofluorescence), which were identified by comparing lifetime values in vivo with the previously measured in vitro lifetime values for the used fluorescence probes. They were removed from intensity images by setting lifetime gates. The eXplore optix system is a 2D imaging system that works in a reflection scheme. Here, excitation and measurements of the fluorescence emission are done on the same side of the imaged object or animal. The output of the system consists of maps of intensity and lifetime of the fluorescence distribution, in relation to a previously acquired camera image of the animal (Figure 3). The eXplore optix imaging system has its limitation by the dependence of light scattering and absorption to the depth in the penetrated tissue as discussed by Ma and colleagues. 2 For instance, fluorescence inclusions in deeper layers yield to larger spots with lower intensity. Thus, high concentrations of fluorophores located in deep layers are impossible to distinguish from low concentrations of fluorophores included beneath the surface. In principle, the mean transit time of the emitted photon following an excitation pulse can be used to calculate the depth and concentration of the fluorescence inclusion by time-resolved measurements. 2 But in praxis, deep knowledge of the optical parameters of living mice is needed to obtain optimal depth information. Depth information obtained by eXplore optix was not of sufficient quality and was therefore not used in this study.

A representative fpVCT scan. A shows the gantry of the fpVCT system with the flat-panel detectors (D). B displays a volume rendering representation of a mouse that developed an orthotopic pancreatic carcinoma (PC) 7 weeks after cell implantation. Note that the pancreatic carcinoma shows no iodine uptake. Therefore, only the visualization of the stomach and small intestine indicates the location of the pancreatic cancer that developed in proximity to the gastrointestinal tract, between the stomach and duodenum. Here, 200 μL of oral contrast was administered by gavage, and 150 μL of Isovist 300 was administered intravenously, 28 seconds prior to the scan. Starved mice were fed with pellets soaked with water-diluted oral contrast (Ultravist 150) for 2 to 4 hours before scanning. M indicates one of the eight fiducial markers containing both contrast medium and fluorescent dye. For better anatomic orientation, the kidneys (K), stomach (S), and small gastrointestinal tract (G) are marked.
In Vivo NIRF Imaging Studies
Mice were injected via the tail vein with 50 μg of a Cy5.5-labeled uPAR, uPAR-mAb*Cy5.5, or 25 μg of Cy5.5-labeled MT-Ab*Cy5.5, both in a volume of 150 μL in PBS and 0.9% NaCl, respectively. Both antibodies were given in excess to ensure binding to the entire tumor. As controls, SCID mice with mammary carcinomas (n = 2) were injected with 50 μg of IgG1*Cy5.5 isotype control (BD Biosciences) and nude mice with Cy5.5 fluorophore alone. Images were acquired either 24 or 48 hours after the injection to ensure that unbound antibodies were cleared from mice. Whole-body images were taken prior to fluorescent probe administration and used as representative background autofluorescence, per animal.
The monoclonal antibody against uPAR was obtained by immunizing mice with recombinant soluble human CD87 (amino acids 1–277), which was constructed and purified as described by Ronne and colleagues. 23 Matriptase-specific polyclonal antibody has been raised in rabbits using denatured catalytic domain 24 of matriptase as an antigen and for affinity purification. Labeling of all antibodies and the IgG1 isotype control with Cy5.5 was performed in cooperation with Squarix GmbH (Marl, Germany). Dye to antibody molar ratios were as follows: 0.8 for the MT-Ab*Cy5.5, 1.45 for the uPAR-mAb*Cy5.5, and 2.25 for IgG1*Cy5.5 control.

Optical imaging. Exemplary outcomes of the optical imaging using eXplore optix are shown for the mouse with a pancreatic cancer illustrated in Figure 2. Note that a part of the region over the spleen displaying high autofluorescence was excluded from the scanning process to avoid saturation effects. A, Fluorescence intensity is displayed in normalized counts (NC) and is depicted from the mouse 24 hours after intravenous injection of the MT-Ab*Cy5.5 conjugate. Strong fluorescence signals are visible in the pancreatic region (red outline), where the primary pancreatic carcinoma (PC) developed, and in areas over the spleen and stomach (S). B, Estimated fluorescence lifetimes of the scanned region are depicted. Fluorescence signals located over the pancreatic tumor (PC) show lifetimes of 1.7 ns, characteristic for MT-Ab*Cy5.5 (red outline). Other regions, such as the spleen and gastrointestinal tract (GT), with high fluorescence intensity correspond to lifetimes much longer than 1.7 ns (GT 2.5 ns). Furthermore, the bladder region (B) also shows unspecific signals with a very short lifetime of only 1.0 ns. C, Overlay of the camera image and fluorescence intensity is displayed after gating to the specific lifetime interval of 1.5 to 2 ns. Binding of MT-Ab*Cy5.5 is demonstrated by high-intensity signals mainly within the pancreatic region, where the carcinoma developed (PC). M depicts an example of one marker object and its fluorescence signal in A and C.
For the measurements, we applied the eXplore optix with a 670 nm laser diode in combination with a 700 nm long-pass emission filter. Scans of mice were performed with a raster of 1.0 mm (regions of interest) or 1.5 mm (whole body scans) and an integration time of 0.7 seconds per point. Laser power was optimized for each sample. Data were analyzed with OptiView 1.00.00 analysis software (ART, Montreal, QC).
Results
Acquisition, Importation, and Preprocessing of Data
Orthotopic transplantation of MDA-MB-231 human breast tumor cells and AsPC-1 pancreas carcinoma cells resulted in primary tumor development in the mammary gland and in the head of the pancreas, respectively. In contrast, the AsPC-1 pancreatic tumors showed only very low iodine uptake and appeared half as bright as normal muscle tissue, whereas the gastrointestinal tract was 15 times more enhanced than the pancreatic tumors themselves (see Figure 2B). We generated 3D reconstructions on 512 × 512 matrices with isotropic voxels of about 150 μm (see Figure 2B).
Binding of intravenously administered MT-Ab*Cy5.5 conjugates to pancreatic tumors was determined by in vivo optical imaging. 2D maps of fluorescence intensity (see Figure 3A), fluorescence lifetime (see Figure 3B), and camera images (see Figure 3C) were generated and are shown representative in a nude mouse bearing a pancreatic tumor. Given that the area over the spleen showed strong autofluorescence signals with lifetimes of about 2.5 ns, this region was excluded from the scanning process (see Figure 3A). By doing so, we prevented saturation effects and ensured a good signal to background ratio. The estimated fluorescence lifetime for all scanned points varied between 0.3 and 3.3 ns (see Figure 3B). By gating the intensities around the previously measured lifetime of the MT-Ab*Cy5.5 conjugate of about 1.7 ns into the lifetime interval of 1.5 to 2.0 ns, autofluorescence signals of spleen and stomach were successfully suppressed. Figure 3C shows the gated intensities overlaid with the camera image acquired directly prior to the scan.
Information about intensity or lifetime was encoded in gray or color values and could not be addressed directly (see Figure 3, A and B). Owing to the fact that there was no output function for imaging data with geometric information, as in a format such as Digital Imaging and Communications in Medicine (DICOM), all maps were exported as 2D pseudocolored images into the classic BMP format. Therefore, the metric information of the image data was lost and was rebuilt only after successful image fusion with CT data sets. Quantification of the data images was achieved by remapping the color values into fluorescence intensity according to the applied colorbar (see Figure 3A).
After data importation, the marker regions were automatically detected in both the 3D fpVCT data set (Figure 4A) and the intensity image of the eXplore optix (Figure 4B). To allow this detection, threshold-based segmentation was performed and the size, shape, and compactness of these segmented objects were calculated and matched with standards for the marker objects. The landmarks were calculated as centers of the optimal fitting sphere (3D) or fitting circles (2D) for the referenced marker objects, resulting in landmark sets OCT and ONIKP, one for each of the imaging devices.
Calculation of the Average Plane
In the second step, an average plane through the landmark set of the 3D CT image was calculated under the assumption that all markers are located in one plane; this assumption can be made since all marker objects are fixed to the flat multimodal animal bed. Vectors that span this plane were identified with the main two eigenvectors e1 and e2 of the internal mass tensor Š (equation 2) of the landmark distribution. The symmetry of the internal mass tensor requires the plane to be oriented for further processing. To do this, we impacted a priori information of the standard orientation of the data set to get the right direction of the normal vector. Therefore, the 3D CT landmarks could be expressed in the average plane coordinate system. As a result, each 3D landmark position vector oi descended to the 2D position vector oi by application of equation 3, reducing the fusion process to a 2D matching problem (see Figure 4, A and B): mass centroid:

with N the amount of landmarks in the landmark set OCT.

Preprocessed images and homologic markers and validation of the fusion process. A, Volume rendering of the fpVCT data sets of the mouse shown in Figure 2 and Figure 3. All eight marker objects are identified by the software. The white mesh represents the calculated average plane through the marker positions. Note that for better visualization, the mesh is displayed with a lower resolution. B depicts the fluorescence intensity image. The calculated marker center positions are also displayed. A and B oj and pi is an example of a point-to-point reference. C displays the fusion results of A and B. D and E show representative data sets of the validation experiments. A mixture of Cy5.5, Isovist 300, and Matrigel was injected into the mammary glands of SCID mice (n = 2). D shows strong x-ray attenuation in the mammary glands by the inclusions of iodine-containing contrast agent (I) and in the marker objects (M). Fluorescence intensities in the two thoracic mammary glands and in the external marker objects (M) are depicted in E. Fluorescence data were gated to the lifetime interval of 1.5 to 2.0 ns. F illustrates the fusion result. Fluorescence intensity findings are successfully registered to the inclusions of the iodine-containing contrast agent in the fpVCT data set.


with oi ε O'CT
Initial Transformation and Calculation of Point-to-Point References
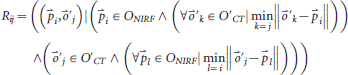
To calculate the transformation between the landmark sets, it was necessary to first estimate which point of one set corresponded to which one of the other set. These so-called point-to-point references, Rij, characterized the relationship between two points, oj O'CT and
pi ONIRF. For these points, it was imperative that pi was the nearest point to oj out of all points of the set ONIRF and that oj was the nearest point to pi out of all points of the set O'CT after optimal transformation (equation 4). To build up these references, a good initial transformation from one landmark set space into the other was essential, so that the nearest point to a transformed landmark was the real corresponding landmark. Equation 4 also includes the possibility of using landmark sets O’ CT and ONIRF with unequal cardinal values. Such an inequality of landmark counts might be the result of covering a marker in the eXplore optix by the studied object or the result of an insufficient automated marker calculation: point-to-point references:
With our multimodality bed in combination with a standardized examination procedure, we clearly determined the base orientations in both modalities (Figure 4, A and B). Thus, we calculated the initial transformation by application of a principal axis transformation to both marker sets.
Calculation of Real Transformation
The number of point-to-point references required to estimate the transformation and the impact of falsely built references depends on which kind of transformation scheme is actually used. In general, these problems cannot easily be solved. We regularly applied thin plate spline interpolation, 25 an algorithm in which one landmark set was warped to fit exactly to the other set. Such an interpolation approach is canonically the method of choice in this kind of application because it is known that the marker objects in both modalities are situated exactly at the same position and their centers are easily detectable. Additionally, the omission of a rigid body model reduced the number of needed point-to-point references. However, more built references increased fusion accuracy. The bottle neck was that false references that would result in strong image distortions had to be strictly avoided. In the case of image distortions, estimation of the transformation was repeated after manual exclusion of false references. Finally, the fusion process resulted in successful colocalization of optical image data sets to anatomic sites (Figure 4C).
Validation of the Fusion Process
To validate the accuracy of the fusion algorithm, a mixture of Isovist 300, Cy5.5, and Matrigel, to reduce leakage into the surrounding tissue, was injected into the mammary glands of two SCID mice. These mice were imaged following the same protocols used for the two tumor models. Owing to the strong x-ray attenuation of the implanted iodine-containing contrast agent, the injected probe is clearly visible within the mammary glands in the fpVCT data sets (example of one mouse in Figure 4D). The fluorescence intensity of the probe is also detected as inclusions in the thoracic mammary glands by eXplore optix (Figure 4E). After the fusion process, we obtained, as shown in Figure 4F, exact colocalization of both contrast agents, evident by displaying the x-ray attenuation and the fluorescence intensity of the probe at the same position within both mammary glands. These results demonstrate the accuracy of the presented algorithm.
Display of Fused Data Sets
The average plane through the 3D CT landmark set was represented as a 2D grid. The “warped” 2D data of the eXplore optix measurement was applied as a texture to this grid and rendered in the same scene like the CT data. An additional ramp function was applied to the texture to set the transparency against the measured fluorescence intensity. Regions with no data were set to full transparency, so CT structures behind these areas were completely visible (Figure 4C, Figure 5, A and E, and Figure 6, A and C).
Evaluation of Fusion Results
The fused images of the NIRF and CT data sets of eight mice successfully coregistered fluorescence signals from Cy5.5-labeled antibodies to anatomic sites corresponding to tumors that developed within the head of the pancreas and expanded between the duodenum and the stomach (see Figure 5, A and E). Exemplary results of two mice with pancreatic tumors are shown in Figure 5. In contrast to the mammary carcinoma, a pancreatic tumor is not visible from outside the mice and cannot be visualized by fpVCT owing to low uptake of iodine by the tumor (see Figure 2B, Figure 4A, and Figure 5, A and E). Only the location of the stomach and the small intestine can be monitored by highlighting the gastrointestinal tract with oral iodine-containing contrast agent.
Figure 5, A and E, demonstrates exemplarily in two mice that the strongest fluorescence signal after lifetime gating is coregistered to regions where pancreatic tumors and metastasis developed. Furthermore, tumor cells adjacent to the stomach are displayed by fluorescence intensity signals over the area of the body of the stomach (see Figure 5A). Strong matriptase-derived fluorescence was detected over areas where primary pancreatic tumors developed and in metastases only in mice that received MT-Ab*Cy5.5 but not in the control prescan, not in tumor-free mice injected with MT-Ab*Cy5.5, or in the AsPC-1 tumor-bearing mice injected only with Cy5.5 fluorophore 24 hours before scanning (data not shown).

Pancreatic tumor model volume rendering of the fused data sets and comparison with section images. A and E illustrate representative fusion results of two nude mice each bearing an orthotopic pancreatic carcinoma that developed 7 weeks after cell implantation (n = 8). A, Fusion results for the abdominal region of a mouse with a pancreatic carcinoma are depicted as a textured, semitransparent plane within the volume rendering context of the fpVCT; note that the data display the intensity of fluorescence after lifetime gating to 1.5 to 2.0 ns. B, An autopsy image of the whole mouse shows that the pancreatic tumor extended between the lower part of the stomach body, the pylorus, and the duodenum and developed dorsal to the liver. C and D, The excised pancreatic tumor is seen in immediate proximity to the stomach and proximal part of the duodenum from a ventral and a dorsal view, respectively. The massive fluorescence signal in A clearly corresponds to the anatomic position of the main pancreatic tumor (PC) in B, C, and D. Additional signals located directly over the stomach correlate well with the expansion of the tumor along the stomach wall, depicted by S in A and C. E, Fusion results of a second example demonstrate two regions with high fluorescence intensity corresponding to an area over the scar (SC) and the pancreatic region (PC). F, Macroscopic appearance during autopsy confirmed colocalization of the fluorescence intensity signal to a tumor nodule within the scar (SC; green outlines) and (G) to the primary pancreatic carcinoma (PC; red outlines) located between the stomach and duodenum.
The binding specificity of the MT-Ab directed against the membrane-bound matriptase was confirmed by in vitro analyses. In lysates of AsPC-1 cells but not in MDA-MB-231 cells, known to be negative for matriptase expression, 26 a strong protein band of approximately 95 kDa, corresponding to the predicted size of the full-length matriptase protein, 27 was depicted by Western blot analyses (data not shown). These findings are in accordance with the results obtained by immunocyto-chemistry using MT-Ab. Positive membrane staining was detected in AsPC-1 cells but not in MDA-MB-231 cells (data not shown).
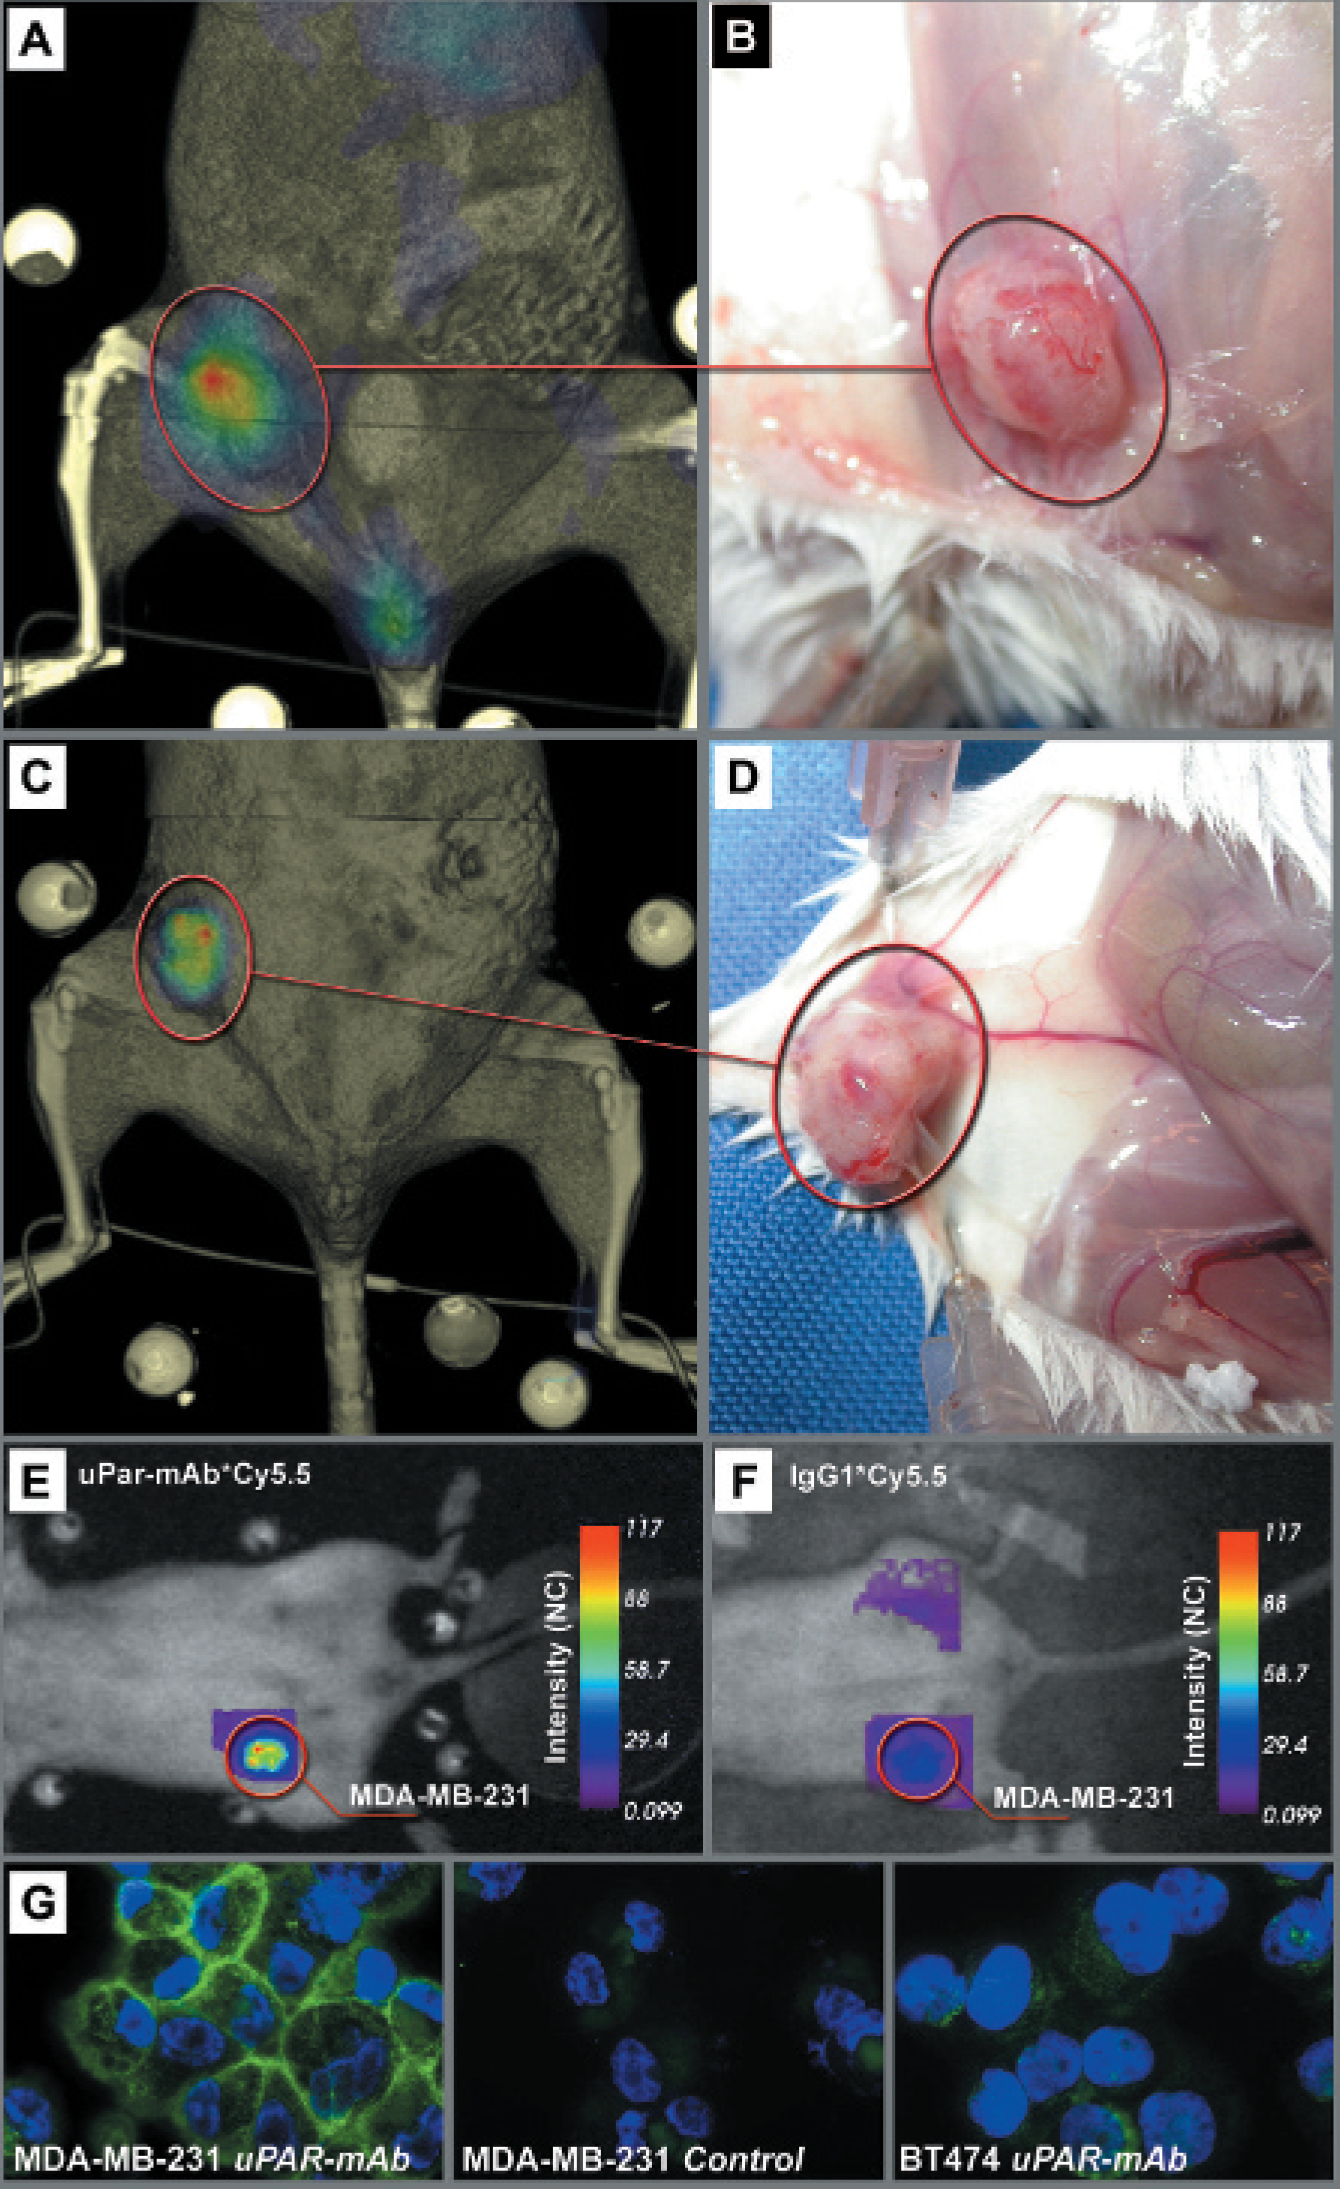
Mammary carcinoma model volume rendering of the fused data sets, comparison with section images, and validation of fluorescence probe specificity. A and C illustrate representative fusion results of two SCID mice each bearing an orthotopic mammary carcinoma that developed 4 weeks after cell implantation (n = 6). Fluorescence intensity maps of these mice obtained 24 hours (A) and 48 hours (C) after injection of 50 μg uPAR-mAb*Cy5.5 and gated to a lifetime range of 1.5 to 2.0 ns are fused with fpVCT data sets acquired 28 seconds after intravenous injection of 150 μL Isovist 300. B and D, Corresponding photographs of the mammary carcinomas in situ demonstrate in both mice tumor growth in the fourth mammary complex and thereby confirm exact overlay of the fluorescence intensity maps with the CT-based visualizations of the tumors. E and F, Fluoresence intensity maps of mammary carcinoma–bearing SCID mice, both normalized to the same imaging conditions. E shows high fluorescence intensity in the tumor (red circle) of the same animal presented in the fusion image (C), 48 hours after injection of 50 μ guPAR-mAb*Cy5.5. F demonstrates a control mouse imaged 48 hours after injection of the isotype control, 50 μg IgG1*Cy5.5. Note that in F, no fluorescence was detected over the tumor area (red circle). G, Stained cytospins from MDA-MB-231 and BT474 mammary carcinoma cells using uPAR-mAb as a primary antibody and *Alexa-Fluor 488 goat-antimouse as a secondary antibody are displayed. A clear membrane staining, as described for the uPAR antibody, was observed only on the surface of MDA-MB-231 cells (left panel) in comparison with BT474 cells (rightpanel). As a control, only the secondary antibody was applied to MDA-MB-231 cells (middle panel). Nuclei were stained with DAPI.
In situ inspection during dissections confirmed the predicted anatomic site of the pancreatic tumor. The pancreatic tumor developed in the head of the pancreas and was located adjacent to the stomach and duodenum (see Figure 5, B to D). Histologic examination confirmed the proximity of pancreatic tumor cells to the stomach and duodenum and demonstrated that pancreatic tumor cells already invaded the muscular coat of the stomach (data not shown). Locations of fluorescence correlated well not only with anatomic sites, where primary tumors developed (see Figure 5, E and G), but also with a pancreatic tumor nodule (see Figure 5E) that emerged at the scar, as shown byautopsy in Figure 5F. Similar results of specific fluorescence intensity patterns were obtained in eight mice.
Furthermore, the algorithm was successfully applied to six mice with mammary carcinoma (see Figure 6, A and C). Mammary carcinomas were already detected by inspection of mice, whereas precise tumor shape and volume were visualized by the fpVCT scan owing to the strong iodine uptake of these breast tumors (data not shown). Here, image fusion resulted in the correlation of fluorescence signals from uPAR-mAb*Cy5.5 to tumors that developed in the mammary glands (examples of two mice in Figure 6A to D). Macroscopic and histologic analysis during autopsies confirmed in six mice that all tumors developed in the right fourth mammary complex (see Figure 6, B and D; histologic data not shown). In comparison with the specific fluorescence intensity signals over the mammary carcinoma in mice that received uPAR-mAb*Cy5.5 (see Figure 6E), fluorescence was not detectable in MDA-MB-231 tumor-bearing mice injected with IgG1*Cy5.5 isotype control (n = 2; example of one mouse in Figure 6F).
To analyze the binding specificity of the monoclonal antibody against uPAR, we performed immunocytochemistry on uPAR-positive MDA-MB-231 cells and compared the results with in vitro studies of uPAR-negative BT474 cells.20 The antibody against uPAR clearly stained plasma membranes of only MDA-MB-231 cells (Figure 6G), altogether showing that MDA-MB-231 cells, in contrast to BT474 cells, express uPAR and are therefore in combination with uPAR mAb suitable to be used for antibody binding studies in vivo.
Discussion
The combination of noninvasive techniques for imaging small animals is of primary importance in monitoring biologic processes in vivo. One such useful combination involves high-resolution CT technology, which can image the skeleton, blood vessels, organs, and tumors, 14 as well as optical imaging, which can image functional data with high sensitivity.3–6,28–32 In this study, we demonstrated that the use of a simplified, efficient, and semiautomated “software” approach enables the fusion of 2D functional data sets obtained by NIRF reflection imaging into 3D volume representations of fpVCT data sets.
We showed the successful coregistration of signals of a Cy5.5-labeled antibody directed against matriptase to sites where orthotopically implanted pancreatic tumors developed as well as of a Cy5.5-labeled antibody directed against uPAR to mammary carcinomas in living mice. Specific binding of the uPAR antibody to MDA-MB-231 cells as well as of the matriptase antibody to AsPC-1 cells was demonstrated in vitro by clear positive membrane staining of the tumor cells. High expression of uPAR in MDA-MB-231 cells has also been reported by others. 20 Binding of fluorescently labeled antibodies to these tumors was monitored in vivo by the time-domain optical imager and provided 2D information, showing the intensity and lifetime of fluorescent material in pseudocolor representation. However, animal tissue autofluorescence is a limiting factor for in vivo fluorescence imaging, resulting in most applications in poor signal to background ratios of 10:1 and lower. 28 To overcome this problem, mainly over areas of the spleen and/or gastrointestinal tract, we took advantage of the lifetime property of the fluorescent probes to clearly distinguish between signals from the labeled antibodies and autofluorescence. The result, that application of IgG1*Cy5.5 showed no fluorescence signals over the breast tumor, confirmed the specificity of the uPAR-mAb*Cy5.5 fluorescence probe in vivo.
Given that NIRF lacks any anatomic information, measured fluorescence intensity cannot be clearly localized to specific organs or tumor areas. Therefore, the image generated by fusing the NIRF data with an anatomic imaging technique is especially useful. In the current study, the mammary carcinoma could be visualized in isotropic high-resolution fpVCT 3D volume data sets, enabling the precise determination of the tumor's location and extension. Given that pancreatic tumors show no contrast agent uptake, they were indirectly visualized by enhancement of the surrounding tissues. This was achieved by enhancing the contrast in the gastrointestinal tract, especially in the stomach and duodenum, anatomic structures adjacent to the pancreatic tumor. The precise location and extension of tumors were confirmed by macroscopic examination during autopsy and by histologic observations.
Fusing NIRF images with fpVCT data is based on the use of fiducial markers filled with a mixture of contrast agent and fluorescent dye. We chose this landmark-driven approach since image contents in both modalities are independent from each other. Given that homogeneous structures have a different appearance in one imaging modality when compared with the other, unsupervised registration algorithms with cost functions such as mutual information could not be applied.16,17 Because pancreatic tumors cannot be visualized by CT technology, strategies using CT data sets as a priori information to improve the NIRF findings could not be applied in this study. Furthermore, camera images show distortions for non-planar objects and undergo a different optical pathway in comparison with measured fluorescence data. Therefore, these data sets are independent from each other. Consequently, an approach based on fiducial markers for the camera image by the eXplore optix would have introduced inaccuracy to the fusion process.
One disadvantage of most available NIRF measurement devices is that the data obtained are only 2D, as in our study. Thus, the results very much depend on the positioning of the animal. Furthermore, shadowing effects by organs such as the stomach or liver, with high autofluorescence or absorption, can result in nonmeasurable signals, so multiple acquisitions with different animal orientations might be necessary. Additionally, the fact that marker objects on the animal bed and structures of interest within the mouse are not coplanarly located resulted in aberration in the optical imaging process and introduced unavoidable warping in the measured images. Therefore, nonlinear interpolation, such as thin-plate spline interpolation algorithm, was applied here instead of simple linear interpolation. The novel technique of NIRF tomographic imaging might overcome these problems in the future and will create 3D data sets that could be more easily fused with, for example, CT and MRI.9,33,34 Owing to the strong scattering and absorption in the NIR range, this technique presently yields in relatively poor images compared with other 3D imaging techniques, such as MRI, CT, and 3D US.
In the future, the necessity of a landmark-based approach could possibly be overcome by using combined probes for NIRF and CT, which are currently under development. Combined contrast agents already exist for MRI and NIRF imaging. 35 These probes will increase the accuracy of the fusion results. Simultaneous contrast of the same regions by different imaging devices will fulfill the needed requirement for automated registration approaches based on optimization of global cost functions.16,17 To avoid the whole registration process, in some cases both functional and morphologic imaging techniques can be combined in one device, so the data sets are acquired in the same coordinate system. Combined imaging devices such as PET-CT and SPECT-CT are already clinical established and are playing an increasingly important role in the diagnosis and staging of human disease.36,37 Prototypes of other combinations, such as PET-MRI, have already been developed. Therefore, by the advancement in tomographic NIRF imaging, a combination of NIRF and CT seems to be realizable in the near future.
In summary, we introduced a novel approach to fuse 3D fpVCT data with 2D maps generated by NIRF imaging, by a method that is easy to use and nearly fully automated. Fluorescence signals from Cy5.5-labeled antibodies were successfully coregistered with anatomic and pathologic structures, such as mammary tumors and parts of the gastrointestinal tract adjacent to the pancreatic tumors. This method provided a way to register and relate all of the imaging data in a single context. Owing to the specificities of our imaging devices, the introduced approach is in principle applicable to only a combination of NIRF reflection imaging and 3D morphologic imaging, such as MRI and CT. Therefore, the algorithm might not easily be adapted to other combinations of imaging techniques. Taken together, combined fpVCT and NIRF imaging in preclinical studies might in the future lead to better understanding and management of cancer targeted therapies before entering the clinic.
Footnotes
Acknowledgments
Financial disclosure of authors: This work was supported by a grant from the Deutsche Forschungsgemeinschaft (DFG), Sonderforschungsbereich (SFB) 416, to F. Alves and L.F. Tietze and by a grant from the DFG (AL336/5-1) within the Schwerpunktprogramm 1190 (SPP1190).
We would also like to acknowledge the veterinarian Dr. Sarah Kimmina for her support and Johanna Widera, Sarah Greco, Kristin Hammer, Tomasz Karykowski, Karin Stapp-Kurz, and Birgit Grübbeling for excellent technical assistance.
Financial disclosure of reviewers: None reported.