
Abstract
Molecularly targeted gold nanorods were investigated for applications in both diagnostic imaging and disease treatment with cellular resolution. The nanorods were tested in two genetically engineered cell lines derived from the human colon carcinoma HCT-116, a model for studying ligand-receptor interactions. One of these lines was modified to express delta opioid receptor (δOR) and green fluorescent protein, whereas the other was receptor free and expressed a red fluorescent protein, to serve as the control. Deltorphin, a high-affinity ligand for δOR, was stably attached to the gold nanorods through a thiol-terminated linker. In a mixed population of cells, we demonstrated selective imaging and destruction of receptor-expressing cells while sparing those cells that did not express the receptor. The molecularly targeted nanorods can be used as an in vitro ligand-binding and cytotoxic treatment assay platform and could potentially be applied in vivo for diagnostic and therapeutic purposes with endoscopic technology.
DISCOVERIES OF MOLECULAR CELL-SURFACE MARKERS associated with cancer and other diseases such as atherosclerosis or chronic pain will enable development of targeted technologies for early detection and minimally invasive intervention. One avenue to increase the utility of such technologies in the clinic consists of targeting specific disease markers with agents that can be both imaged and act as mediators for therapeutic treatment.1–6 Plasmon-resonant nanoparticles with a biologically functionalized surface integrate biologic and optical functions, providing both diagnostic optical imaging and photothermal treatment capabilities.7–9 Furthermore, control of the size, shape, and composition of the particles can result in the tunability of their optical and thermal properties. These properties can be optimized for biomedical applications of optical imaging, in particular tuned for the near-infrared (NIR) tissue transparency window.10–15 Gold nanorods have unique properties as they exhibit two-photon excited luminescence in confocal microscopy systems 16 and efficiently convert absorbed photons to heat. Laser-irradiated gold nanorods can selectively kill cancer cells through a photothermal process,7,17,18 and theoretical calculations have predicted the importance of a pulsed laser source for effective heating.19,20 However, the capability of specifically targeting nanorods to selectively visualize and treat targeted cells in a mixed cell population, closely representing the actual challenge of medical intervention, has not yet been fully investigated.
In this study, we engineered a colon cancer cell line to either express green fluorescent protein and the δ-opioid receptor (GFP-δOR+), or to express a red fluorescence protein without the δOR (dsRed-δOR−). These engineered cells represent a controlled pattern of receptor expression for testing new diagnostic and therapeutic modalities based on recognition of epitopes expressed on the cell surface. Additionally, the δOR system itself holds immediate clinical importance in chronic pain management 21 and has also been linked to invasive and motile stimulation of cancer. 22 Mixed cell populations were incubated with δOR-targeted gold nanorods and imaged in a confocal microscope, where the anti-Stokes luminescence of gold nanorods, as well as green and red fluorescence of markers, was imaged to test for specific receptor binding. Subsequently, cells with bound nanorods were photothermally destroyed with the same laser used for imaging.
Materials and Methods
Cell Lines
HCT-116 colon cancer cells were transfected with specific gene vectors to yield receptor-positive cells, GFP-δOR+, and receptor-negative cells, dsRed-δOR−. Briefly, a truncated δOR complementary deoxyribonucleic acid (cDNA) lacking the final 15 C-terminal amino acids was polymerase chain reaction (PCR) amplified using a pcDNA3.1-δOR vector containing the full-length δOR cDNA as a template. The following primers with adapters containing Afl II and Xba I restriction enzyme sites were used in PCR for δOR (accession number U07882); sense, 5′-CTTAAGCACCATGGAACCGGCC-3′; antisense, 5′-TCTAGAGGTGA CACGC TCGC-3′. The PCR product was digested with both Afl II and XbaI and cloned into a pcDNA3.1 (+) vector to generate a new vector, pcDNA-δOR15. One line of HCT-116 colon cells was stably transfected with this vector and a pcDNA3 vector containing a green fluorescent protein gene (Invitrogen, Carlsbad, CA) to yield GFP-δOR+ cells, whereas another line of HCT-116 colon cancer cells was stably transfected with pDsRed1-N1 vector (Clontech, Mountain View, CA) containing a red fluorescent protein gene to yield dsRed-δOR− cells. Green and red fluorescence were visualized using a Zeiss LSM 510 microscope, with 488 nm excitation and 500 to 530 nm emission and 543 nm excitation and 560 to 600 nm emission wavelengths for the green and red channels, respectively.
Synthesis
Ligands were synthesized using TentaGel R-NH2 resin (Rapp Polymere, Germany), and all Fmoc-protected amino acids were purchased from Novabiochem (San Diego, CA). All additional chemicals were purchased from Sigma-Aldrich (St. Louis, MO). The synthesis was accomplished as shown in Scheme 1 and described elsewhere. 23 Briefly, after completion c[D-Pen2, L-Cys5] enkephalin (DPLCE)-Lys(Aloc) and deltorphin-Lys(Aloc) sequences (N-terminus protected with Boc), the resin was incubated Pd(0) to remove Aloc from side chains of lysine. Resin-bound DPLCE was acetylated with preformed 0.5 M hydroxy-1H-benzotriazole (HOBt) ester of diethylenetriaminepentaacetic acid (DTPA). Deltorphin was treated with Fmoc-PEG5000-OH and then with tritylmercaptopropionic acid. The ligands were cleaved from the resin together with protecting groups by the trifluoroacetic acid (TFA)-scavenger cocktail. The linear DTPA-DPLCE was cyclized under high dilution by air oxidation and then labeled with Eu(III) chloride in neutral pH buffer. Purification of ligands was achieved using a Waters 600 high-performance liquid chromatography (HPLC) instrument with a reverse-phase column (Vydac C-18, 15–20 μm, 22 × 250 mm). The purity of the products was checked by thin-layer chromatography and analytic HPLC, electrospray ionization (ESI) (Finnigan, Thermoquest LCQ ion trap instrument) or matrix-assisted laser desorption/ionization time-of-flight (MALDI-TOF) mass spectrometry.

Solid-phase synthesis of deltorphin II-PEG5000-thiol: (a) piperidine in N,N′-dimethylformamide (DMF); (b) Fmoc-Lys(Aloc)-OH, 1-hydroxy-1H-benzotriazole (HOBt), N,N′-diisopropylcarbodiimide, piperidine in DMF; (c) solid phase synthesis cycle; Fmoc-aminoacid coupling (HOBt ester) or (1H-benzotriazol-1-yloxy)bis dimethylaminomethyliumhexafluorophosphate (HBTU), Boc(Tyr(tBu)-OH in the last cycle), piperidine in DMF; (d) Lys-ε-Aloc deprotection: Pd(0), N-methylbarbituric acid in dichloromethane, followed by Fmoc-NHPEG5000-COOH, HBTU, lutidine, piperidine in DMF; (e) S-trityl-3-mercaptopriopionic acid, HBTU, lutidine; (f) trifluoroacetic acid (TFA) scavenger cocktail.
Binding Assays
Binding assays were performed on GFP-δOR+ cells as described previously. 23 Briefly, increasing concentrations of the ligands were assayed for their ability to compete for binding with a Eu-labeled ligand, Eu-DTPA-DPLCE. These were performed in the presence and absence of the competitive binding inhibitor naloxone to differentiate nonspecific and specific binding, respectively. The amount of Eu-DTPA-DPLCE bound was detected with time-resolved luminescence using a Wallac Victor 3 multiwell plate reader.
To test successful transfection of the gene vectors, 1-point and competitive lanthanide binding assays were performed on the engineered GFP-δOR+ cells, and 10 nM Eu-DPTA-DPLCE was added to GFP-δOR+ cells to determine total binding. Nonspecific binding was tested in the presence of 10 μM naloxone. The results of 1-point binding curves (Figure 1A) show that the total binding was 15,814 ± 1,293 au, whereas nonspecific binding was 1,115 ± 199 au. Hence, δOR specific binding was 93% of total binding, indicating the high surface expression of δOR in this transfected cell line. Subsequently, Eu-DPTA-DPLCE was investigated in competitive binding assays. Increased amounts of naloxone effectively displaced the Eu-DPTA-DPLCE with an inhibitory concentration (IC)50 of 398 nM and an R2 of .96 (Figure 1B).

Binding characteristics of GFP-δOR+ cells. A, Binding of Eu-DTPA-DPLCE to GFP-δOR+ cells. Black bar represents total binding; gray bar represents nonspecific binding (n = 4 for each). B, Competitive binding assay using Eu-DTPA-DPLCE binding to GFP-δOR+ cells. Naloxone was competed with 10 nM Eu-DTPA-DPLCE (IC50 = 398 nM and R2 = .96). Each data point represents the average of four samples.
Preparation of Gold Nanorods
Hexadecyltrimethylammonium bromide (CTAB)-coated gold nanorods were synthesized using published techniques. 24 Briefly, gold seeds were obtained by reduction of 20 mL of 125 mM HAuCl4 with 300 μL of ice-cold solution of 10 mM borohydride. Nanorods were then grown by adding 35 μL of this seed suspension to 9 mL aqueous solution containing 125 μM HAuCl4 and 8 mM CTAB, in the presence of 25 μL of 100 mM ascorbic acid. All solutions were prepared in water. This preparation was described and characterized by transmission electron microscopy and extinction spectra earlier 15 and yields nanorods with a diameter of 20 nm and an approximate length of 60 nm. Both rods and spheres were evident in transmission electron microscopy micrographs. Two optical extinction peaks were present, corresponding to the well-characterized transverse (≈530 nm) and tunable longitudinal plasmon resonances, 25 the latter with optical density of 0.592 at 757 nm determined in a 1 cm pathlength cuvette. Suspensions with longitudinal resonances in the NIR range, between 750 and 820 nm, were used in subsequent microscopy experiments because of the overlap with the titanium:sapphire (Ti:sapphire) laser optimal tuning range.
Ligand Coating
As the ligand for the δOR, we chose a modified deltorphin peptide, H-Tyr-DAla-Phe-Glu-Val-Val-Gly-Lys-(PEG5000-SH)-NH2, where the thiol group on the polyethylene glycol (PEG) mediated attachment to the gold nanorods. Deltorphin has proven strong binding affinity to the human δOR.26,27 Lyophilized deltorphin-PEG-SH was dissolved in 0.5% acetic acid solution in water, yielding a stock ligand concentration of 2.3 mg/mL. For attachment of ligands, the as-prepared suspension of nanorods was first centrifuged at 15,000g for 10 minutes, supernatant was removed, and the pellet was resuspended in the remaining 100 μL of liquid, yielding a dark purple suspension. Then 100 μL of the deltorphin solution was mixed with the nanorod suspension and the mixture was further diluted by adding 5 mL of 0.5% acetic acid in water. This suspension was centrifuged at 2,500g for 20 minutes, and the supernatant was removed, leaving a final volume of 100 μL for resuspension of the deltorphin-coated rods. As an untargeted control, gold nanorods were coated with PEG5000-SH in the same manner. As a result of the ligand coating process, the final nanorod preparations were concentrated approximately 100 times or to equivalent of 12.5 mM of gold.
Imaging and Photothermal Therapy
In all imaging and treatment experiments, imaging was performed using an upright Zeiss LSM 510 NLO system (Carl Zeiss) coupled with a Ti:sapphire (Mira 900, Coherent), argon (488 nm), green helium-neon (543 nm) laser and a 40× 1.3 NA oil immersion objective (Carl Zeiss). The Ti:sapphire laser was operated in mode-locked configuration at the wavelength corresponding to the peak longitudinal resonance of the nanorods generating 100 fs pulse trains at 80 MHz. Luminescence data were collected over a broad wavelength range (400–650 nm) with the LSM 510 spectral detector. Confocal images of GFP and dsRed were simultaneously obtained with 488 nm argon laser excitation and 543 nm helium-neon laser excitation, respectively. Transmission cell culture images were also simultaneously collected during nanorod imaging with a high numeric aperture condenser and transmission photomultiplier tube. For imaging, the laser was operated below 1 mW average power (low power). For nanorod-mediated laser treatment (photothermal destruction of cells), the laser power was increased to greater than 10 mW average power (high power), and selected regions of the sample were scanned with the laser. Laser power was monitored at the back aperture of the microscope objective lens.
Results
Phantom Studies
The irradiation conditions described above were applied first to gold nanorods without cells. A simple tissue phantom was created using a 0.5 mm thick sheet of polyacrylamide that included polystyrene spheres to mimic tissue scattering, μs = 100 cm−1, and scattering anisotropy, g = 0.9. The properties of this and similar tissue phantoms were recently reviewed. 28 Thirty microliters of gold nanorod suspension was uniformly spread across a small portion of the surface of the gel and covered with a coverslip. With a low incident power of the Ti:sapphire laser and the incident wavelength 800 nm tuned to the longitudinal plasmon of the nanorod suspension, we observed a broad luminescence emission spectrum, between 400 and 650 nm, with two intensity peaks located at 500 and 625 nm (data obtained with spectral multichannel detector, not shown). This emission was not observed in the tissue phantom alone in the absence of gold nanorods. The observed anti-Stokes shift suggested a multiphoton excitation process, as reported by others.16,17 We observed dramatic changes to both the nanorod signal and the tissue phantom on the increase of incident power above 10 mW. The anti-Stokes luminescence disappeared, most likely owing to thermal damage to the nanorods. 29 This loss of luminescence was accompanied by substantial morphologic changes to the tissue phantom, which were not observed with the same laser power in control phantoms without nanorods. At this high-power setting, significant bubble formation was observed in areas with nanorods, whereas no alteration or bubble formation was observed in areas without gold nanorods. We hypothesized that the thermal damage was governed by the pixel dwell time (in all tests 6.4 μs) as no plasma or shockwaves were observed. The crater-shaped damage was confined to the area defined by the high-power scanning beam of the Ti-sapphire laser and extended approximately 20 μm in both axial and lateral directions (Figure 2).
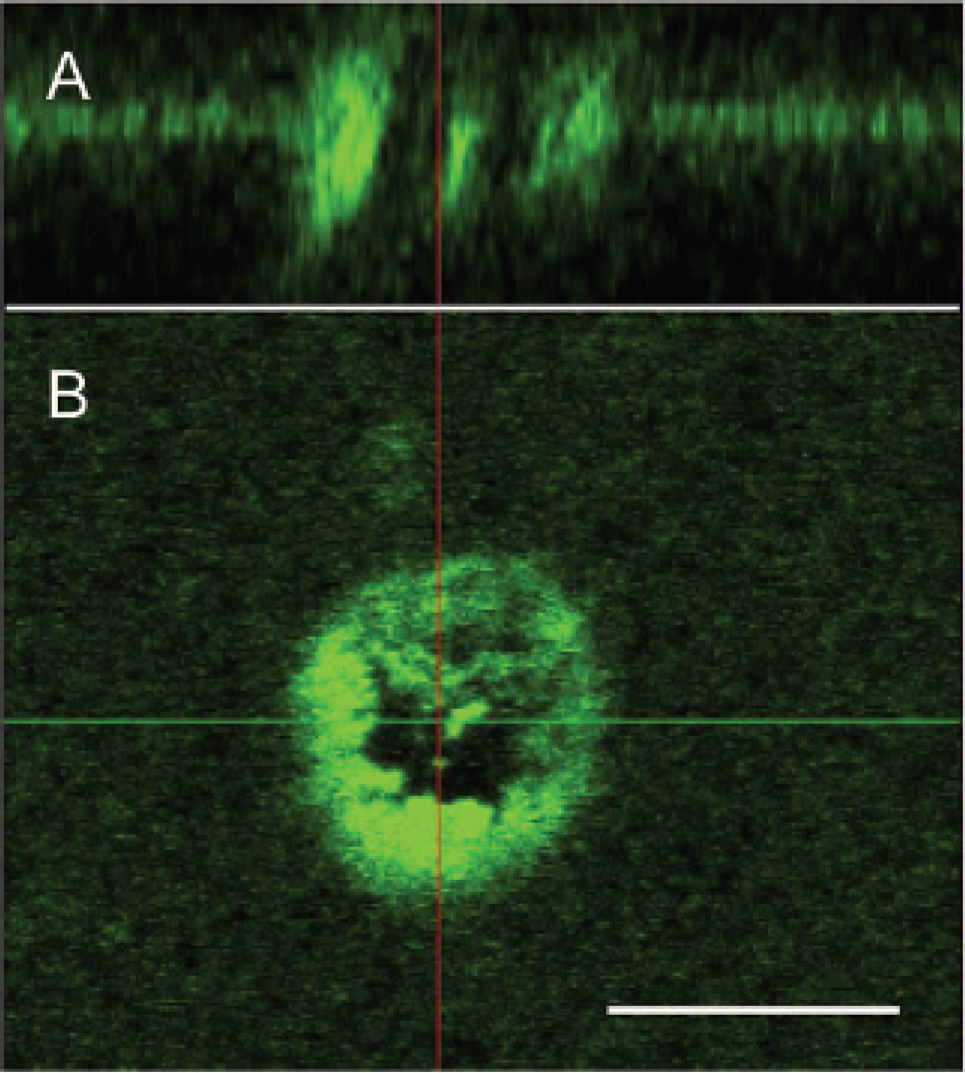
Anti-Stokes luminescence image (emission between 400 and 650 nm) of a gold nanorod-coated tissue phantom, with a 5 × 5 μm spot irradiated with 80 mW Ti:sapphire laser operating at 800 nm. Top panel: Axial projection of the luminescence signal with the layer corresponding to the nanorods on the surface of the tissue phantom. Bottom panel: Lateral slice of luminescence. The scale bar represents 20 μm.
Cell Imaging
For experiments with cells, GFP-δOR+ and dsRed-δOR−, engineered cells were grown on 5 cm round coverslips to confluence in Dulbecco's Modified Eagle's Medium with 10% fetal bovine serum. Prior to imaging, 30 μL of the deltorphin- or PEG-only functionalized nanorod suspension was added to the cells and incubated for 2 hours at 37°C. Following incubation, the coverslip was rinsed twice and placed in the closed perfusion chamber (Bioptechs) attached to the microscope. GFP-δOR+ cells incubated with the deltorphin nanorods exhibited nanorod luminescence heterogeneously distributed on the cellular membranes (Figure 3A). In some cases, we observed an almost complete coating of nanorod signal around individual GFP-δOR+ cells (Figure 3B). Conversely, dsRed-δOR− cells exhibited minimal or no visible nanorod binding (Figure 3C).

Images of green and red cells grown in a coculture treated with deltorphin-coated nanorods. A, Group of GFP-δOR+ cells (green) binding deltorphin functionalized nanorods that exhibit a bright (yellow) signal. B, Single GFP-δOR+ cell fully coated with deltorphin-functionalized nanorods. C, Group of dsRed-δOR− cells (red) with minimal deltorphin-functionalized nanorod binding. D, Following background signal removal in the nanorod emission channel, the total luminescence per cell was determined in independent cultures of δOR+ and δOR− cell colonies to estimate nanorod binding. δOR+ cells showed significantly more deltorphin-functionalized nanorod binding than δOR cells; *p = .0023, two-sample t-test, N = 6 δOR+ fields of view (858 cells), and N = 6 δOR− fields of view (349 cells).
To quantify gold nanorod binding to both the GFP-δOR+ and dsRed-δOR− cells, nanorod luminescence images (lateral resolution ≈0.5 μm) were processed using ad hoc algorithms written in Matlab (Mathworks). Cellular regions of interest were first selected manually so that only nanorods directly in contact with cells were counted. Next, the signal in the nanorod channel was thresholded at the intensity value in acellular regions to remove background signal from the high detector gain. Image stacks were then analyzed by integrating the number of luminescent pixels in selected cellular regions to calculate a total luminescence value in the field of view. After dividing by the number of cells in the analyzed region, this total luminescence value per cell, an average estimate of local bound nanorod concentration, was used to compare relative nanorod binding between the engineered cell lines. GFP-δOR+ cells showed significantly higher nanorod binding compared with dsRed-δOR− (Figure 3D, p = .0023, two-sample t-test).
Photothermal Therapy
To demonstrate the cellular resolution of molecularly targeted photothermal treatment, we cocultured GFP-δOR+ and dsRed-δOR− cells on coverslips and followed the incubation protocol previously described with the targeted deltorphin nanorods. Nanorod binding was observed by anti-Stokes luminescence in localized regions of cell cultures (Figure 4A, upper left). Nanorod-enhanced photothermal treatment was experimentally tested on these mixed cultures, which clearly showed gold-coated cells and uncoated controls. Based on the affinity of targeted nanorods to GFP-δOR+ cells previously shown (see Figure 3D), the nanorod-rich areas were assigned to be regions containing δOR+ cells.

Sequence of transmission images of a cocultured field of GFP-δOR+ and dsRed-δOR− cells in the presence of trypan blue prior to and following treatment with high power from the Ti:sapphire laser. A, Initially, few cells within the field of view stained with trypan blue (dark cells). Two regions were selected for laser treatment: a region with a high-functionalized gold nanorod presence (red box; yellow pixels represent nanorod emission) and a region with minimal nanorods (blue box). B, Nanorod emission was immediately abolished following laser treatment (4 passes, > 10 mW), and within 10 minutes, cells within the nanorod region exhibited increased trypan blue staining (red box), whereas no change was observed in the irradiated non-nanorod region (blue box). C, By 25 minutes, a majority of the cells within the nanorod region were stained with trypan blue, indicating major cellular disruption. D, A subsequent wash of the system further confirmed cellular damage in the nanorod region as the affected cells were easily removed from the coverslip.
Following imaging of nanorod emission at low laser power, regions were selected that contained either a high density of nanorods or control regions without nanorod emission, for selective treatment with high laser power (see Figure 4A). As a marker for cellular viability, 0.5% trypan blue, a dye not penetrating the cytoplasm of viable cells, was added into the perfusion chamber prior to treatment. The majority of cells within the field of view were not stained with trypan blue (see Figure 4A). The selected nanorod and control regions were then treated with four passes of high laser power. A loss of nanorod emission in the nanorod regions was immediately observed. Within 10 minutes of treatment, trypan blue had entered several cells in the nanorod regions without any observable changes to the control region (Figure 4B). By 25 minutes, the entire region initially containing nanorods had stained with trypan blue, whereas the control remained unchanged (Figure 4C). A subsequent medium wash across the cells resulted in complete removal of the stained cells from the coverslip, further suggesting major cellular damage (Figure 4D). Notably, although not all of the cells within the nanorod-treated area exhibited nanorod binding, all of the cells within this region were damaged, likely owing to local heating effects from nearby areas of high nanorod density.
We then investigated whether nanorod-bound cells could be more specifically treated, without causing peripheral damage to adjacent cells. In principle, this would allow for treatment of diseased cells with minimal effects to normal, healthy tissue. Thus, we selected a region where an individual cell with high nanorod binding was adjacent to a cell showing minimal nanorod emission (Figure 5A). We treated this region with a single pass of high laser power and observed that the nanorod emission immediately disappeared (Figure 5B). As medium was perfused through the imaging chamber, the nanorod-binding cell was displaced and exhibited trypan staining, whereas the adjacent nanorod-negative cells remained intact and in place (Figure 5C). Thus, a single pass of increased laser power was sufficient to destroy nanorod-positive cells while sparing nanorod-negative cells. As above, four passes was shown to cause peripheral damage.

Simultaneous irradiation of two cells, one targeted with gold nanorods, with a single pass of high power of laser. A, A small region (red box) was selected containing a cell with a high concentration of bound functionalized gold nanorods (yellow) and a cell with minimal nanorod presence. B, Following minimal laser treatment (1 pass, > 10 mW), the nanorod emission signal was abolished and the cell with the bound nanorods (red arrow) exhibited dark nuclear condensation and membrane blebbing consistent with cellular damage. C, After several minutes, the nanorod-binding cell displaced from the coverslip (red arrow), whereas the cell with minimal initial nanorod binding remained unaffected.
Discussion
The ability to selectively destroy cells based on recognition of molecular epitopes expressed on the cell surface has many potential applications, varying from separation of multiple cellular phenotypes in cell cultures to medical interventions with cellular resolution. Cell lines were specifically designed and engineered to facilitate studies of such applications based on the model interaction of a delta opioid ligand with its receptor. This model system was used to investigate the successful integration of a dual modality, diagnostic and therapeutic, system using molecularly targeted gold nanorods. The results demonstrated the potential for selective destruction of targeted cells while sparing adjacent cells. Further advancement of the technique described here could result in high-resolution, localized treatment of cancer, improving the surgical outcome of the procedure. Examples of such applications include ovarian cancer in which multiple micrometastases embedded in normal tissue line the peritoneal cavity and early detection and treatment of colon cancer.
The University of North Carolina at Chapel Hill Department of Radiology
OPEN RANK – RESEARCH POSITION: The University of North Carolina at Chapel Hill, School of Medicine, Department of Radiology is seeking a full-time individual to manage the Small Animal Imaging Core Facility (SAICF). The SAICF includes 9.4T MR, SPECT, PET/CT and optical imaging. The candidate will be responsible for the day to day operation of the core facility. Principal functions include supporting the full range of operations; assisting SAICF users in image acquisition and analysis for a variety of projects; training individuals on the proper and responsible use of equipment, performing quality assurance testing and preventative maintenance of equipment; and troubleshooting equipment failures. Required qualifications include a Ph.D.; strong medical imaging experience; extensive engineering and physics background; demonstrated quantitative image analysis skills, familiarity with academic biomedical research; good interpersonal managerial skills, evidence of service orientation; and demonstrated ability to work independently. Applicants should send a curriculum vitae, a short statement of academic goals, and four letters of reference to: Weili Lin, Ph.D., Professor and Vice Chair for Basic Research, Department of Radiology, CB#7515, The University of North Carolina at Chapel Hill, NC 27599. The University of North Carolina at Chapel Hill is an Equal Opportunity/ADA Employer.