
Abstract
We investigated the effect of diet on abdominal autofluorescence detected by in vivo fluorescence imaging (FLI) of living mice. Groups of mice were fed a regular, alfalfa-free, or purified diet, and whole-body FLI was performed without the administration of fluorescent probes. In addition, quantum dots were injected intravenously into mice fed one of the three diets, and FLI was performed 3 and 24 hours later. Intense autofluorescence originating from the animals' intestinal contents was observed in mice fed the regular diet. Intestinal autofluorescence decreased substantially after feeding with the alfalfa-free diet and further after feeding with the purified diet. The decline was rapid and took only 1 to 2 days; however, it may have been affected by an intake of feces. The reticuloendothelial system was clearly delineated using a low dose of quantum dots in mice fed the purified diet. On the other hand, intestinal autofluorescence was visible 24 hours postinjection in mice given the alfalfa-free diet and definitely impaired the image quality in mice fed the regular diet. The use of a low-fluorescence diet, especially a purified diet, rapidly reduces intestinal autofluorescence and is expected to enhance the potential of in vivo FLI.
IN VIVO FLUORESCENCE IMAGING (FLI) allows the assessment of the whole-body distribution of fluorescent markers in living mice noninvasively and repeatedly. This technique has great versatility owing to the availability of various fluorescent probes. The applications of in vivo FLI include cell tracking, tumor imaging with fluorophore-tagged antibodies and peptides, sentinel lymph node mapping, and imaging of enzymatic activity. 1 Although scattering and absorption of light limit its penetration through tissue, light in the 600 to 900 nm wavelength range, that is, far-red and near-infrared (NIR) light, can travel relatively long distances in vivo and is suitable for external imaging. 2 FLI of intact animals is thus often performed in the far-red and NIR regions of the electromagnetic spectrum.
Fluorescence occurs even without the administration of exogenous fluorescent probes. Such fluorescence, called autofluorescence, generates background signals and can cause major problems in certain situations. Strong autofluorescence with a peak wavelength of about 680 nm has been observed in the abdomen of mice owing to chlorophyll and its metabolites in the intestine.3,4 Intestinal autofluorescence may mask the signal from fluorescent probes localized in or near the abdomen and may also mimic the excretion and/or accumulation of probes in the intestine.
Regular rodent diets generally contain large amounts of alfalfa and, therefore, chlorophyll. The chlorophyll content is less in an alfalfa-free diet. Mice fed alfalfa-free food for 1 to 2 weeks have shown reduced abdominal autofluorescence,5–7 and such a preparation was used in previous studies. Even with alfalfa-free food, however, intestinal autofluorescence remains more intense than autofluorescence of other organs. 8 A purified, synthetic diet that does not contain chlorophyll can also reduce autofluorescent signals in the intestine. 4 Since a relative comparison of abdominal autofluorescence using different diets has not been made in detail, we evaluated the intensity of autofluorescence in mice given a regular, alfalfa-free, or purified diet. The aim of this study was to compare the reduction in intestinal autofluorescence achieved with alfalfa-free and purified diets and to determine the duration of feeding with the diets required to reduce intestinal autofluorescence.
Materials and Methods
Animals
Female BALB/c nu/nu mice (8–12 weeks old) were obtained from SLC Japan (Hamamatsu, Japan) and handled according to the guidelines of the Institute of Medical Science, University of Tokyo. Three mice were housed in each cage and received pelleted food and water ad libitum. The bottoms of the cages were covered with wood shavings. All experimental procedures were approved by the Committee for Animal Research at our institution.
FLI Procedure
All imaging studies were performed using a cooled charge-coupled device (CCD) camera system (IVIS Imaging System 100, Xenogen, Alameda, CA) equipped with a fluorescence kit (XFO-6, Xenogen). Imaging was performed in the green, far-red, and NIR regions. An excitation filter of 445 to 490 nm passband and an emission filter of 515 to 575 nm passband (Xenogen) were used for green imaging, an excitation filter of 615 to 665 nm passband and an emission filter of 695 to 770 nm passband (Xenogen) were used for far-red imaging, and an excitation filter of 672.5 to 747.5 nm passband and an emission filter of 775 to 825 nm passband (Chroma Technology, Rockingham, VT) were used for NIR imaging. For image acquisition, the mice were anesthetized by isoflurane inhalation and placed in the light-tight chamber of the CCD camera system. The signal intensity was quantitated using Living Image software (version 2.50, Xenogen).
Mouse Food
A regular rodent diet (CA-1), an alfalfa-free version of the regular rodent diet (alfalfa-free CA-1), and a purified diet (Diet No. A10000) were supplied by CLEA Japan (Tokyo, Japan). The regular diet contains large amounts of alfalfa and, therefore, chlorophyll. The alfalfa-free version excludes only alfalfa and otherwise contains the same ingredients as the regular diet. The purified diet consists of milk casein (24.5%), cornstarch (45.5%), granulated sugar (10.0%), corn oil (6.0%), cellulose (5.0%), α-starch (1.0%), vitamin mix (1.0%), and mineral mix (7.0%). Six pellets of each diet were imaged by FLI in the green, far-red, and NIR regions. The imaging parameters were field of view (FOV) 25 cm, binning 2, and exposure time 1 second. A region of interest (ROI) was drawn within each pellet, and the mean signal intensity (photons per second per square centimeter per steradian, p/s/cm2/sr) was calculated.
Diet and Autofluorescence
Autofluorescence was assessed serially in living mice after substitution of the special diets for the regular diet (Figure 1). Ventral FLI images in the green, far-red, and NIR regions were acquired for mice given the regular diet (day 0 imaging) with no administration of fluorescent agents. The FOV was 25 cm, and binning was 4. The exposure time was 5 seconds for green imaging, 1 second for far-red imaging, and 10 seconds for NIR imaging. The three mice in each cage were imaged simultaneously. After imaging, the mice were moved to new cages and given a regular, alfalfa-free, or purified diet, and FLI was repeated 1, 2, 3, 4, and 5 days later. Nine mice were examined for each diet. After day 1 imaging, the cages were changed again. ROIs were set in the chest and abdomen on the images, and the mean signal intensities were calculated.

Flow chart of serial assessments of autofluorescence in mice. FLI = fluorescence imaging.
Similar experiments were performed with more frequent cage changes. Ventral FLI in the far-red and NIR regions was performed for mice fed the regular diet using the parameters described above. After the completion of day 0 imaging, the mice were placed in new cages and given the alfalfa-free or purified diet, and FLI was performed 1, 2, 3, 4, and 5 days later. Six mice were used for each diet. The cages were also changed 10 hours after the diet change and immediately after imaging on days 1, 2, 3, and 4. In addition, 18 fresh fecal samples were obtained from each group of mice on day 5 for imaging in the green, far-red, and NIR regions using the same parameters as for mouse imaging. An ROI was set for each fecal sample, and the maximum fluorescence for each was defined as fecal fluorescence. Maximum fluorescence was also determined for 18 fresh fecal samples obtained from six mice that received the regular diet.
The mice were imaged after 3 days of feeding with the special diets to confirm the effect of diet and cage change on intestinal autofluorescence. The mice that received the regular diet were placed in new cages and given an alfalfa-free or purified diet (n = 6 each) for 3 days without additional cage changes, and ventral far-red FLI was performed on one mouse at a time using the following parameters: FOV 20 cm, binning 4, and exposure time 10 seconds. Similar experiments were performed with additional cage changes 1 and 2 days after the diet change. For these experiments of 3-day preparation, the mean signal intensity of the chest ROI was subtracted from that of the abdominal ROI to calculate intestinal autofluorescence. Intestinal fluorescence was compared with and without additional cage changes.
Reticuloendothelial Imaging
The reticuloendothelial system, including the liver, spleen, bone marrow, and lymph nodes, can be visualized by in vivo FLI using quantum dots (QDs).8,9 We assessed the effect of diet on the quality of fluorescent reticuloendothelial imaging. Qdot 800 ITK amino (PEG) quantum dots (amino-PEG-QDs) (Invitrogen, Carlsbad, CA) with an emission peak of 800 nm were used without conjugation to targeting ligands. Six mice were injected with 1 pmol/g amino-PEG-QDs (5 μL/g) via the tail vein. Two mice each were fed the alfalfa-free or purified diet for 3 days prior to injection, and their cages were changed daily. The remaining two mice were fed the regular diet. FLI in the ventral, right-lateral, dorsal, and left-lateral projections was performed in the NIR region 3 and 24 hours after QD injection using one mouse at a time. The FOV was 20 cm, and the binning was 4. The exposure time was 5 seconds for the ventral images acquired 3 hours postinjection and 10 seconds for the other images.
Results
Food Pellet Fluorescence
The fluorescence intensity of each type of food pellet is presented in Figure 2. Fluorescence in the green region was strongest for the purified diet, followed by the alfalfa-free and regular diets. In contrast, fluorescence in the far-red and NIR regions was strongest for the regular diet, weaker for the alfalfa-free diet, and weaker still for the purified diet.

Fluorescence of food pellets determined in the green (A), far-red (B), and near-infrared regions (C). Error bars indicate standard errors.
Diet and Autofluorescence in Mice
When mice were imaged in the green region, intestinal autofluorescence was not recognized visually and definite diet-dependent variations in abdominal signal intensities were not noted (Figure 3A). Strong fluorescence attributable to the urinary bladder, which weakened following urination, was observed in the pelvic region.
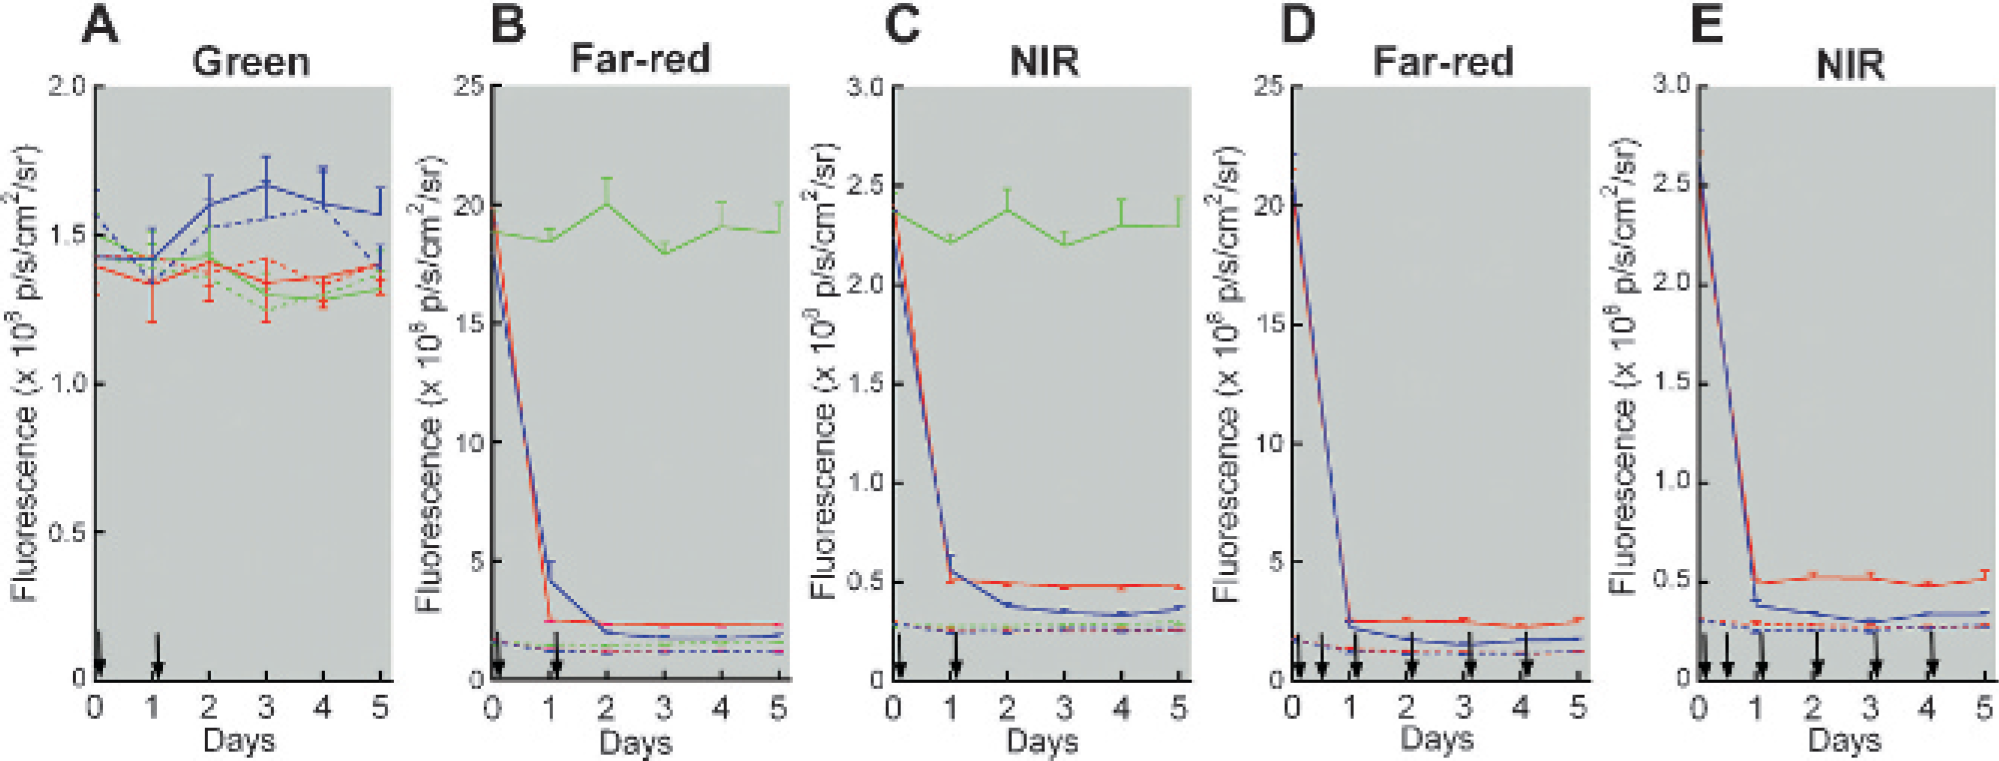
Time course of mean autofluorescence in the green (A), far-red (B, D), and near-infrared regions (C, E). All mice were given the regular diet first and after day 0 imaging were given the regular (green lines), alfalfa-free (red lines), or purified (blue lines) diet. The solid and broken lines represent fluorescence in the abdomen and chest, respectively. Error bars show standard errors. Arrows indicate the cage changes. The cages were changed frequently in D and E.
In contrast, strong intestinal autofluorescence was observed in the far-red and NIR regions for those mice that received the regular diet. When the cages were changed after imaging on days 0 and 1, abdominal fluorescence in the mice given the alfalfa-free diet dropped dramatically 1 day after the change in diet and was largely unchanged up to day 5 (Figure 3, B and C). In the mice fed the purified diet, abdominal fluorescence diminished on day 1 and further on day 2 to a level below that in the mice fed the alfalfa-free diet and remained constant thereafter. Chest fluorescence in the mice given the alfalfa-free and purified diets declined slightly on day 1 and subsequently remained constant.
Frequent cage change accelerated the reduction in abdominal autofluorescence seen in the mice fed the purified diet (Figure 3, D and E); in contrast, no effect was noted in the mice that received the alfalfa-free diet. Fecal fluorescence in the far-red and NIR regions was the strongest for the mice fed the regular diet, weaker for the mice fed the alfalfa-free diet, and still weaker for the mice fed the purified diet (Figure 4). In the green region, the greatest fluorescence was observed for the purified diet, followed by the alfalfa-free and regular diets.

Fluorescence of fresh feces determined in the green (A), far-red (B), and near-infrared (C) regions. Error bars indicate standard errors.
After 3 days of controlled feeding and daily cage changes, less intestinal autofluorescence was observed in the mice fed the purified diet than in those fed the alfalfa-free diet (Figure 5). However, for those mice whose cage was changed only at the time of the diet change, two of the six that received the purified diet showed relatively strong intestinal fluorescence, which was also evident on visual inspection of the images. The number of cage changes did not influence intestinal fluorescence in the mice fed the alfalfa-free diet.

Diet and intestinal autofluorescence, defined as the mean fluorescence in the abdomen minus that in the chest. Plots indicate data for individual mice. Mean and standard errors are also presented. Mice were given the indicated diet for 3 days. The cage was changed either at the time of the diet change (cage A) or daily (cage B).
Reticuloendothelial Imaging
The reticuloendothelial system was clearly visualized after the intravenous injection of 1 pmol/g amino-PEG-QD into the mice fed the purified diet (Figure 6). Preferential fluorescence owing to QD uptake was observed in the liver, spleen, bone marrow, and lymph nodes, and intestinal fluorescence was negligible 3 and 24 hours after injection. In the mice fed the alfalfa-free diet, although the reticuloendothelial system was clearly observed, faint intestinal fluorescence was observed at 3 hours. Because of gradual washout of the QDs, the intensity of intestinal fluorescence relative to the intensity of reticuloendothelial fluorescence became more evident after 24 hours. Intestinal fluorescence was most prominent on the ventral images, but it was also visible on the other views. In the mice fed the regular diet, strong intestinal fluorescence comparable to hepatic fluorescence was demonstrated extensively even at 3 hours, complicating the assessment of the reticuloendothelial system.
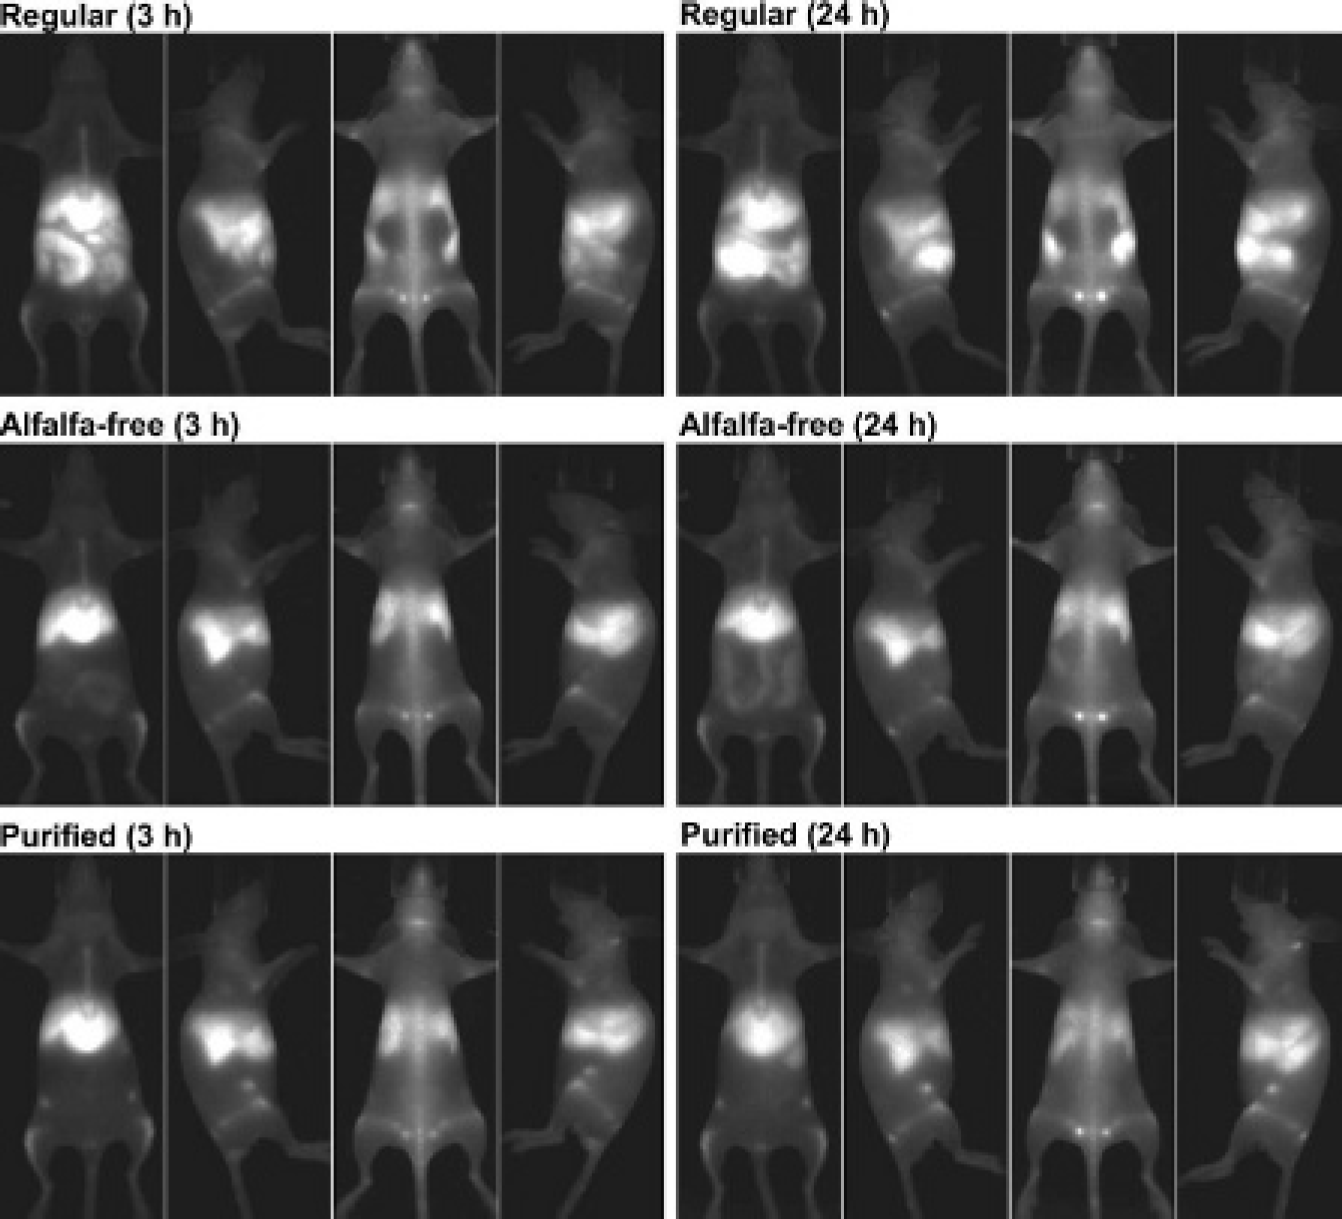
Fluorescence images acquired after quantum dot injection. Mice were fed the regular, alfalfa-free, or purified diet, and fluorescence imaging was performed 3 and 24 hours after injection. Ventral, right-lateral, dorsal, and left-lateral images are presented from left to right for each diet and time point. The grayscale was adjusted for each image to allow better visualization of the reticuloendothelial structures.
Discussion
For in vivo FLI in the far-red and NIR regions, feeding with alfalfa-free food is recommended to reduce autofluorescence owing to chlorophyll and its metabolites.5,7 Imaging of the food pellets confirmed that the alfalfa-free diet exhibits weaker fluorescence in the far-red and NIR regions compared with the regular diet. In addition, the fluorescence intensity of the purified diet was lower than that of the alfalfa-free diet. The alfalfa-free diet is a mixture of natural ingredients. Although we did not measure the chlorophyll content directly, we assume that the alfalfa-free diet contains a small amount of chlorophyll and that the chlorophyll content is even lower for the purified diet.
Mice fed the regular food showed prominent abdominal autofluorescence in the far-red and NIR regions, attributable to fluorescent substances in the intestinal contents. The fluorescent signals declined dramatically after substituting alfalfa-free or purified food for the regular food. By measuring the fluorescence of fresh feces, we confirmed the diet-related reduction of fluorescence in the intestinal contents. The purified diet was more effective than the alfalfa-free diet at reducing autofluorescence originating from intestinal contents, indicating its utility for in vivo FLI in the far-red and NIR regions. Fluorescent emission from chlorophyll and its metabolites shows two peaks, near 680 and 740 nm.3,10 Although the NIR region in this study was defined as around 800 nm, which was longer than the wavelengths corresponding to the chlorophyll peaks, the dependence on diet was similar between the far-red and NIR regions, and long-wavelength components related to chlorophyll appear to be responsible for the abdominal autofluorescence in the NIR region.
When the food pellets and feces were imaged, fluorescence in the green region was strongest for the purified diet. However, definite diet-dependent variations were not detected in the mouse abdomen. Visual inspection of the acquired images did not demonstrate high-signal areas with the shape of the intestine. Intestinal contents do not appear to be major sources of autofluorescence for imaging of mice in the green region, and diet would not be an important consideration for green imaging.
For the alfalfa-free diet, abdominal fluorescence decreased 1 day after the diet change, and no additional decrease was observed. Autofluorescence in the chest decreased similarly over time, which may have been due to decreased scattering of light from the abdomen or a reduction in chlorophyll derivatives in the blood and tissues. Although the mice were prepared with low-chlorophyll food for 1 week or longer to reduce the autofluorescence in previous studies,6–8,11–13 our results indicate that 1 day of feeding with the alfalfa-free diet is sufficient. Shortening the duration of feeding with an alternative diet may improve the convenience in experimental procedures and may minimize the possible dietary effects on mice.
The reduction in abdominal autofluorescence was slower for the purified diet than for the alfalfa-free diet, and it took 2 days to reach a plateau. The reduction depended on the cage change protocol, with repeated cage changes leading to rapid and consistent attenuation of abdominal fluorescence. Feces were accessible to mice in the cages used in this study. When the cage was not changed after the diet change, feces containing chlorophyll derivatives remained in the cage. Some mice appear to have eaten the feces, which altered the decrease in fluorescent substrates in the intestine. Mice may not care for the taste of the purified diet. Although the purified diet permits a thorough elimination of intestinal autofluorescence, we recommend that such a diet be consumed for 2 days or longer prior to FLI studies and that care should be taken to prevent the intake of fluorescent feces. Placing a wire rack at the bottom of the cage makes the feces inaccessible to the mice and may aid in accelerating reduction in intestinal autofluorescence.
QDs without targeting ligands accumulate in the reticuloendothelial system after intravenous injection, followed by gradual washout. 8 QDs at a dose of 5 pmol/g8 or 20 pmol/g9 have been used for in vivo fluorescent reticuloendothelial imaging in previous studies. In this study, we reduced the injection dose to 1 pmol/g amino-PEG-QDs. In the mice that were fed regular food, intestinal autofluorescence obscured the reticuloendothelial system. The intestinal signals were prominent on the ventral image and impaired the quality of images taken in the other projections. In the mice that were fed the alfalfa-free food, although the images obtained 3 hours postinjection were of good quality, washout of the QDs from the reticuloendothelial system resulted in a relative increase in intestinal autofluorescence. Intestinal autofluorescence was not noted on the images acquired in mice that were fed purified food. The use of less fluorescent diets may facilitate detection of relatively weak signals in the abdominal region and permit a reduction in the QD dose injected.
We used diets provided by a single vendor. The content of a diet may differ between vendors, and examining the fluorescent nature of each diet before use in FLI experiments is recommended. Spectral unmixing permits the removal of autofluorescence based on signals acquired in multiple narrow passbands and improves the delineation of target fluorescent sources. 14 Because the CCD camera system used in this study is not capable of spectral unmixing, it remains to be determined whether spectral unmixing eliminates the impact of diet. It is likely, however, that a reduction in intestinal autofluorescence owing to consumption of a less fluorescent diet is helpful even with spectral unmixing.
Conclusions
We investigated autofluorescence originating from the intestine in relation to diet. Abdominal fluorescence in the far-red and NIR regions was weakened by consumption of an alfalfa-free diet and was further weakened by consumption of a purified diet. The attenuation of autofluorescence was rapid and reached a plateau 1 or 2 days after the diet change; however, preventing the intake of feces containing fluorescent substances should be considered. The use of a low-fluorescent diet permits fluorescent reticuloendothelial imaging of acceptable quality following the administration of a low dose of QDs, indicating that a low-fluorescent diet contributes to enhance the potential of in vivo FLI.