
Abstract
Rituximab is a chimeric monoclonal antibody directed against human CD20 antigen, which is expressed on B-cell lymphocytes and on the majority of B-cell lymphoid malignancies. Herein we report the conjugate of rituximab with the near-infrared (NIR) fluorophore Cy5.5 (RI-Cy5.5) as a tool for in vitro, in vivo, and ex vivo NIR time-domain (TD) optical imaging. In vitro, RI-Cy5.5 retained biologic activity and led to elevated cell-associated fluorescence on tumor cells. In vivo, TD optical imaging analysis of RI-Cy5.5 injected into lymphoma-bearing mice revealed a slow tumor uptake and a specific long-lasting persistence of the probe within the tumor. Biodistribution studies after intraperitoneal and endovenous administration were undertaken to evaluate differences in the tumor uptake. RI-Cy5.5 concentration in the organs after intraperitoneal injection was not as high as after endovenous injection. Ex vivo analysis of biologic tissues and organs by both TD optical imaging and immunohistochemistry confirmed the probe distribution, as demonstrated by imaging experiment in vivo, showing that RI-Cy5.5 selectively accumulated in the tumor tissue and major excretion organs. In summary, the study indicates that NIR TD optical imaging is a powerful tool for rituximab-targeting investigation, furthering understanding of its administration outcome in lymphoma treatment.
Time-domain technology allows for whole-body NIR fluorescence lifetime analysis, based on both the specificity of fluorescence probes and the sensitivity of their emission lifetime to environmental characteristics. The tumor's metabolic microenvironment (microcirculation, blood flow oxygen, tissue pH distribution, bioenergic status) can vary significantly within a tumor and between tumors of the same grading and clinical staging. 3 As a consequence, preliminary studies reported in the literature show that lifetime imaging may be useful in investigating local environmental changes caused by malignancy inside the body, thus providing a tool for tumor localization and its spatial functional status. Hassan and colleagues presented preliminary results suggesting that trastuzumab conjugated to the chosen NIR fluorophore (Alexa Fluor 750) provides reasonable sensitivity of fluorescence lifetime to some characteristics of the surrounding medium, in particular, pH. 4 In another study, the fluorescence lifetime of a Cypate conjugate at the tumor site was mapped, showing the spatial distribution of lifetime related to its environment. The tumor showed a higher average lifetime when localized in the liver, reflecting its altered physiopathology. 5
In this study, we examined the conjugate of rituximab with NIR fluorophore Cy5.5 (RI-Cy5.5) as a tool for in vitro, in vivo, and ex vivo NIR imaging. Rituximab is a chimeric monoclonal antibody directed against human CD20 antigen, which is expressed on B-cell lymphocytes and on the majority of B-cell lymphoid malignancies.6,7 It is composed of two heavy chains of 451 amino acids and two light chains of 213 amino acids. It has an approximate molecular weight of 145 kDa. Rituximab was approved by the US Food and Drug Administration in combination with chemotherapy for lymphoma 8 and in combination with methotrexate for the treatment of rheumatoid arthritis in patients who failed to achieve adequate benefit from tumor necrosis factor α inhibitors. 9
The conjugate RI-Cy5.5 led to elevated cell-associated fluorescence on tumor cells. In vivo imaging with a small-animal time-domain eXplore Optix* imager allows the visualization of lymphoma xenograft with RI-Cy5.5 administrated by both endovenous and intraperitoneal routes. Biodistribution and lifetime analysis are reported.
Materials and Methods
Mouse Model of Lymphoma
Female severe combined immunodeficiency (SCID) mice (4–6 weeks of age) were purchased from Charles River and maintained under pathogen-free conditions. A similar xenograft model described by Macor and colleagues was employed to investigate the in vivo effects of Cy5.5 conjugates. 10 Briefly, BJAB human lymphoblastoid cells were expanded in vitro and then implanted intraperitoneally (right flank, 2 × 10⁶/mouse) in SCID mice. Fifteen to 20 days after implantation, mice that developed a solid mass were treated intraperitoneally or endovenously with 50 μg of RI-Cy5.5. Four lymphoma-bearing animals and two wild-type mice were imaged for each administration route.
All experimental procedures were done in compliance with the guidelines of European (86/609/EEC) and Italian (D.L.116/92) laws and were approved by the Italian Ministry of University and Research and the Administration of the University Animal Facility.
Synthesis and In Vitro Characterization of Rituximab Labeled with an NIR Probe
Conjugation of Dye to Antibody
The dye was the N-hydroxysuccinimide ester of cyanine 5.5 (Fluorolink Cy5.5 Monofunctional Dye 5-pack, Amersham Biosciences). Rituximab was derived from the residue of the first injection of antibody in patients (Dr. Iannone, Hematology and BMT Unit, Department of Oncology, University of Palermo, Palermo, Italy).
Rituximab was dissolved at 1 mg/mL in phosphate buffer. A freshly prepared solution of dye (0.05 mg/mL) in sodium carbonate buffer (0.1 M), pH 9.3, was added to the antibody solution (volume ratio 1:1). The reaction was performed by gently shaking the tube at room temperature for 1 hour. Labeled antibody was separated from the excess, unconjugated dye by dialysis against phosphate buffer (pH 7.4). Estimation of the final dye to protein ratio was performed measuring the absorbance of the solution at 678 nm and 280 nm. Molar extinction coefficients of 250,000 M–1 cm–1 at 678 nm for the Cy5.5 dye and 170,000 M–1 cm–1 at 280 nm for the protein were used. Molar concentrations of dye and protein were calculated, and the ratio of these values represented the average number of dye molecules coupled to each protein molecule. All solvents and chemicals were purchased from Sigma-Aldrich (Milan, Italy).
Immunofluorescence Analysis
Lymphoma cells were cultured in RPMI medium (Gibco, Carlsbad, CA) supplemented with 10% fetal calf serum. A total of 5 × 10⁵ cells were incubated with the primary antibody to CD20 rituximab or Monofunctional Dye 5-pack conjugated rituximab at 5 μg/mL in phosphate saline containing 1% bovine serum albumin for 1 hour at 37°C and then with the appropriate fluorescein (FITC)-conjugated rabbit anti human IgG (Dako, A/S, Denmark) for 1 hour at 37°C in the dark. All of the antibodies used were diluted in phosphate-buffered saline containing 1% bovine serum albumin. After washing with the same medium, the cells were fixed with 1% paraformaldehyde (Sigma-Aldrich).
Cell fluorescence was analyzed employing a FACScalibur instrument (BD Biosciences, Milan, Italy) equipped with an air-cooled 15 mW argon-ion laser operating at 488 nm. FITC green fluorescence was measured at 530 ± 30 nm bandpass filter. Data were collected using linear amplification for forward and side scatter and logarithmic amplification for FL1. For each sample, 10,000 events were collected and analyzed using CellQuest software (BD Biosciences, Franklin Lakes, NJ).
SDS-PAGE
Rituximab (10 μg) and Monofunctional Dye 5-pack conjugated rituximab (10 μg) were subjected to SDS-PAGE according to the Laemmli method on a 4% stacking–8% resolving gel under nonreducing conditions in SDS buffer containing bromophenol blue. Electrophoresis was performed for 30 minutes at 10 mA gel −1 and then at 20 mA gel −1 until the dye front reached the bottom of the gel. The gel was then analyzed with a small-animal time-domain eXplore Optix imager to visualize the fluorescence intensity of Monofunctional Dye 5-pack conjugated rituximab, consecutively stained for 60 minutes with Brilliant Blue R solution (Sigma-Aldrich), and finally destained with a 10% acetic acid and 30% methanol solution.
Mouse Preparation for Optical Imaging
Mice were anesthetized using zolazepam plus xylazine (0.4 mL zolazepam 100% plus 0.25 mL xylazine 2% dilute 1:5; 3.2 μL of the mixture/g body weight intramuscular), and the belly patch was shaved to avoid laser scattering caused by hair. A blank image was acquired before treating the animals, and then the mice were injected intraperitoneally or endovenously with 50 μg/mouse of rituximab chimeric monoclonal antibody carrying Cy5.5.
In Vivo Time-Domain Optical Imaging
The small-animal time-domain eXplore Optix* preclinical imager was used in this study.
In all imaging experiments, a 670 nm pulsed laser diode with a repetition frequency of 80 MHz and a time resolution of 12 ps light pulse were used for excitation. Fluorescence emission was collected at 700 nm and detected through a fast photomultiplier tube and a highly sensitive time-correlated single-photon counting system. Two-dimensional scanning regions of interest (ROIs) were selected, and laser power, integration time, and scan step were optimized according to the emitted signal. The data were recorded as temporal point-spread functions, and the images were reconstructed as fluorescence intensity and fluorescence lifetime. Prior to injecting the probe, mice were imaged to obtain background images.
Ex Vivo Tissue Analysis
Two mice for both routes of administration were sacrificed by cervical dislocation to perform the ex vivo analysis. Tissues of interest, such as tumor, liver, kidney, spleen, heart, lung, lymph nodes, and thigh bones, were collected. The tissues were first washed in phosphate-buffered saline and then analyzed with the eXplore Optix*.
Histopathologic and Immunohistochemical Analysis
Following ex vivo analysis, tissue samples were fixed in 10% buffered formalin and embedded in paraffin. Four micrometer thick sections were cut from paraffin blocks for morphologic and immunohistochemical analysis. Histopathologic evaluation of primary tumors and lymphomatous infiltrates in various tissues and organs was carried out on sections stained with hematoxylin and eosin. For immunohistochemistry, sections were deparaffinized and rehydrated in water, and antigen retrieval was performed by microwave oven treatment. The CD20 antigen expression was tested by means of a monoclonal antihuman CD20 antibody (clone L26, Dako, Denmark) recognizing a different epitope from that of rituximab and using the streptavidin-biotin-peroxidase complex method according to standard procedures. Detection of injected rituximab in lymphoid infiltrates and tissues was carried out by incubating slides, which did not undergo microwave oven treatment, with a secondary antihuman Fc antibody. Immunostainings were revealed using 3-3′-iaminobenzidine (DAB) as a chromogen and hematoxylin as nuclear counterstaining. All slides were evaluated by an expert pathologist under a Leica DM200 optical microscope (Leica, Germany), and microphotographs were taken using a Leica DC320 digital camera.
Data Processing
The background signal intensity recorded with the baseline image for each animal before the injection of the probe was subtracted from each postcontrast image. eXplore Optix* OptiView software (GE Healthcare, United Kingdom) was used to estimate fluorescence intensity and lifetime. 11
Fluorescence Lifetime Analysis
The fluorescence lifetime analysis was based on a single or two exponential fitting models applied to the temporal point-spread function. 12
Fluorescence Intensity Analysis
The intensity maps of acquired data were compared as normalized counts working on multiple images. Namely, for normalized counts, the photon counts over the temporal point-spread function curves were normalized with laser power and integration time, whereas scan step remained constant. To perform the comparison, an identical region of interest on each image was positioned to encompass the area under investigation. The resulting numerical data expressed as normalized counts were analyzed after exporting to Microsoft Excel.
Results
In Vitro Characterization of RI-Cy5.5
The absorption and fluorescence emission spectra of RI-Cy5.5 conjugate were similar to those of free Cy5.5, suggesting that the fluorescence property of Cy5.5 was not affected by conjugation to rituximab. The molar ratio of rituximab to Cy5.5 was estimated to be 3; thus, 50 μg (0.34 nmol) of rituximab labeled with 1 nmol of Cy5.5 resulted. The yield of synthesis was 46%.
Protein separation by SDS-PAGE has shown that Cy5.5 conjugation did not modify antibody molecular weight (Figure 1A); its analysis by the time-domain eXplore Optix preclinical imager also showed NIR emission of RI-Cy5.5, but no free cyanine was detected in the sample (Figure 1B). Cy5.5 conjugation could also interfere with the ability of the rituximab to bind CD20, so, for this reason, Cy5.5-labeled rituximab was compared with unlabeled rituximab. BJAB cells were incubated with the antibodies, with FITC-labeled secondary antibody and then analyzed by flow cytometry; as evidenced in Figure 1C, labeled and unlabelled rituximab analyzed by antihuman FITC secondary antibody showed similar binding, indicating that the conjugation procedure did not alter the affinity of the antibody.

In vitro characterization of rituximab-Cy5.5. Rituximab and rituximab-Cy5.5 (RI0Cy5.5) were separated by SDS-PAGE and analyzed using Coomassie Brilliant Blue R (A) or the time-domain eXplore Optix preclinical imager (B). Fluorescence-activated cell sorter analysis was used to evaluate the ability of the molecules to bind CD20, as described in Materials and Methods (C). FITC = fluorescein.
To demonstrate that the RI-Cy5.5 conjugate can act as a specific ligand for the CD20 receptor, we tested it on BJAB cells and other lymphomatous cell lines. When these cells were incubated in the presence of RI-Cy5.5 and secondary with FITC-antihuman IgG, the majority of both receptor-associated fluorescence and FITC-derived fluorescence colocalized at the plasma membrane. Moreover, control human IgG1 was not able to bind these cell lines (data not shown). These results suggested that tumor selectivity was provided by the monoclonal antibody specificity.
Time-Domain Fluorescence Imaging of Lymphoma-Bearing Mice Treated with NIR Fluorescent Dye RI-Cy5.5
Previously, Macor and colleagues set up an in vivo model of human CD20+ B-cell lymphoma in SCID mice to test the ability of human neutralizing minian-tibodies to enhance the therapeutic effect of rituximab. To prove a specific binding of rituximab, several other recombinant human or chimeric monoclonal antibodies were used as a negative control in this and other models of non-Hodgkin lymphoma. These antibodies did not shown any antitumoral activity, indicating that they are not able to bind tumor cells.
In this work, a similar model of lymphoma-bearing mice was treated intraperitoneally or endovenously (tail vein) with RI-Cy5.5. Fifty micrograms of rituximab labeled with 1 nmol of Cy5.5 was injected 10 based on the therapeutic efficacy of rituximab (maximal effect observed at 150 μg in mice) and the protocol followed in previous experiments (double injection of 25 + 25 μg).
Intraperitoneal Injection
After injection of RI-Cy5.5, lymphoma-bearing mice were imaged every 30 minutes for the first 6 hours and then every 24 hours for 10 days. Whole-body scans showed the highest fluorescence signal in the region of probe injection, whereas intensity decreased exponentially and remained confined to a restricted area (Figure 2A). Comparing different animals injected intraperitoneally with equal volume and concentration of RI-Cy5.5, a variability in fluorescence intensity progression at the site of injection level was observed (Figure 2B).
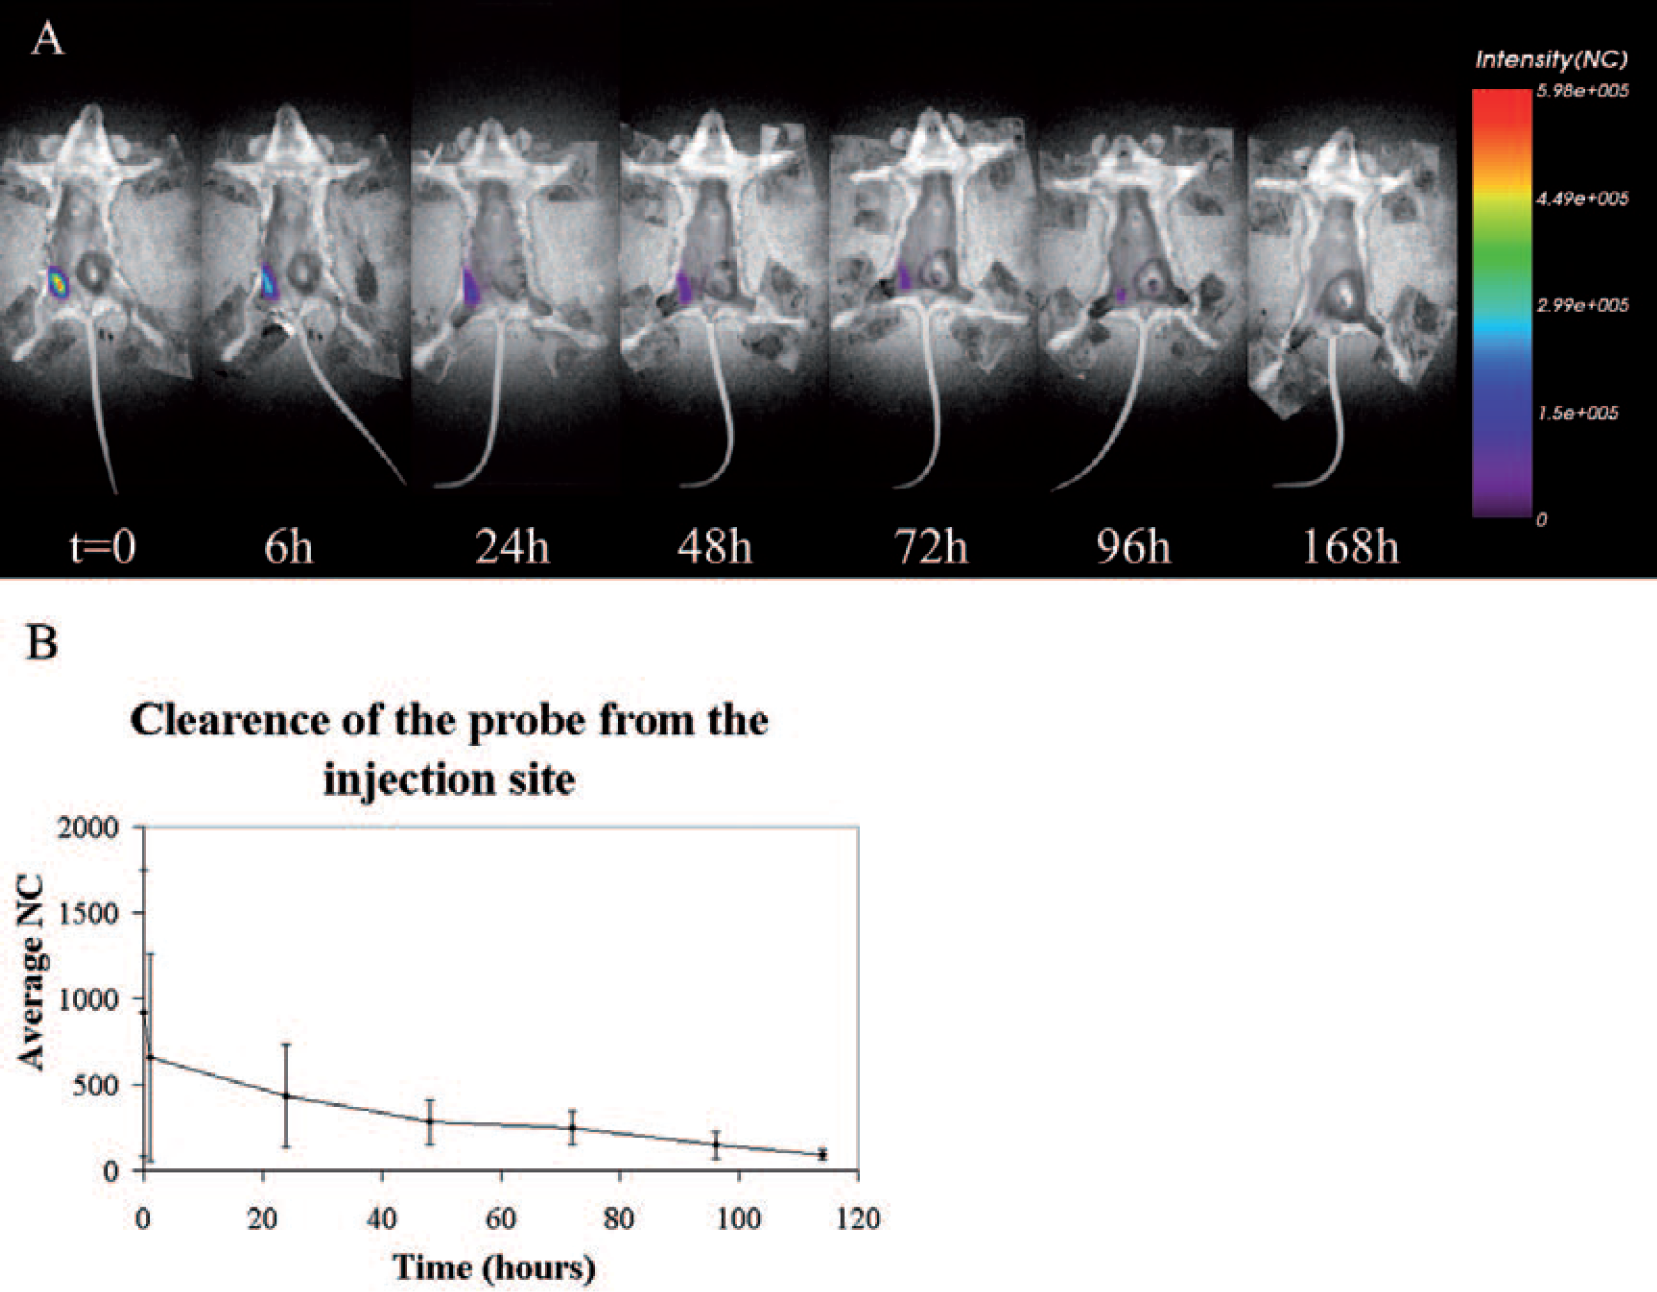
A, Whole-body scan of a lymphoma-bearing mouse injected intraperitoneally with 50 μg rituximab-Cy5.5 (corresponding to 1 nmol Cy5.5) at the indicated time postinjection. The site of probe injection showed the highest fluorescence signal and a lifetime of 1.40 to 1.42 ns, which remained confined to a restricted area and was detectable for up to 96 hours. B, A representation of the signal level decay describing the clearance of rituximab-Cy5.5 from the site of injection (the values indicate mean ± standard error of measurement of three independent experiments). NC = normalized count.
To optimize laser power and integration time parameters, the probe injection regions were maintained outside the scanning area and the body was divided into three regions: xenografted tumor, thorax, and abdomen. The contrast between the tumor and surrounding tissue increased slowly and was significantly higher than precontrast from 24 hours until 10 days after injection (Figure 3A). The fluorescence lifetime of RI-Cy5.5 at the xenografted tumor site was mapped, showing spatial distribution of lifetime in relation to the environment. The lifetime range was 1.83 to 1.93 ns for the inner part of the tumor and 1.70 to 1.75 ns for the tissue surrounding the tumor (see Figure 3A). Targeting of the probe into the inner part of the tumor was estimated by following the fluorescence intensity of the ROIs, encompassing the tumor tissue, and presenting a lifetime between 1.85 and 1.87 ns. The fluorescence emission reached its maximum around 96 hours postinjection (Figure 3B).

Intraperitoneal injection. Tumor and lymph node biodistribution of 50 μg rituximab-Cy5.5 (corresponding to 1 nmol Cy5.5) in lymphoma-bearing mice after intraperitoneal (i.p.) injection. A, Fluorescence emission in regions of interest encompassing the solid xenografted tumor was acquired at the indicated time postinjection and normalized. Fluorescence intensity and corresponding lifetime map are shown. B, The graphs indicate the targeting of the probe to xenografted tumor after intraperitoneal injection and its comparison with the profile after endovenous (e.v.) injection. The values indicate mean ± standard error of measurement of three independent experiments. C, Fluorescence emission in regions of interest encompassing the thorax was acquired at different times postinjection and normalized. A representative mouse is shown, with the corresponding profiles describing the targeting of the probe to lymph node areas. NC = normalized count.
The fluorescence intensity of the ROIs over time was quantified as a measure of clearance from tissues and organs. A time course for targeting and clearance of the RI-Cy5.5 from lymph nodes was monitored (Figure 3C).
Lifetime values were 1.60 to 1.65 ns for the armpit lymph nodes, 1.40 to 1.42 ns at the site of injection, and 1.5 to 1.6 ns for the liver.
Ex vivo evaluation of organs at 96 hours postinjection (Figure 4) clearly showed that the highest signal of fluorescence emission was associated with tumor tissue. RI-Cy5.5 was also found in the liver and the kidneys, organs involved in the elimination of the compound.
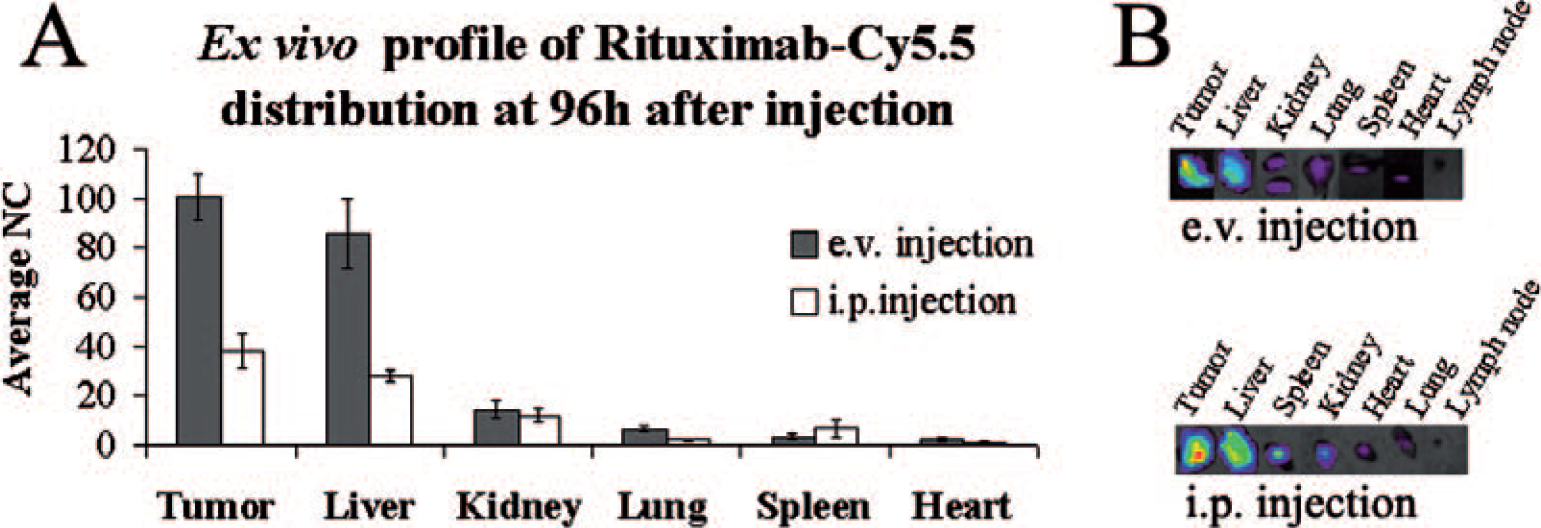
Ex vivo analysis. A, Ex vivo profile of 50 μg rituximab-Cy5.5 (corresponding to 1 nmol Cy5.5) distribution after endovenous (e.v.) (black bars) and intraperitoneal (i.p.) (white bars) injection in lymphoma-bearing mice. Data represent mean values ± range (n = 2). B, Ex vivo images of organs at 96 hours after endovenous and intraperitoneal injection. Imaging of the organs was performed immediately after sacrifice: laser power and integration time were optimized while keeping scan step constant to compare fluorescence intensities after normalization. NC = normalized count.
Endovenous Injection
The total dose of RI-Cy5.5 (50 μg RI, 1 nmol Cy5.5/mouse) was the same as that used for intraperitoneal administration.
Imaging was performed every 30 minutes for the first 5 hours and then every 24 hours for 10 days (Figure 5A). Following injection, RI-Cy5.5 was rapidly taken up by the liver and gradually washed out. Targeting of the probe to the tumor was evaluated as described before; it was at maximum level after 48 hours postinjection and was slowly eliminated over the following 8 days (Figure 5C). Fluorescence lifetime was estimated, and values comparable to those obtained after intraperitoneal injection were obtained for the inner part of the tumor, its surrounding tissue, and the lymph nodes. The liver presented a lifetime between 1.5 and 1.6 ns. A time course for targeting and clearance of the RI-Cy5.5 from lymph nodes was monitored (Figure 5B).

Intravenous injection. Biodistribution of 50 μg pf rituximab-Cy5.5 (corresponding to 1 nmol Cy5.5) in lymphoma-bearing mice after endovenous (e.v.) injection. A, Whole-body fluorescence intensity was acquired at the indicated time postinjection and normalized. B, Fluorescence emission in regions of interest encompassing the thorax were acquired at different times postinjection and normalized. A representative mouse is shown, with the corresponding profiles describing the targeting of the probe to lymph node areas. C, Fluorescence emission in regions of interest encompassing the solid xenografted tumor were acquired at the indicated time postinjection and normalized. Fluorescence intensity and corresponding lifetime map are shown. The graphs indicate the targeting of the probe to xenografted tumor after endovenous injection. The values indicate mean ± standard error of measurement of three independent experiments. NC = normalized count.
Ex vivo evaluation of organs at 96 hours postinjection showed that the highest fluorescence intensity was localized in the tumoral mass. The high fluorescence emission was recorded in the liver and then in the kidneys, emphasizing that the compound is excreted through these organs (see Figure 4).
Immunohistochemical Detection of Rituximab in Primary Tumors
Primary tumors and organs from intraperitoneally and endovenously treated mice and from untreated controls were fixed following ex vivo imaging for immunohistochemical analysis. At involved sites, lymphomatous cells showed a strong membrane reactivity to anti-CD20 staining (Figure 6A). Consistently, rituximab binding was detected in the context of lymphoid infiltrates in the form of a membrane staining slightly diffusing to the interstitium (Figure 6B). In primary tumors, rituximab binding, highlighted by the secondary antihuman antibody, was localized mainly in the peripheral areas of the tumor masses, often characterized by lytic changes and necrosis (Figure 6, C-D, arrows). Besides lymphomatous infiltrates, antihuman reactivity was also observed in hepatic sinusoids and venules (Figure 6E, red arrows), as well as in the glomerular capillaries and arterioles of the kidney (Figure 6F, red arrows). In both sites, scattered monocytoid cells also showed cytoplasmic reactivity to antihuman antibody (Figure 6, E-F, black arrows). G to I in Figure 6 refer to the controls.

Immunohistochemical detection of rituximab in primary tumors. A, Primary tumors and lymphomatous infiltrates are composed by medium to large atypical lymphoid cells with a diffuse growth pattern and strong membrane CD20 expression. B, Immunohistochemistry performed using a secondary antihuman Fc antibody highlighted the presence of rituximab in the neoplastic aggregates, in the form of a membrane staining diffusing to the interstitium. C-D, Rituximab is mostly detected at the periphery of the tumor masses where a high degree of cell lysis is observed. E-F, Binding of secondary antihuman Fc is observed in the hepatic sinusoids and central venules (E, red arrows), as well as in the glomerular capillaries and arterioles in the kidney (F, red arrow), suggesting the presence of rituximab in these sites. Reactivity to antihuman Fc is also observed in the cytoplasm of scattered monocytoid cells (black arrows). G-H, Negative controls performed on the same samples shown in E and F by incubating slides with an irrelevant (antimouse) secondary antibody. A-H, Immunohistochemistry performed by the streptavidin-biotin-peroxidase complex method using DAB (yellow-brown signal) chromogen and hematoxylin nuclear counterstaining. Original magnifications: A and C-H, x200; B and F (inset), x400. I, Antihuman Fc staining of an untreated tumor. Bars = 100 μm.
Overall, no differences were found between samples from intraperitoneally and endovenously injected mice in regard to the immunohistochemical detection of rituximab.
Discussion
Rituximab is a chimeric monoclonal anti-CD20 antibody used in clinical settings for the treatment of some non-Hodgkin lymphomas6,7 and some autoimmune conditions. 9 It has already been characterized in several animal models for its functional activity, 13 but a complete biodistribution profile of this drug has never been obtained.14,15 In the present work, time-domain optical imaging allowed us to carry out longitudinal animal studies evaluating the biodistribution of a cyanine 5.5–labeled rituximab over time in the same animal for a prolonged time (7–10 days) until its complete elimination.
The in vivo and ex vivo time-domain analysis of lymphoma-bearing mice injected with equal amounts of RI-Cy5.5 showed some differences in biodistribution after intraperitoneal and endovenous injections. In general, fluorescence intensity in the organs after intraperitoneal injection was not as high as after endovenous injection. In fact, after intraperitoneal treatment, the probe must be absorbed by the peritoneal cavity before reaching the bloodstream, whereas with the endovenous route of administration, the compound is injected into the bloodstream directly. RI-Cy5.5 reached the tumoral region faster and with a higher concentration by endovenous administration compared with intraperitoneal treatment. The maximum fluorescence emissions were observed 72 hours after endovenous injection and 96 hours after intraperitoneal injection. The peculiar difference in the rate of tumor uptake of RI-Cy5.5 suggested an advantage in using the intraperitoneal route of administration instead of the endovenous one, when there is a need to induce therapeutical effect mimicking slow-release delivery.
Ex vivo analysis confirmed the probe distribution and showed that RI-Cy5.5 is selectively accumulated in the tumor tissue and major excretion organs, as observed in the in vivo experiments.
The lifetime of RI-Cy5.5 changed significantly when distributed in the liver, tumor, lymph nodes and bladder. Moreover, the large differences in the lifetime of RI-Cy5.5, food, and exogenous fluorophore, respectively, minimized spectral overlap. This allowed a lifetime gating analysis to be performed, namely, to directly correlate the fluorescence emission to specific lifetime range values to select only RI-Cy5.5 and eliminate background signal. This facilitated imaging of the distribution of the RI-Cy5.5 and correlating its spatial distribution with the microenvironment of the tumor. Namely, lifetime gating analysis allowed us to distinguish the two different microenvironments inside the tumor mass, showing, with both intraperitoneal and endovenous injection, a lower lifetime in the margin and a higher lifetime in the center of the xenografted tumor. Our finding regarding NIR fluorescent Cy5.5 lifetime analysis in a tumor model agrees with previous results on carbo-cyanines, indicating that the lifetime analysis approach is an effective medium in providing information on tissue microenviroment. Previous studies demonstrated that NIR fluorescent Cypate conjugates can map the spatial distribution of lifetime in relation to tumor environment. 5
Time-domain optical imaging technology allowed us to monitor probe absorption at the intraperitoneal injection site. The probe was detectable at the injection site for 96 hours. Comparing different animals injected intraperitoneally, we observed a variability in fluorescence intensity progression at the injection level. We supposed that such a variability was inherent with the administration route. In fact, intraperitoneal injections deliver RI-Cy5.5 to the peritoneal cavity, and the amount that distributes systematically depends on the rate and the amount of compound traveling from the peritoneal cavity into the bloodstream. Moreover, fluid distribution in the peritoneal cavity depends on the complex recesses that characterize it. Therefore, differences persist between animals in the absorption capacity from the peritoneal cavity, as observed. These findings are consistent with previously reported results obtained with small-animal positron emission tomography, 16 thus confirming that the sample volumes are of concern for intraperitoneal injection and that injecting samples of equal volumes leads to more reproducible results. Although further experiments are required to quantify the best conditions (in terms of volume and concentration of Cy5.5-labeled antibodies) for intraperitoneal injections, we assessed the ability of time-domain optical imaging technology to optimize experimental protocols relative to this administration route.
The monitoring of other districts than the tumor (eg, lymph nodes) confirms the possibility of applying this technology not only to study the primary tumor region but also to evaluate the distribution of drugs in different “metastatic” regions. After injection in the peritoneum, the biomarker is distributed throughout the whole organism through blood circulation and localized in lymph node regions within 48 hours, and it is possible to detect the compound up to 96 hours after treatment. The same peaks of fluorescence intensity are detectable in the mouse treated endovenously with the tested compound, but, as shown in the respective images, in this case, the signal in the lymph nodes was stronger.
Immunohistochemical analyses were performed to confirm data obtained using time-domain optical imaging. The immunohistochemical detection of rituximab has not shown differences between intraperitoneally and endovenously injected mice in the excised organs at 96 hours postinjection, generally confirming data collected from ex vivo analysis. This technique appears to be less sensitive than optical imaging and permitted us to visualize Fc portions of rituximab in primary tumors, but lymphomatous infiltrates or rituximab was also observed in hepatic sinusoids and venules, as well as in the glomerular capillaries and arterioles of the kidney.
Conclusion
We used the eXplore Optix* system, a time-domain optical imaging technology, to demonstrate how rituximab, a chimeric monoclonal antibody directed against human CD20 antigen, maintained its functional characteristics after being conjugated to the fluorophore cyanine 5.5 and injected in mice bearing a human lymphoma and how rituximab is specifically uptaken by the tumor and the metastatic regions. Ex vivo analyses were performed to confirm the organs' fluorescence emissions recorded in vivo. Moreover, we studied the differences in biodistribution between two routes of administration, the intraperitoneal and the endovenous one.
Our findings indicated that lifetime of RI-Cy5.5 is a parameter sufficiently sensitive to discriminate between the exogenous signal of RI-Cy5.5 and autofluorescence and to monitor changes in the tumor tissue microenvironment. Finally, we were able to assess that this noninvasive technology allows us to conduct longitudinal studies in the same animal and that it is possible to obtain accurate recovery of fluorophore distribution.
Footnotes
Acknowledgments
We thank Mr. Marco De Simone for his help with graphic and image processing.
This work was supported by grants provided by the Italian Association for Cancer Research (AIRC), the Italian Ministry of University and Research (FIRBIN045LT8), and Regione Friuli-Venezia Giulia. We also wish to acknowledge the financial support of the Fondazione CRTrieste and of Bracco Imaging Spa.
Financial disclosures of reviewers: None reported.