
Abstract
Estrogen receptors have long been known to be expressed in several brain areas in addition to those directly involved in the control of reproductive functions. Investigations in humans and in animal models suggest a strong influence of estrogens on limbic and motor functions, yet the complexity and heterogeneity of neural tissue have limited our approaches to the full understanding of estrogen activity in the central nervous system. The aim of this study was to examine the transcriptional activity of estrogen receptors in the brain of male and female mice. Exploiting the ERE-Luc reporter mouse, we set up a novel, bioluminescence-based technique to study brain estrogen receptor transcriptional activity. Here we show, for the first time, that estrogen receptors are similarly active in male and female brains and that the estrous cycle affects estrogen receptor activity in regions of the central nervous system not known to be associated with reproductive functions. Because of its reproducibility and sensitivity, this novel bioluminescence application stands as a candidate as an innovative methodology for the study and development of drugs targeting brain estrogen receptors.
Recently, our laboratory successfully developed a reporter mouse model for the study of the activation of ERs under physiologic conditions and/or pharmacologic stimulation, the ERE-Luc model (ERE = estrogen-responsive element). 15 In this mouse, the transgene carries the luciferase reporter gene driven by an estrogen-responsive promoter and is flanked by insulator sequences, which enable ubiquitous and hormone-regulated expression of the reporter gene, as shown in previous reports.15,16 Photinus pyralis luciferase was chosen as a reporter for our mouse model because of its well-known utility to register specific cell functions in space and time when given its substrate luciferin. It is also the reporter system best suited to small-animal imaging because it generates photons in the absence of exogenous excitatory stimuli, has very high enzymatic efficiency, and has a short half-life, which is indispensable to studying the progression of biologic processes in time.17–19 The ERE-Luc model was instrumental in obtaining a comprehensive view of ER transcriptional activity in all peripheral organs during the estrous cycle and provided novel insights on the mechanisms triggering ER transcriptional activity15,20 when studied either by biochemical assay evaluation of luciferase expression levels or by optical imaging examination of living animals.
The aim of the present study was to investigate the extent to which the estrous cycle differentially modulates ER activity in reproductive and nonreproductive areas and the extent to which ER activation in male brain differs from ER activation in the same areas of female brain. Therefore, we developed a functional method to precisely localize and quantify ER transcriptional activity in mouse brain, enabling the quantitative measurement of luciferase activity in selected brain regions. With this technique, we could observe for the first time that the estrous cycle significantly influences ER activity in brain areas, such as limbic areas, not related to reproduction, and that ER activity is quite sustained in the brains of male and female mice.
Materials and Methods
Animals
All animal protocols were approved by the Institutional Animal Care and Use Committee at the Department of Pharmacological Sciences of the University of Milan and were in accordance with the European legislation. ERE-Luc mice on the C57BL/6 background were generated and bred at Harlan (Harlan Italy s.r.l., Correzzana, Milan). Mice were maintained in a 12-hour light-dark cycle and housed one to four per cage with food and water ad libitum. For this study, we used heterozygous males and females of 2 to 4 months of age. The phase of the reproductive cycle in the females was assessed by vaginal lavages, which were air-dried and stained with the May-Grünwald and Giemsa methods (MGG Quick Stain Kit, Bio-optica, Milan, Italy) following the protocol provided by the manufacturer.
To avoid infections owing to intracerebroventricular (ICV) injections of luciferase and ICI 182,780, animals were treated subcutaneously (SC) with 5 μL/g/die of the antibiotic Baytril (0.1%, Bayer) for 3 days before experimentation.
Animals were maintained with the diet Mucedola 4RF21 (Mucedola, Settimo Milanese, Italy); 1 week prior to the experiment, animals were shifted to the estrogen-free AIN93M (Mucedola).
Bioluminescence Reporter Imaging
For anesthesia, mice were injected SC with 50 μL of a solution of ketamine (1.7 mg/kg, Ketavet 50, Gellini, Italy) and xylazine (90 μg/kg, Rompum, Bayer, Italy). ICV injections on anesthetized animals were done according to specific stereotaxic coordinates (bregma, −0.25 mm; lateral, 1 mm; depth, 2.25 mm) by the use of a Hamilton syringe rotated on the coronal plate about 3° from the orthogonal position, as previously described. 21 Mice were killed by cervical dislocation 20 minutes after ICV injection of 3 μL of the luciferin aqueous solution (beetle luciferin potassium salt, 25 mg/mL; Promega, Madison, WI). Brains were rapidly dissected and sectioned by means of a “brain matrix” (adult mouse, coronal and sagittal, 1 mm spacing; Ted Pella, Redding, CA). Sections were immediately visualized by the Night Owl imaging unit (Berthold Technologies, Bad Wildbad, Germany) consisting of a Peltier cooled charge-coupled device (CCD) slow-scan camera equipped with a 25 mm/f 220 0.95 lens located in a light-tight chamber. Grayscale images of the sections were first taken with dimmed light. Photon emission was measured in a 15-minute exposure time. Pseudocolor images associated with photon emission were generated by a Night Owl LB981 image processor and transferred via video cable to a PCI frame grabber using WinLight software (version 32, Berthold Technologies). For colocalization of the bioluminescent photon emission, grayscale and pseudocolor images were merged using WinLight version 32 software (color code from low to high photon emission: blue, green, red, yellow, and white). Luminescence of the brain slices was expressed as the integration of photon emission per time unit (cts/s); to be able to compare the extent of photon emission in brain nuclei characterized by a different area, data were expressed as cts/s/mm2. Photon emission in selected brain areas was quantified by means of a grid generated with the aid of a brain atlas. 22
Luciferase Enzymatic Assay
Selected brain regions were manually dissected, immediately frozen, and stored at −80°C. For the biochemical assay, tissues were homogenized by TissueLyser (Quiagen, Hilden, Germany) using 300 μL of the phosphate lysis buffer (pH 7.8 containing 100 mM KPO 4 , 1 mM dithiothreitol, 4 mM ethylene glycol tetraacetic acid, 4 mM ethylenediaminetetraacetic acid) and putting a stainless steel bead in each 1.2 mL polyethylene microtube (StarLab, UK). The homogenates were centrifuged (5900 rpm for 30 minutes at 4°C), and 20 μL of the supernatant was transferred to a white opaque 96-well plate for luminescence quantification by the luminometer (Veritas, Turner Biosystems, Sunnyvale, CA) for an integration time of 10 seconds after automatically injecting 100 μL of luciferase assay reagent (10 mM luciferin, 1 M dithiothreitol, 200 mM adenosine triphosphate dissolved in buffer solution). Light measurements were recorded by the luminometer software GloMax (Promega Corp., Madison, WI). Protein concentrations in the supernatants were measured using the Bradford Protein Assay Kit (Pierce, Rockford, IL) following the manufacturer's protocols and analyzed using a EM680 microplate reader (BioRad Laboratories, UK). The luminescence data, normalized over the protein content of each sample, were finally expressed as relative light units (RLUs) per microgram of protein.
Pharmacologic Treatments
17β-Estradiol (E2, 50 μg/kg; Sigma, Italy) was administered in 100 μL of corn oil by SC injection 6 hours before luciferin administration.
Because of its low blood-brain barrier penetrability and short half-life, the full antagonist of the estrogen receptor ICI 182,780 (1.3 μg/kg; Tocris, UK) was injected ICV twice, 27 and 10 hours before luciferin administration. Each injection contained 1.5 μL (1.3 pg/kg) of the ICI 182,780 solution (0.05 M in ethanol 98% v/v). The ER antagonist was kindly provided by Zeneca (Basiglio, Milan, Italia). Controls were injected with vehicle.
Statistical Analysis
All statistical differences were calculated using GraphPad software Prism5 (GraphPad Software Inc., San Diego, CA), setting the critical alpha level at 95% and choosing the two-tailed test, since we were not expecting the relationships to be directional.
In the experiment for the evaluation of the effects of ICI 182,780 and E2 treatments on brain luciferase activity, we used the unpaired t-test to compare the independent groups of samples (n = 8 for control, n = 6 for for E2, and n = 6 for ICI 182,780). Calculated p values are as follows: control versus E2 (whole slices): 1 p = .0260, 2 p = .0033, 3 p < .0001, 4 p = .0032, 5 p = .0061, 6 p = .0019, 7 p = .0202, 9 p = .0171, 10 p = .0067, 11 p = .0080; control versus ICI 182,780 (whole slices): 2 p = .0032, 3 p = .0138, 4 p = .0055, 5 p = .0005, 6 p = .0030, 7 p = .0006, 8 p = .0020, 9 p < .0001, 10 p < .0001, 11 p = .0232; control versus E2 (brain areas): motor cortex (MCx) p = .0294, piriform cortex (PyrCx) p = .0105, caudate putamen (CPu) p = .0358, thalamus (Tha) p = .0388; control versus ICI 182,780 (brain areas): MCx p = .0356, parietal cortex (PCx) p = .0017, CPu p = .0316, Hyp p = .0031, hippocampus (Hipp) p = .0086, Tha p = .0111, arcuate nucleus (Arc) p = .0007, amygdala (Amy) p = .0002, nucleus accumbens (Acb) p = .0228. Differences are significant for p < .05.
The levels of luciferase activity in the brains of female mice during the four estrous cycle phases, associated with different levels of circulating E2, were compared using one-way analysis of variance followed by a Bonferroni post hoc test (n = 6 for metestrus, n = 4 for diestrus, n = 6 for proestrus, n = 5 for estrus). Exact p values were calculated using SigmaStat 3.5 software (Systat Software Inc., Richmond, CA); p values are as follows (only significant values are reported): metestrus versus proestrus: Hyp p = .009, Arc p = .023, septal nuclei (Sn) p = .036; diestrus versus proestrus: Arc p = .022, Sn p = .035, Amy p = .012; proestrus veresus estrus: Arc p = .026. Differences are significant for p < .05.
In the comparative analysis of luciferase expression in selected brain areas of male and female ERE-Luc intact mice, statistical analysis was obtained by unpaired t-test; calculated p values are as follows (only significant values are reported): male versus female proestrus: PyrCx p = .0075, Sn p = .0012, Tha p < .0001, Arc p = .0002; female diestrus versus female proestrus: Sn p = .0122, Hyp p = .0234, Tha p = .0148, Arc p = .0310.
Results
Procedure Standardization
To obtain a functional portrait of ER activation in brain using luciferase bioluminescence, we set up a new procedure consisting of the preparation of brain slices from control mice or from mice treated as requested by the experiment and given luciferin as a substrate of the reporter. Traditional imaging techniques cannot be applied to the study of the central nervous system because of a series of methodological limitations. Among these, luciferin has very low permeability to the blood-brain barrier; the skull prevents bioluminescence to be efficiently detected by the CCD camera device, and no three-dimensional reconstruction of the brain is allowed, which makes it impossible to correctly attribute signals to the respective emitting areas.
Therefore, to overcome its low blood-brain barrier permeability, the hydrophilic substrate luciferin was administered by ICV injection; then, for brain imaging, mice were euthanized, and brains were dissected, sliced in 11 sections using a brain matrix (Figure 1A), and exposed to a CCD camera for the detection of photon emission.
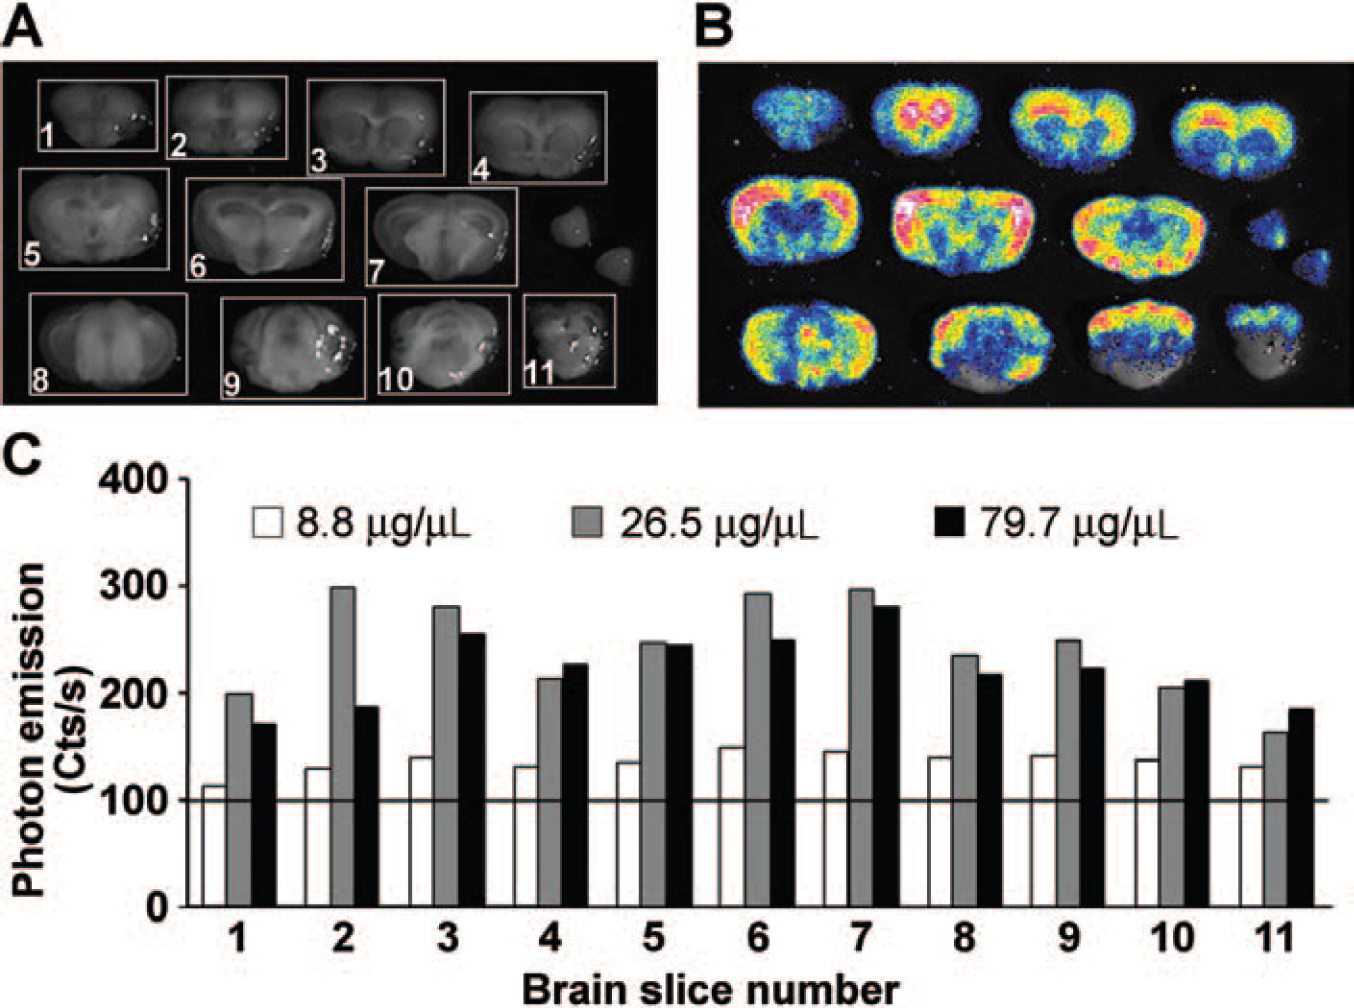
Assessment of luciferin concentration necessary for the measurement of luciferase activity in mouse brain slices. A, Black-and-white photograph of the sections numbered and exposed to a charge-coupled device (CCD) camera and electronic grids generated to delimit the areas to be used for photon emission counting. Olfactory tubercles, dissected and located in the right end of the middle row, were not taken into consideration in the present study. B, Bioluminescence-based optical imaging of a representative brain of ERE-Luc male mice after intracerebroventricular (ICV) injection of 3 μL of a solution of 26.5 μg/μL luciferin; pseudocolors are representative of the intensity of photon emission: the highest photon emission is in white, and gradually lower emissions are in yellow, red, green, and blue. C, Photon emission calculated as counts/second of 11 brain sections of male ERE-Luc mice 20 minutes after ICV injection of 3 μL of luciferin at different concentrations (8.8, 26.5, and 79.7 μg/μL saline); the CCD camera exposure time was 15 minutes.
To define the dose of substrate ensuring enzyme saturation, male ERE-Luc mice were injected ICV with 3 μL of a solution containing increasing concentrations of luciferin (8.8, 26.5, and 79.7 μg/μL saline). The extent of photon emission was measured 20 minutes after luciferin injection. Figure 1B indicates that 20 minutes after ICV injection, the substrate appeared to have diffused throughout the brain and that the 26.5 μg/μL solution was providing the best signal to noise ratio (Figure 1C). To better evaluate the time necessary to obtain full distribution of the substrate, we carried out a time course study; ERE-Luc male mice were injected ICV with luciferin and euthanized after 10, 20, 40, or 60 minutes. At this point, brains were rapidly excised and sliced and bioluminescence analysis was immediately performed. The highest photon emission was observed when the analysis was carried out 20 minutes after the injection; after 40 or 60 minutes from the injection, bioluminescence was found to be highly decreased in most brain areas, indicating that luciferase substrate availability and enzyme activity reach a plateau 15 to 20 minutes after substrate injection (data not shown). On the basis of these preliminary studies, all subsequent experiments were carried out injecting 3 μL of 26.5 μg/μL luciferin solution ICV and euthanizing the mice 20 minutes later.
Photon Emission Measured by CCD Camera Provides Data in Agreement with Standard Enzymatic Assay Data
To test the extent to which photon emission measured by CCD camera reflected a real change in the brain content of luciferase enzymatic activity, we carried out the measurements in parallel using one hemisphere of the same brain for each technique. We analyzed the brains of four groups of ERE-Luc male mice (treated with 5, 20, and 50 μg/kg of E2 and corn oil as vehicle). Animals were euthanized 6 hours after treatment, and brains were sagittally halved: one half was sliced for CCD camera bioluminescence analysis (Figure 2A), whereas the other was processed for enzymatic assay. The summation of the photons emitted by the sagittal slices shows that luciferase activity increases in relation to the dose of E2 administered (Figure 2B). This is consistent with the study of luciferase enzymatic assay carried out in the brain tissue extract (Figure 2C). The extent of the increase observed with the two methods is very similar (photon emission: + 77% cts/s; luciferase enzymatic activity +82% RLU/μg of proteins).

Quantitative analysis of brain luciferase content as measured ex vivo by bioluminescence or enzymatic assay. The brains of ERE-Luc adult male mice subcutaneously treated for 6 hours with 5, 20, and 50 μg/kg of E2 and corn oil as vehicle were excised: the left hemisphere was isolated and sliced for optical imaging, and the right hemisphere was used for the preparation of the extracts for the biochemical assay of luciferase activity. A, Black-and-white photograph and pseudocolor representative images of the four sagittal sections obtained from the left hemispheres. B, Photon emission, as measured as counts/s, of the sagittal slices. The values in the graph represent the summation of the photon emission from the four sagittal slices. C, Luciferase activity measured in extracts from the entire right hemisphere and expressed as relative light units (RLU)/μg of proteins. The experiment was carried out in a group of four ERE-Luc adult male mice.
This initial observation led us to conclude that ex vivo imaging provides a measure of luciferase activity as sensitive and quantitative as the biochemical study of luciferase enzymatic activity.
ER Antagonist ICI 182,780 Significantly Lowers Brain Luciferase Activity
In previous experiments, brain luciferase activity in intact male brains appeared to be high when compared with peripheral tissues, where, in unstimulated males, luciferase activity is at the lower limits of detection by both imaging and biochemical assays. 15 To establish the extent to which photon emission measured in brain sections was associated with the state of ER transcriptional activity, male ERE-Luc mice were treated with vehicle, the full ER antagonist ICI 182,780 (Fulvestrant, 1.3 μg/kg ICV), and the ER agonist E2 (50 μg/kg, SC); animals were euthanized 6 hours after treatments, the time shown to induce the highest response to E2 treatment by previous experiments. 15 In this set of experiments, we performed coronal sections of the brains to facilitate the study of the effect of the treatments in discrete brain regions. Figure 3A shows a visible decrease in photon emission in mice treated with ICI 182,780. The extent of the decrease in photon emission in treated versus control mice differed in each brain slice, with changes ranging from −54% (slice 5) to −30% (slice 4). The average decrease in whole brain was −44%. Thus, these data suggest that in the absence of exogenous stimuli, ER in the brain of adult male mice is transcriptionally active. This was not surprising since it is well known that aromatase, the enzyme converting circulating testosterone into E2, is widely expressed in the brain, and this ensures a continuous, local synthesis of E2. 23 In addition, the brain is rich in growth factors such as insulin-like growth factor 1 or epidermal growth factor, which have been described to transcriptionally activate the unliganded receptor.24–26

Effect of treatment with E2 and ICI 182,780 on photon emission from ERE-Luc male brain. A, Optical imaging of representative brains of treated ERE-Luc mice. In the control group, animals received corn oil subcutaneously (SC) as E2 vehicle and ethanol intracere-broventricularly (ICV) as ICI vehicle; in the ICI group, mice received corn oil SC and ICI 182,780 1.3 μg/kg ICV; in the E2 group, mice received E2 50 μg/kg SC and ethanol ICV. B, Comparative analysis of photon emission in brain slices. Data are expressed as the integration of the average photon emission unit (Cts/s) and represent the mean ± SEM (n = 6–10). Statistical differences (*vehicle vs E2; °vehicle vs ICI) are reported: °/*p < .05; °°/**p < .01; °°°/***p < .001. Statistical analysis is described in the Methods section, where actual p values are listed. C, Electronic grid delimiting specific brain areas to be used for photon emission counting, created according to Paxinos and Franklin, 22 superimposed to a black-and-white photograph of brain sections. D, Comparative analysis of photon emission in brain areas. Numbers on the x-axis correspond to areas in C. Data are expressed as the average photon emission in the area unit (cts/s/mm2) and represent the mean ± SEM (n = 6–10). Statistical differences (*vehicle vs E2; °vehicle vs ICI) are reported: °/*p < .05; °°/**p < .01; °°°/***p < .001. Statistical analysis is described in the Methods section, where actual p values are listed. See the text for abbreviations.
In spite of the relatively high ER activity in the intact mice, treatment with the natural hormone induced a significant increase in slice bioluminescence (see Figure 3, A and B). The average increase in luciferase activity in the 11 slices was +36% over controls; the effect was highest in slice 3 (+64%), and no significant effect was seen in slice 8.
To obtain a more detailed characterization of ER activity in the central nervous system, we attempted to measure photon emission in specific brain areas identified by means of an electronic quantification grid, created according to the Paxinos and Franklin brain atlas (Figure 3C). 22 In unstimulated mice, photon emission varied significantly among the different brain areas taken into consideration, ranging from a value of 2.8 to 4.7 counts/s/area unit (mm2); the highest ER activity was found in the amygdala and motor cortex and the lowest in the arcuate nucleus (Figure 3D). Interestingly, ICI 182,780 decreased ER activity in all brain areas investigated with the exception of piriform cortex and septal nuclei, where the extent of the decrease did not reach a significant value. The generalized decrease observed indicated that the physiologic state of activity of ER in the brain of intact males is sustained. E2 administration was able to increase ER activity in the motor cortex (+33%), piriform cortex (+50%), caudate putamen (+28%), and thalamus (+23%).
We also measured luciferase enzymatic activity in tissue extracts of some of the dissected brain areas and obtained results superimposable to those shown above (data not shown); however, the sensitivity of the enzymatic assay was not sufficient to study ER activity in small brain nuclei such as arcuate or nucleus accumbens of single animals, thus pointing to the significant advantage of using the imaging-based method.
Luciferase Content in Brain Reflects the Fluctuating Production of Ovarian Hormones by Adult Female ERE-Luc Mice
We then investigated the changes in photon emission during the female estrous cycle. Female ERE-Luc mice were daily subjected to vaginal lavages (Figure 4A) to assess the phase of the cycle; mice were euthanized at the desired cycle phase, and brain bioluminescence was measured. Quantitative analysis of photon emission recordings (Figure 4, B and C) showed that in selected brain areas, luciferase activity fluctuates with the progression of the cycle. Consistent with the well-known role of estrogens in the control of hypothalamic and limbic functions, we observed high luciferase activity at proestrus, the phase characterized by high levels of circulating estrogens, and lower activity at metestrus and diestrus. Figure 4 shows that in proestrus, photon emission is significantly higher than in diestrus in the hypothalamus (+60%), arcuate (+105%), septum (+56%), and amygdala (+103%). No significant change was observed in other areas associated with the control of motor activities, such as the caudate putamen. Similar to what was seen with male mice, the brain area expressing the highest content of luciferase at all phases of the cycle was the amygdala (higher than 5 cts/s/mm2).
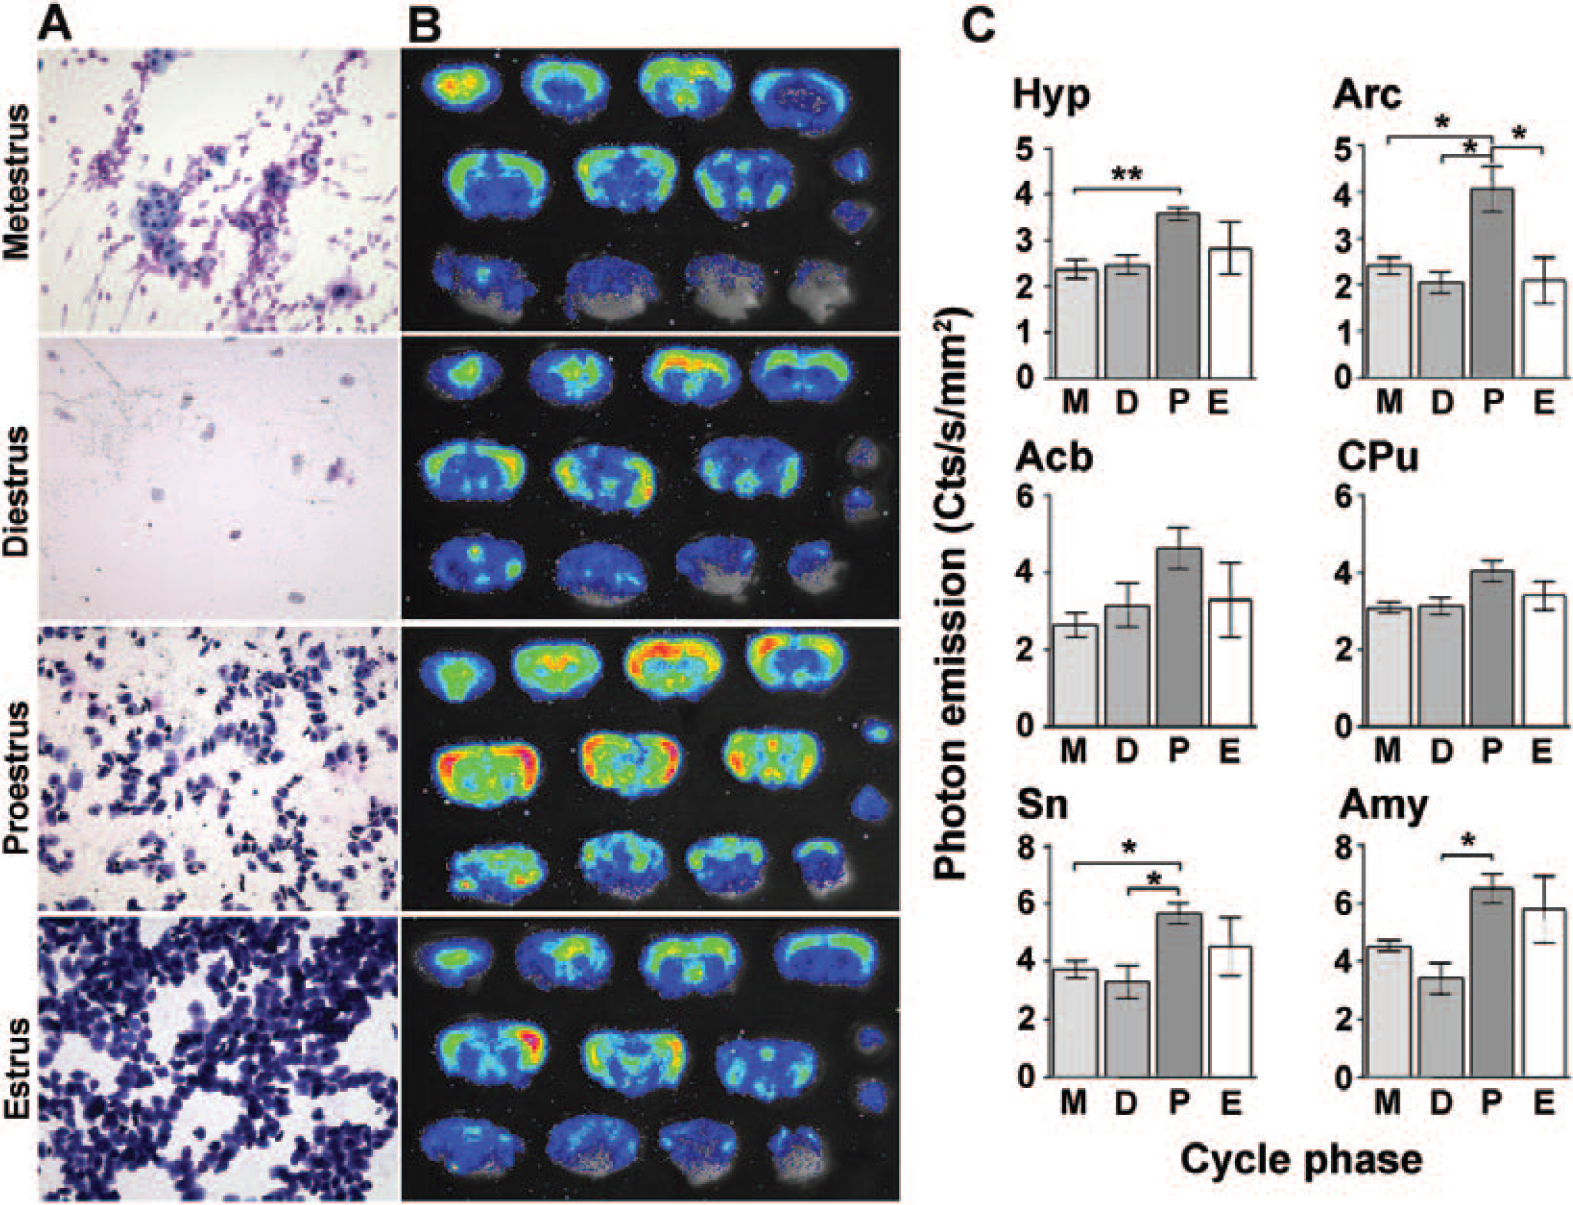
Luciferase activity in the brain of intact, cycling ERE-Luc adult female mice. A, Cytochemistry representative of vaginal lavages stained at the different phases of the estrus cycle (D = diestrus; E = estrus; M = metestrus; P = proestrus). B, Representative optical imaging of female brain sections in each phase of the estrus cycle. C, Photon emission in selected areas of female mouse brain. Data represent the mean ± SEM of at least five animals/phase of the cycle. Statistical analysis is described in the Methods section, where actual p values are listed. See the text for abbreviations.
These data demonstrate at the same time that the new technique we developed is suitable to evaluate the effects of physiologic changes of circulating E2.
ER Activation in Mammalian Brain of Males and of Cycling Females
Previous studies,2,3 carried out by in situ hybridization or by immunohistochemistry, failed to demonstrate significant differences in ER expression in male and female rodent brains. This prompted us to compare the extent of luciferase activity observed in male and female ERE-Luc brains.
In agreement with these findings, we failed to see significant differences in luciferase activity in the two sexes when we compared photon emissions from 11 brain areas of males with emissions of females in diestrus. However, significant differences were found by comparingfemales in proestrus with intact males: in females in proestrus, ER activity is significantly higher than in males in the arcuate nucleus (+ 92%), thalamus (+ 47%), septal nuclei (+ 56%), and hypothalamus (+ 45%) (Figure 5), indicating a higher plasticity of the activity of these receptors in the female brain.

Comparative analysis of luciferase expression in selected brain areas of male and female ERE-Luc intact mice. Photon emission data obtained in the experiments described in Figure 3 and Figure 4 were used to compare photon emission of male and female brains. Numbers on the x-axis correspond to areas in Figure 3C. Data are expressed as the average photon emission unit (cts/s/mm2) and represent the mean ± SEM (n = 6–10 mice per group). Statistical differences (*males vs female proestrus; °female diestrus vs female proestrus) are reported: °/*p < .05; °°/**p < .01; °°°/***p < .001. Statistical analysis is described in the Methods section, where actual p values are listed. See the text for abbreviations.
Discussion
The present study demonstrates that ERs localized in both reproductive and nonreproductive areas of the brain are transcriptionally active and susceptible to regulation by estrogens. The study also shows, for the first time, that the extent of ER activity in the brain of unstimulated male and female mice is comparable and quite elevated. 27 This observation suggests that in brain, the sex hormone receptor has functions that are beyond the control of reproduction. Supporting this view, the activity of ER is quite sustained in males and females and is observed independently from the association of each given brain region to reproductive functions. The finding of high ER activity in male brain is not surprising in view of the widespread expression of aromatase in this tissue; furthermore, we believe that ligand-independent transcriptional activation of ER may occur, triggered by a crosstalk with growth factors and other molecules inducing ER phosphorylation described by several laboratories, including ours.15,24–26,28 The extent to which ER activity changes in males in relation to the daily fluctuation of testosterone remains to be established; on the other hand, the study clearly shows the major influence of the estrous cycle on ER activity in several brain areas: the effect observed in limbic areas such as the hippocampus is of particular interest with regard to the alleged effects of estrogens on memory and affective disorders. Interestingly, ER activity in the amygdala is high in both sexes: this is consistent with the report that ERs are most expressed in amygdaloid nuclei. 4
Moreover, the present study exemplifies how the technique we developed can provide substantial advancement in our capabilities to study brain functions. Prior to our study, attempts to elucidate the potential role of ER and E2 in brain functions relied mainly on in situ and immunohistochemical quantification of ER messenger ribonucleic acid or proteins4,5; however, the use of those techniques could not provide clues on the dynamics of ER transcriptional activity. Our method, on the contrary, offers a very sensitive, reproducible, and accurate way to measure luciferase activity in specific brain areas, enabling us to study the dynamics of ER activity.
The method can be easily expanded to the study of brain activity of transcription factors, protein-protein interaction, or neural cell differentiation or migration, on availability of the suitable reporter animals. In addition, the creation of suitable algorithms will enable the generation of data banks where data can be stored and repeatedly analyzed, thus facilitating comparative studies aimed at understanding the consequences of pathophysiologic events on specific brain functions and at evaluating the effects of pharmacologic treatments in well-focused parts of the brain. The main limitation of this technology is that it is not carried out in living animals. Other laboratories, using animal models aimed at showing more widespread physiological changes (eg, glial fibrillary acidic protein-luciferase to study the inflammatory process), demonstrated that the state of activation of astroglia can be followed in living animals 29 : the resolution achievable in these type of studies, even using instrumentation equipped for three-dimensional imaging, is, however, still quite limited and does not allow us to monitor changes at single brain nuclei level, as described here. The rapidity of the evolution in the field, however, leads us to hope that soon we will also be able to study brain activities in living animals and stimulates us to generate more and more sophisticated animal models for in vivo imaging.
Footnotes
Acknowledgments
We acknowledge the technical assistance of Clara Meda and Monica Rebecchi.
The study was supported by grants from the European Community (STREP EWA LSHM-CT-2005-518245; NoE EMIL LSHC-CT-2004-503569; NoE DIMI LSHB-CT-2005-512146; IP CRESCENDO LSHM-CT-2005-018652) and the National Institutes of Health (RO1AG027713).
Financial disclosure of reviewers: None reported.