
Abstract
Stroke induces a strong inflammatory reaction in the brain and depresses the immune system. We sought to assess longitudinal changes in T-cell numbers in the lymphoid organs of living mice after brain ischemia. Middle cerebral artery occlusion was carried out in transgenic mice expressing green fluorescent protein (GFP+) in the T-cell population under the control of the hCD2 locus control region. Imaging was performed by three-dimensional fluorescence molecular tomography (FMT) before and at several time points after ischemia or sham operation and in controls. At day 7, GFP+ cell content in lymphoid organs was measured postmortem by flow cytometry. GFP+ cell numbers and in vivo FMT signal intensity were reduced at day 7 after ischemia and, to a lesser extent, after sham operation. Linear regression analysis demonstrated that postmortem GFP+ cell numbers and corresponding in vivo FMT data were significantly correlated in the thymus (r2 = .65, p < .0001) and lymph nodes (r2 = .67, p < .0001). These relationships allowed inferring the number of GFP+ T cells from in vivo FMT data. The results show the time course reduction of T-cell content in the lymphoid organs of living mice, providing in vivo evidence of lymphoid organ atrophy after stroke and, to a lesser extent, after head surgery with craniectomy and dura mater opening in sham-operated mice.
STROKE is an acute disease that can cause severe brain damage and is one of the main causes of mortality and disability in the occidental world. The physiopathology of stroke is complex as a wide variety of molecular and cellular events are involved in the development of the brain lesion. 1 Stroke can induce changes in remote organs and trigger systemic responses. Stroke in mice induces an immunodepression syndrome that renders animals more susceptible to infection, 2 which is the main cause of mortality in the transient model of cerebral ischemia. Previous laboratory information agrees with this notion, 3 and in recent years, data supporting the contention that stroke can induce suppression of the immune system have been growing, both in animals3–7 and in humans.8,9 This concept is in concordance with the clinical observation that stroke patients are at high risk of infection.8–10 This effect is due, at least in part, to the apoptotic death of lymphocytes, as evaluated postmortem in lymphoid organs, such as the thymus and the spleen, after experimental brain ischemia,2,3,5,11 and is attributed to the capacity of signals arising after brain damage to modulate immune responses.2,12 We aimed to assess poststroke immunodepression noninvasively in the living animals by imaging lymphoid organs by means of optical imaging. For this purpose, we used three-dimensional fluorescence molecular tomography (FMT)13–17 in transgenic mice expressing green fluorescent protein (GFP+) in T cells under the control of the hCD2 locus control region (LCR). 18
Optical tomographic imaging is regarded as a new biomedical imaging modality that has currently increasing applications in animal research.16,19,20 Optical imaging includes luminescence 21 and fluorescence imaging 22 in living organisms by detecting light at the surface of the animals, typically using a charge-coupled device (CCD) camera for detection. The availability of transgenic animals expressing fluorescent proteins under certain gene promoters23,24 makes fluorescence imaging studies suitable for imaging selective molecular targets.16,25 Furthermore, recent technical developments in instrumentation allow obtaining tomographic fluorescence images in a noninvasive manner using FMT.14,20,26 In the present work, we used FMT to quantify GFP-labeled T-cell content in lymphoid organs at different time points after permanent focal ischemia in the GFP transgenic mice described above. At the last time point, we obtained the tissues postmortem, counted the number of cells in each organ by fluorescence-activated cell sorting (FACS), and correlated the results with those obtained in vivo by FMT.
Materials and Methods
Animals and Brain Ischemia
Experiments were carried out in transgenic mice expressing GFP in all T cells under the control of the human CD2 LCR (hCD2-GFP). 18 The transgenic construct is also active in the early stages of B-cell development, but its expression is diminished as the B cells mature, and no substantial GFP expression is detected in monocytes, neutrophils, and erythrocytes. 18 Transgenic mice were backcrossed for at least 10 generations in the C57Bl/10 (B10) genetic background. All mice were bred under barrier conditions in accordance with established guidelines. Adult mice (22.6 ± 3.3 g body weight) (n = 34) of both genders (40% male and 60% female) were used in this study.
Mice were anesthetized with fluorothane 2% mixed with oxygen 100% using a vaporizer (Lumic International, Baltimore, MD). Permanent focal cerebral ischemia was produced by cauterization of the middle cerebral artery (MCA) using a method adapted from the original technique described in rats. 27 Sham-operated animals were subjected to head surgery, with craniectomy and opening the dura mater to expose the MCA, but the artery was not occluded. Animals were allowed to recover and were sacrificed 7 days later. The presence of cortical infarction was visually assessed postmortem in the brain of all ischemic mice. Ischemic (n = 14), sham-operated (n = 10), and nonoperated (control, n = 8) mice were studied.
Flow Cytometry Analysis
Single-cell suspensions were prepared from the thymus, spleen, cervical lymph nodes, and blood. Peripheral blood (100 µL) from the tail vein was collected in heparinized (250 U) tubes and transferred to FACS tubes that were washed with phosphate-buffered saline (PBS)/0.02% NaN3 and spun 10 minutes at 270g. After the supernatant was removed, 1 mL of erythrocyte FACS lysing solution (BD Biosciences, San Jose, CA) was added to the pellet and incubated for 15 minutes in the dark. Samples were washed twice, and the new pellet was resuspended with 300 µL of PBS/0.02% NaN3 before FACS analysis. Tissues were dissected under a fluorescence stereoscope and dissociated in 5 mL of Hanks' Balanced Salt Solution supplemented with 10 mM Hepes and 5% fetal bovine serum and passed through a 40 µm nylon cell strainer. For the thymus and lymph nodes, the suspension was used for FACS analysis. Erythrocytes were removed from splenocyte preparations by quick water lysis. The percentage of GFP+ cells was measured by flow cytometry on a FACSCalibur flow cytometer (BD Biosciences) and analyzed with CellQuest software (BD Biosciences). The total number of cells was determined after sample counting in an hemocytometer, and then the total number of GFP+ cells per organ was calculated using FACS data.
FMT Setup
The FMT system used here is a recently developed in-house setup, the schematics of which are shown in Figure 1. The mouse was placed horizontally on a fixed stage at a known distance from a CCD camera and objective. For the excitation of GFP, the 488 nm line of a continuous waveAr+-Laser (LaserPhysics, Reliant 1000m, West Jordan, UT) was guided via mirrors into a galvomirror scanning device (Scancube 7, ScanLab AG, Puchheim, Germany) that produced a ≈2 mm spot on the plane in focus of the camera. Images were taken with a 16-bit CCD camera, cooled down to −70°C, with a chip size of 1,024 × 1,024 pixels (DV434, Andor Corp, Belfast, Northern Ireland) and a 2 × 2 binning, equipped with a 50 mm f/2.8 objective (Sigma Corporation, Tokyo, Japan). To obtain quantitative data for each source position and projection, two measurements were taken: one corresponding to the fluorescence emission and one corresponding to the excitation wavelength. By normalizing fluorescence with excitation measurements, we auto-calibrate for most constant gain factors and minimize the error introduced by deviations in the propagation model used for the inverse problem. The details of this approach have been described. 28 For recording emission and excitation, a 10 nm bandpass filter centered at 510 nm and a 60 nm bandpass filter centered at 488 nm, respectively, were used. In all cases, measurements were taken in the reflection mode by guiding the laser beam with two mirrors (see Figure 1), placing the mouse on a supine position, and preparing it in such a way that the imaged area could be approximated to a flat surface. Data acquisition was performed on a 3.0 GHz personal computer with 512 MB RAM, controlled by custom-designed software in the LabVIEW (National Instruments, Austin, TX) environment.

Fluorescence molecular tomography setup. The setup used for in vivo quantitative imaging of green fluorescent protein concentration used here mainly comprises a laser source directed toward the subject using mirrors and a galvoscanner and a charge-coupled device (CCD) camera for data collection. Power delivery is monitored using a powermeter measuring light obtained through a beam-splitter placed in the light path. Appropriate filters placed in front of the objective of the CCD camera are used to select the emission or excitation intensity distribution on the surface of the animal.
Data Acquisition
Owing to the black fur of B10 mice, the preparation of the subjects for the experiment included shaving to expose the skin at the region of interest. For the shaving procedure and image acquisition, mice were lightly anesthetized with fluorothane 2% mixed with oxygen 100% using a vaporizer (Lumic International). The mixture was adjusted until normal breathing frequency was acquired to minimize movement owing to muscle contraction. The output of the vaporizer could be directed into the imaging chamber for maintaining anesthesia throughout the measurements or into a custom chamber when attaching a mouse to the holder. Regarding the shaving procedure, we first trim the hair with an ordinary hair-cutting machine, removing the remaining hair by using hair removal cream (Nair). The shaving cream is left for a maximum of 2 minutes, and then the area is rinsed thoroughly with lukewarm water and the exposed skin is dried with a pad.
For the experiment, the mouse was placed and fixed on the stage. Eighty-one sources arranged on a 9 × 9 grid were chosen using our custom LabVIEW software so that the areas of interest were covered, using typical areas of 1.2 × 1.6 cm and 0.8 × 11 cm for the cervical lymph nodes and thymus, respectively. Then the fluorescence and excitation signals were acquired with the corresponding filters using exposure times of 0.05 seconds. The laser power delivered to the mouse was typically 35 and 0.002 mW for the fluorescence and excitation measurements, respectively. One image was recorded for each source position, resulting in a 81 × N × M array of images for each filter used, where N and M are the number of pixels in x and y dimensions, respectively (512 × 512 in our measurements after a 2 × 2 binning). Typical experimental times were 10 minutes for each imaged area (thymus, cervical lymph nodes), including both excitation and emission measurements.
FMT Data Analysis
The FMT data analysis was carried out by defining regions of interest in the cervical lymph nodes and thymus. To retrieve information on the spatial distribution of fluorescent protein concentration in volume, 100 fluorescence measurements normalized with excitation from 81 different source positions were used, using the normalized Born approximation. 28 The diffusion approximation for a semi-infinite medium 29 was used to model light propagation and inverted using 10 iterations of the algebraic reconstruction technique with positive restriction. 30 Typical inversion times were on the order of 2 minutes once the data was preprocessed and normalized.
Statistical Analyses
Comparisons between groups (control, sham, ischemic) or between time points (0, 1, 2, 4, and 7 days) were made with one-way analysis of variance (ANOVA). Comparison by group and time point was carried out with two-way ANOVA. A Bonferroni multiple comparisons test was used for post hoc analysis. Linear regression analysis was performed to study the correlation between the number of GFP+ T cells evaluated postmortem by FACS and the corresponding FMT value. Statistical analyses were carried out with GraphPad Prism software.
Results
General Features
Permanent occlusion of the MCA in mice with the technique used here induces a brain infarct restricted to the ipsilateral parietal cortex. Two animals of the ischemic group died spontaneously during the 7-day course of the experiment and were excluded from the study.
The body weight (mean ± SD) of the animals at day 0 was similar for the different experimental groups: 22.8 ± 3.8 g, 22.5 ± 2.9 g, and 23.0 ± 3.5 g for control, sham-operated, and ischemic groups, respectively. At day 4, the corresponding body weight was 22.2 ± 3.9 g, 22.9 ± 1.7 g, and 21.6 ± 2.6 g, respectively. A significant (p < .05) reduction (6%) in body weight (day 4 vs day 0) was detected in the ischemic group compared with controls (Figure 2A). At day 7, body weight was 22.7 ± 2.9 g, 22.0 ± 2.2, and 20.6 ± 2.9, respectively, but the change (day 7 vs day 0) was not statistically different at this point.

Systemic alterations induced by ischemia. A, Body weight shows a small (6%) but significant reduction (*p < .05, one-way analysis of variance [ANOVA]) at day 4 versus day 0 after permanent middle cerebral artery occlusion (ischemia). Values are expressed as the difference between day 4 and day 0. B, The weight of the thymus is 60% reduced at 7 days postischemia (**p < .01, one-way ANOVA). C, The percentage of green fluorescent protein–positive (GFP+) cells in blood is significantly reduced at 2 days postischemia (*p < .05, two-way ANOVA by time and group followed by a post hoc Bonferroni test). D, Ischemia significantly reduces total numbers of GFP+ cells in the spleen at day 7 as assessed postmortem by fluorescence-activated cell sorting (one-way ANOVA followed by a post hoc Bonferroni multiple comparison test, **p < .01).
The weight of the thymus (mean ± SEM) at day 7 was 42.3 ± 4.2 mg (n = 7), 26.5 ± 7.8 mg (n = 6), and 16.0 ± 1.7 mg (n = 9) for the control, sham, and ischemic groups, respectively. Permanent ischemia significantly (p < .01) decreased (by 60%) thymus weight at day 7 (Figure 2B). In addition, ischemia induced a significant reduction in the percentage of GFP+ cells in blood at day 2 (Figure 2C) and in the number of GFP+ cells in the spleen (p < .01), as assessed post-mortem with FACS at day 7 (Figure 2D). These findings provide evidence of alterations in the immune system after permanent focal ischemia in the mouse.
Fluorescence Molecular Tomography
The signal intensity in the target organ volume was determined by FMT in the thymus and cervical lymph nodes. Representative images are shown in Figure 3 for a control mouse. The signal from lymph nodes and thymus was superimposed to the reference white-light image of the mouse in Figure 3A. The detailed reconstructed volumes for the cervical lymph nodes and thymus are shown in Figure 3B and Figure 3C, respectively. The intensity of the fluorescent signal is represented in false color from blue (the lowest) to red (the highest).

Fluorescence molecular tomographic (FMT) images of the cervical lymph nodes and thymus. A, Typical FMT reconstructions for the cervical lymph nodes and thymus. The color map of signal intensity (blue is low and red is high) is proportional to the T-cell concentration (see Figure 5). B and C show the reconstructed volume in detail for the lymph nodes and thymus, respectively, the surface rendering obtained for values at 50% of the maximum reconstructed value.
GFP+ Cells in Thymus and Lymph Nodes: In Vivo FMT and Postmortem Evaluation
Mice were studied by FMT at several time points up to 7 days after ischemia or sham operation. Typical FMT reconstructions for control, sham, and ischemic mice are shown in Figure 4. We describe first the FMT results obtained at day 7 as these values were compared with corresponding data of the actual number of GFP+ cells that was determined postmortem in the same animals by FACS. Measures of the FMT signal in the thymus and lymph nodes at day 7 are shown in Figure 5, A and 5C, respectively. A significant decrease in FMT signal was observed in both the thymus (p < .001) and lymph nodes (p < .05) after ischemia. Also, a less marked but significant (p < .01) reduction in the FMT signal from the thymus was observed in sham-operated mice versus controls (see Figure 5A), indicating that the surgery procedure required for sham operation induced some regression of the lymphoid organs likely attributable to an effect of stress.

Fluorescence molecular tomographic (FMT) images for control, sham, and ischemic mice at day 7. Typical FMT reconstructions for control, sham-operated, and ischemic mice for cervical lymph nodes and thymus. The upper part of each panel shows a superposition of the fluorescence signal with a reference photograph of the animal. The lower part of each panel shows an image representation of the fluorescence in the z and x axes. The color scale of signal intensity (blue is low and red is high) is proportional to the T-cell concentration (see Figure 5).
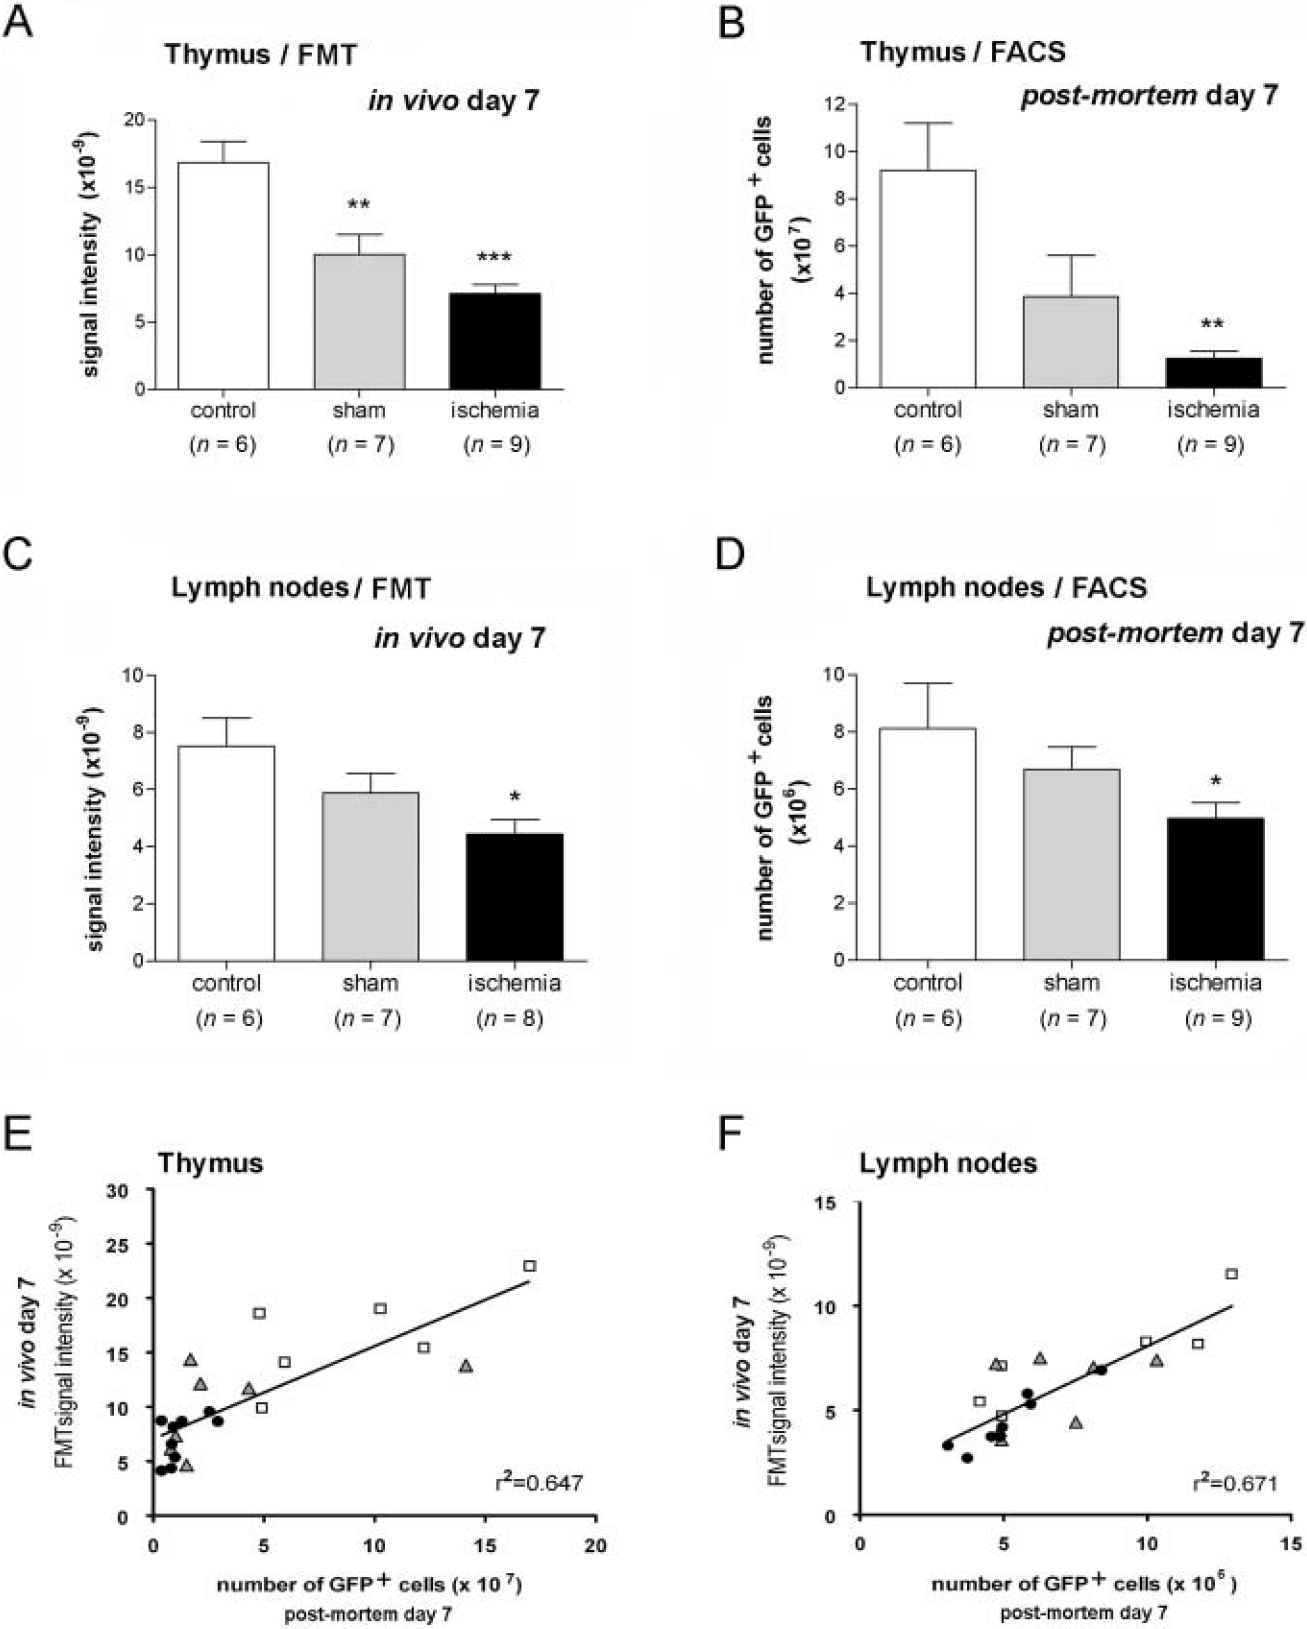
Correlation between green fluorescent protein (GFP)-positive (GFP+) T lymphocytes and fluorescence molecular tomographic (FMT) signal in lymphoid organs at day 7. A and C, Measurements of FMT signal intensity obtained in vivo in the thymus (A) and lymph nodes (C) at day 7. B and D, The content of GFP+ cells in these lymphoid organs was determined postmortem in the same animals by flow cytometry. Ischemia significantly reduces FMT signal intensity (A and C) and total numbers of GFP+ cells (B and D) compared with controls. Similar, but less marked, effects are observed in sham-operated animals (A–D). E and F, In vivo FMT values are related to the corresponding number of GFP+ cells as evaluated postmortem by flow cytometry in the thymus (E) and lymph nodes (F). Linear regression analysis shows a significant correlation between these two independent parameters (p < .0001). The goodness of the fit was assessed by r2. Points represent individual animals. Statistical analyses were carried out by one-way ANOVA followed by a post hoc Bonferroni multiple comparison test. FACS = fluorescence-activated cell sorting. *p < .05; **p < .01; ***p < .001 versus control.
Postmortem FACS analysis of GFP+ cells in the lymphoid organs of the same animals at day 7 showed that ischemia significantly reduced the total numbers of GFP+ cells (vs controls) in the thymus (p < .01) (Figure 5B) and lymph nodes (p < .05) (Figure 5D). As for FMT findings, a comparatively less marked effect was observed in sham-operated mice.
In Vivo FMT Measures Correlate with the Number of GFP+ Cells Determined Postmortem
The FMT values obtained in vivo at day 7 correlated with the number of cells measured postmortem with FACS at this time point in the same animals. Linear regression analysis showed a significant (p < .0001) positive correlation in the thymus (r2 = .65, p < .0001) and lymph nodes (r2 = .67, p < .0001), illustrating that quantitative FMT values are proportional to the number of fluorescent cells (Figure 5, E and F). This relationship allowed inferring information on the approximate number of T cells present in each organ from the FMT data obtained in vivo.
Time Course In Vivo Measurement of the Number of GFP+ Cells in Lymphoid Organs
The time course of the FMT signal was studied in the same animals by exploring them before ischemia or sham operation and at 1, 2, 4, and 7 days. Nonoperated mice were studied at the same time points as reference controls to investigate any possible alterations owing to repeated anesthesia and animal manipulation. The FMT signal measured in vivo in the thymus was significantly (p < .05) reduced in ischemic animals at days 4 and 7 compared with corresponding controls (Figure 6A) (two-way ANOVA, by condition and time, followed by a Bonferroni test). Within the ischemic group, the time course evolution showed a reduction in the signal (p < .01) at days 4 and 7 versus day 0 (one-way ANOVA and post hoc Bonferroni test). In the lymph nodes, a significant reduction (p < .05) was found at day 7 after ischemia versus corresponding day 0 (Figure 6B). No significant differences were found in the control and sham-operated groups in the thymus and lymph nodes.
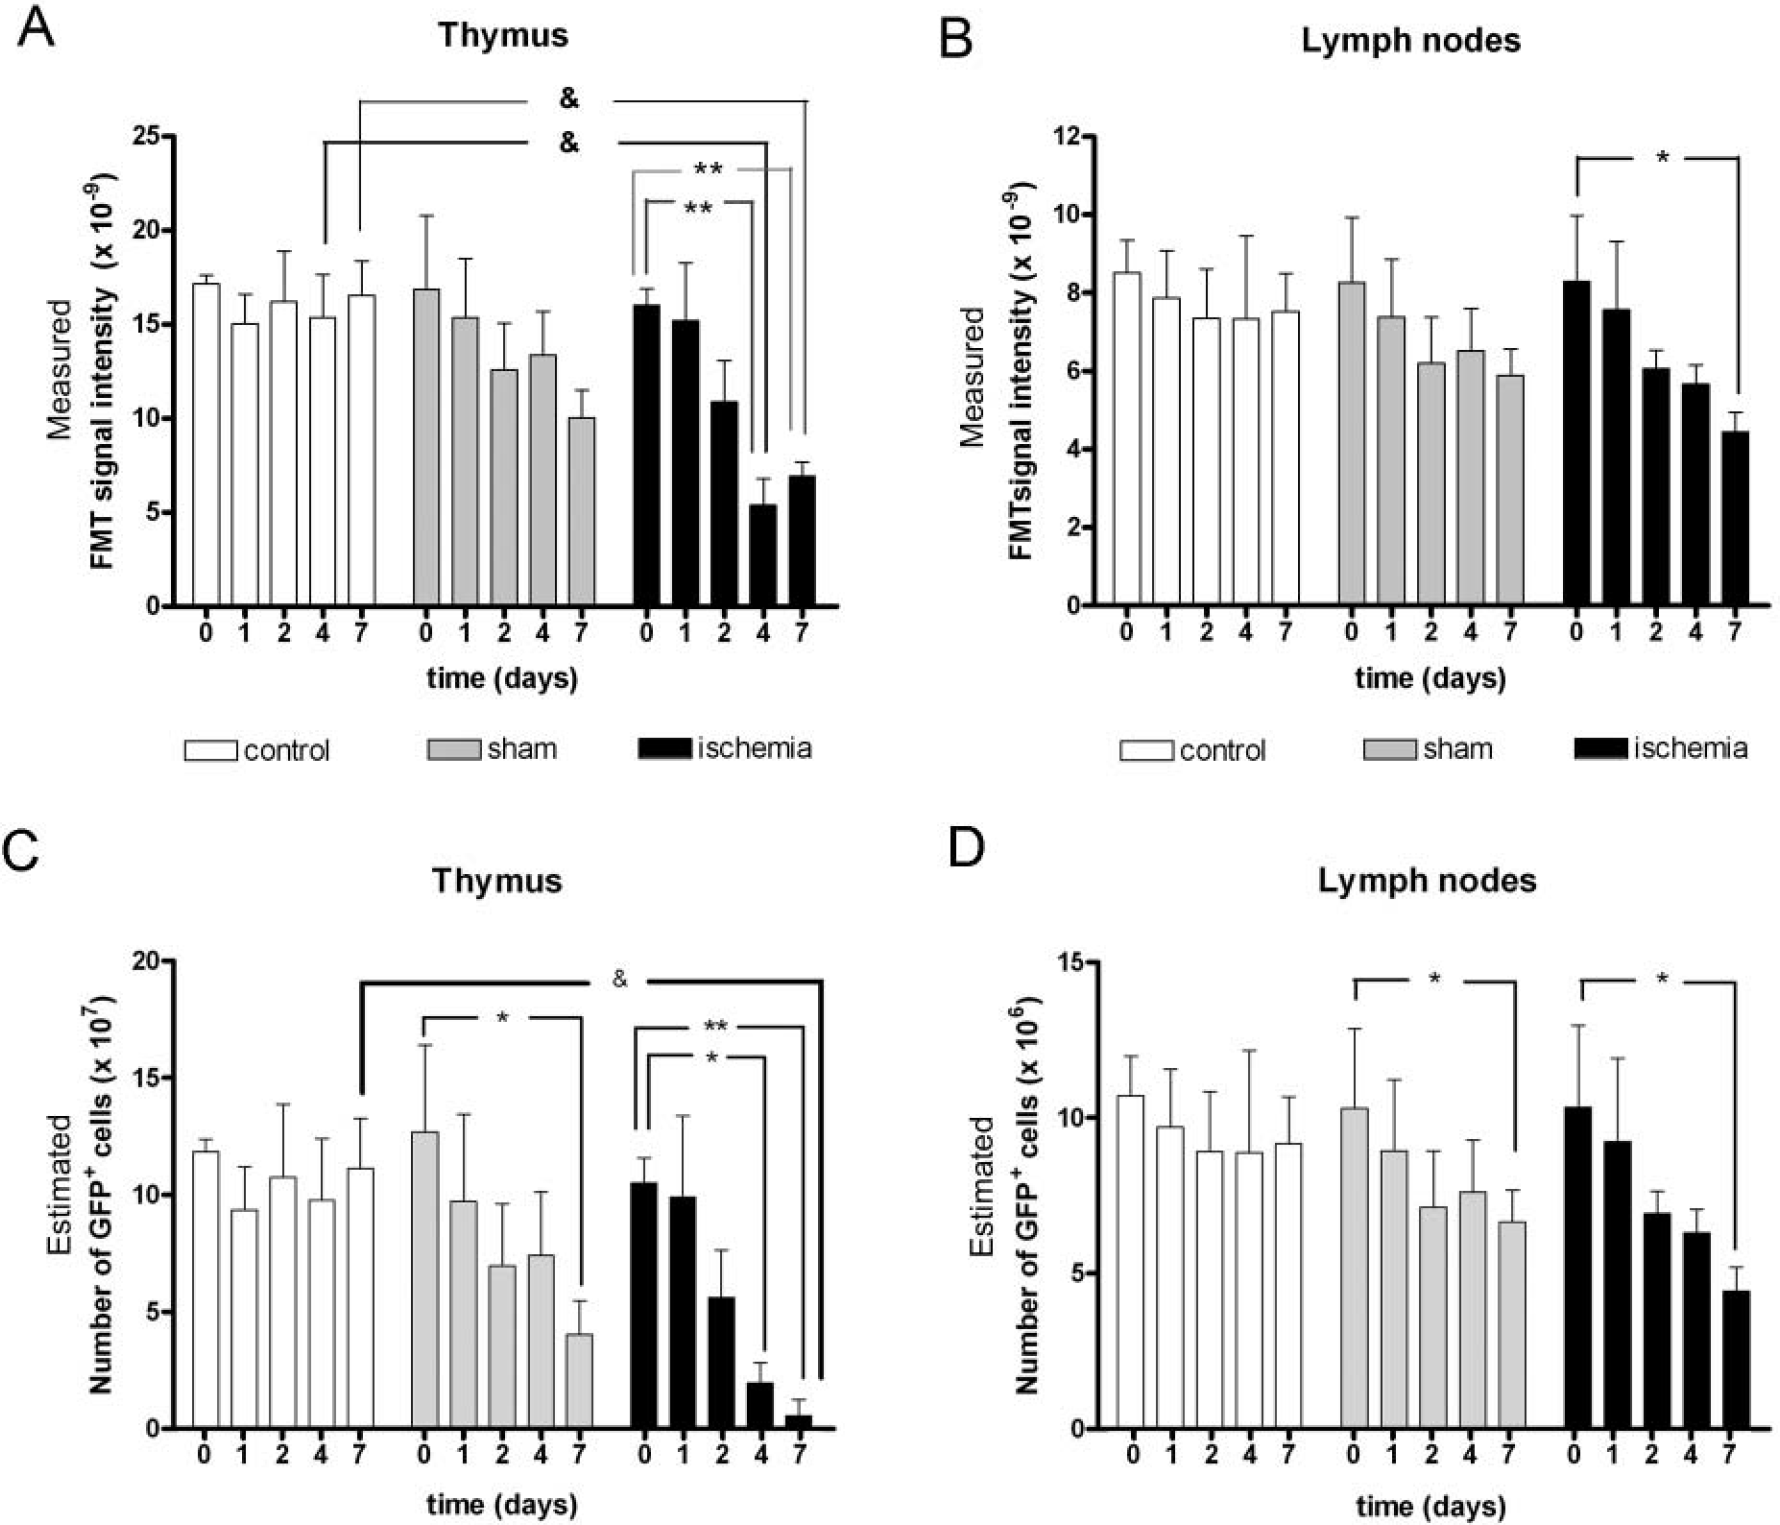
Time course of fluorescence molecular tomographic (FMT) signal and the number of green fluorescent protein-positive (GFP+) T cells inferred from FMT data. Mice were repeatedly examined by FMT before (time = 0) ischemia or sham operation and 1, 2, 4, and 7 days later. Nonoperated mice were also repeatedly examined at the same time points and were used as controls. The measured FMT values at the different experimental times and groups are shown in A and B, whereas the estimated corresponding numbers of GFP+ cells are shown in C and D. The number of GFP+ T cells per organ was calculated from the FMT data obtained at the different time points by using the linear correlation between FMT data and postmortem GFP+ T-cell number (see Figure 5, E and F). Values are shown for the thymus (A and C) and lymph nodes (B and D). For measured FMT values (A and B), two-way analysis of variance (ANOVA) by condition (ischemia, sham, control) and time followed by the Bonferroni test showed a significant reduction in the ischemic groups at days 4 and 7 versus corresponding controls (&p < .05). Within the ischemic group, one-way ANOVA revealed a reduced FMT signal (**p < .01) at days 4 and 7 compared with day 0 in the thymus (A) and a reduction (*p < .05) at day 7 versus day 0 in the lymph nodes (B). Regarding the estimated number of GFP+ cells (C and D), two-way ANOVA by condition and time point followed by the post hoc Bonferroni test identified a significant reduction in the number of GFP+ T lymphocytes at 7 days postischemia in the thymus (&p < .05 vs control at day 7), showing that the thymus was more severely affected by ischemia at day 7 than by any other condition or at any other time point. In addition, one-way ANOVA within the ischemic group also demonstrated a reduction in GFP+ T-cell number from day 0 to days 4 and 7 in the thymus (C) and from day 0 to day 7 in the lymph nodes (D). This latter analysis also supports the appearance of changes from day 0 to day 7 in the sham-operated mice in both the thymus (C) and lymph nodes (D). *p < .05; **p < .01 versus corresponding day 0.
The number of GFP+ lymphocytes in each organ was calculated from the FMT signal data by using the linear regression curve that correlated both measures (see Figure 5, E and F). A significant reduction in the estimated number of GFP+ cells was found at day 7 (p < .05) in the thymus in relation to controls by two-way ANOVA (by condition and time point) (Figure 6C). One-way ANOVA showed significant differences within the ischemic group from day 0 to days 4 (p < .05) and 7 (p < .01). Also, significant (p < .05) differences were found within the sham-operated group from day 0 to day 7. No changes in the calculated number of GFP+ cells in the thymus were detected within the control group at the different time points studied (see Figure 6C). In the lymph nodes, a significant (p < .05) reduction was detected within the ischemic group from day 0 to day 7 (Figure 6D). In addition, the number of T lymphocytes in sham-operated mice decreased at day 7 versus day 0 (p < .05) (see Figure 6D). No changes in the number of GFP+ cells in the lymph nodes were detected within the control group at the time points studied (see Figure 6D).
Discussion
This study shows that FMT allows visualizing and quantifying in vivo changes in the number of T cells in lymphoid organs of transgenic mice expressing GFP+ in the whole T-cell population. This work extends to a pathologic condition our previous result showing the feasibility of studying the thymus of healthy animals in vivo by FMT. 13 By using this technique, we demonstrated in the living mice a significant loss of T lymphocytes following brain ischemia. This finding shows that imaging changes in lymphocyte number in vivo are achievable by using quantitative FMT in GFP transgenic mice. To our knowledge, this is the first imaging study showing in vivo signs of stroke-induced immunodepression.
The majority of optical imaging studies rely on the use of nontomographic systems. Planar images from fluorescent probes have useful applications, particularly in the field of oncology.31,32 However, the main limitations of planar fluorescence imaging are that it has a lack of depth resolution, restricts exploration to the surface of the organisms, and precludes providing fully quantitative data since the fluorescence signal is not linearly related to depth location. 16 These limitations can be circumvented, at least in part, with the recent technical developments in instrumentation that allow obtaining tomographic fluorescence images in a noninvasive manner using FMT. 14 In FMT, the animal receives light sequentially from several sources, the emitted light is captured by detectors arranged in a spatially defined order, and data are mathematically processed for the reconstruction of the concentration of fluorophore or fluorescent protein in a selected volume of the animal.13,14,20 Here we show that quantitative volumetric tomographic optical images can be successfully obtained from GFP in the mice, in agreement with previous works.13,17 FMT offers three-dimensional information on the location and intensity of the fluorescent signal but does not provide anatomic information. In the present study, additional anatomic information was not essential since the lymphoid organs under study are well defined. However, in cases in which the origin of the fluorescence is unknown, hybrid imaging modalities (FMT and computed tomography, for example) or another type of anatomic information may be necessary. 33
A main finding in our study is the linear correlation between the volumetric quantitative measures of GFP optical signal intensity in a lymphoid organ, as measured with FMT, and the corresponding number of T lymphocytes, as determined postmortem with flow cytometry. This relationship allowed estimating the number of GFP+ T cells in vivo in certain lymphoid organs, such as the thymus and cervical lymph nodes. In these organs, we found that the FMT signal was reduced from 0 to 7 days in ischemic animals. Then the number of GFP+ cells at different time points in the living animals was estimated from FMT data, under the assumption that the relationship between these two parameters (measured at day 7) was maintained at the different experimental time points. In spite of the fact that this quantitative procedure is an approximation to the actual value of T cells, it is sensitive enough to detect in vivo immune alterations induced by brain ischemia in lymphoid organs. This technological development and its application provide an experimental system to monitor in vivo the impact of stroke in the immune system—an issue that has clinical relevance for stroke patients.
Prass and colleagues showed that ischemia-reperfusion in mice induces an immunodepression syndrome that is mediated by reduced numbers of thymocytes and increased apoptotic cell death of CD4+, CD8+, and CD4+CD8+ T-cell populations in the thymus. 2 In agreement with these findings, we report a drastic reduction in the total number of T lymphocytes in the thymus after permanent ischemia in mice. In addition, we report that the number of T cells was reduced in the lymph nodes at 7 days after permanent ischemia, as evaluated postmortem by flow cytometry and in vivo by FMT. This is the first study reporting lymph node atrophy after stroke and demonstrating this effect in a noninvasive manner in the living mice. In the present study, we did not measure the FMT signal in the spleen in the living animals owing to the high blood content of this organ, which offers an additional technical difficulty as fluorescence by spleen GFP+ cells cannot be discriminated in vivo from that owing to blood GFP+ cells. However, we measured ex vivo the number of GFP+ cells in the spleen obtained postmortem at day 7. We found that permanent brain ischemia induced a significant reduction in the total number of T lymphocytes in the spleen at day 7, in agreement with previous reports showing decreased spleen cell numbers affecting all leukocyte populations following ischemia-reperfusion in mice 2 and rats. 3 Our results also agree with the reported strong atrophy of the spleen 4 days after ischemia-reperfusion in mice, with loss of germinal centers and a reduced number of splenocytes. 5 This effect is attributable to increased splenic apoptotic cell death affecting, in a similar manner, B cells, T cells, and natural killer cells.2,5
Previous evidence supporting stroke-induced alterations in the immune system has been gathered in experimental models of ischemia-reperfusion.2,6 Our findings in the permanent ischemia model in mice demonstrate that stroke-induced immunodepression also occurs in the absence of reperfusion. The experimental model used here causes infarction in a small cortical region and has the advantage of being very reproducible but the disadvantage of being very invasive. This is expected to induce stress in the animals, which is likely to underlie the non-negligible changes observed here after sham operation. Parietal craniectomy in rats has been reported to induce several changes in the brain, including alteration of brain permeability, in the absence of brain damage. 34 Our study shows that this procedure can induce changes in the immune system that deserve further investigation. MCA occlusion caused a further depression in T-lymphocyte numbers in lymphoid organs, showing an effect strictly attributable to acute ischemic brain damage. However, in this study, we did not address the issue of whether the magnitude of immune responses might be related to the severity of ischemia. Further studies in animals with variable degrees of ischemic brain damage would be more appropriate to answer this question. The brain is wired to the immune system and exerts control of immune responses by neural and humoral pathways involving the release of catecholamines and glucocorticoids.8,12 These mediators are known to be released under stress conditions 35 and after acute brain damage, such as that induced by stroke.12,36 The immune effects after brain ischemia are essentially attributed to the action of the sympathetic nervous system and can be prevented by the β-blocker propranolol. 2 Stroke-induced immune alteration is now also recognized in patients.8,9 This condition is regarded as a main contributor to the well-described increased risk of infection in stroke patients.8–10,37
In brief, we have shown that the new technological developments make FMT a reliable method to quantify in vivo the number of T cells in the lymphoid organs of transgenic mice expressing GFP in the T-lymphocyte population. By applying this new technology to an experimental model of cerebral ischemia in mice, we have demonstrated the feasibility to monitor in vivo signs of stroke-induced immunodepression after brain ischemia.