
Abstract
Antibody-conjugated iron oxide nanoparticles offer a specific and sensitive tool to enhance magnetic resonance (MR) images of both local and metastatic cancer. Prostate-specific membrane antigen (PSMA) is predominantly expressed on the neovasculature of solid tumors and on the surface of prostate cells, with enhanced expression following androgen deprivation therapy. Biotinylated anti-PSMA antibody was conjugated to streptavidin-labeled iron oxide nanoparticles and used in MR imaging and confocal laser scanning microscopic imaging studies using LNCaP prostate cancer cells. Labeled iron oxide nanoparticles are internalized by receptor-mediated endocytosis, which involves the formation of clathrin-coated vesicles. Endocytosed particles are not targeted to the Golgi apparatus for recycling but instead accumulate within lysosomes. In T1-weighted MR images, the signal enhancement owing to the magnetic particles was greater for cells with magnetic particles bound to the cell surface than for cells that internalized the particles. However, the location of the particles (surface vs internal) did not significantly alter their effect on T2-weighted images. Our findings indicate that targeting prostate cancer cells using PSMA offers a specific and sensitive technique for enhancing MR images.
Iron oxide nanoparticles offer significant advantages over other potential contrast agents in that they have very strong signal effects in MR imaging, 3 with a detection limit in the subnanomolar range. 4 The MR signal is due to the response of surrounding water molecules (ie, protons) to an external magnetic field. Radiofrequency energy is used to excite the water protons, and as the water protons relax, they create signals detected in MR imaging. Contrast agents enhance both the longitudinal and transverse relaxation rates, creating regions with positive and negative enhancement. 3
Labeled with the appropriate antibodies to plasma membrane antigens, nanoparticles offer great specificity in addition to sensitivity.5,6 One potential cell surface antigen, overexpressed in prostate tumors, is prostate-specific membrane antigen (PSMA). PSMA is a homodimeric type II transmembrane glycoprotein highly expressed by almost all prostate cancers. 7 PSMA is also expressed on the tumor vascular endothelium of virtually all solid carcinomas but not on normal vascular endothelium. 8 PSMA expression correlates with tumor grade, pathologic stage, aneuploidy, and biochemical recurrence, 9 making PSMA an excellent candidate for monitoring the progression of prostate cancer.
In this study, using flow cytometric analysis and confocal laser scanning microscopic imaging, we show specific binding of PSMA antibody–labeled nanoparticles to PSMA-positive LNCaP cells, with no labeling of PSMA-negative DU145 cells. Additionally, labeling of cells with iron oxide nanoparticles is readily detected as a significant change in signal intensity in MR images obtained by standard methods. The nanoparticles accumulate in clusters on the cell surface and are subsequently internalized by receptor-mediated endocytosis. Once internalized, the nanoparticles are aggregated within vesicles, modifying the contrast observed in T1-weighted nuclear magnetic resonance (NMR) images. Eventually, the nanoparticles are delivered to lysosomes for degradation.
Materials and Methods
Materials
MACS Streptavidin μMACS (50 nm) iron oxide nanoparticles were obtained from Miltenyi Biotec (Auburn, CA), and humanized mouse anti-PSMA antibody (MLN591) was supplied by Millennium Pharmaceuticals Inc. (Cambridge, MA). LNCaP and DU145 cells were purchased from the American Tissue Type Collection (Manassas, VA). Chlorpromazine hydrochloride and bovine albumin were purchased from Sigma-Aldrich (St. Louis, MO).
Cell Culture
LNCaP and DU145 prostate cancer cells were cultured in RPMI-1640 medium (Fisher, Pittsburgh, PA) supplemented with 10% heat-inactivated fetal bovine serum (Hyclone, Logan, UT), 100 U/mL penicillin, 100 μg/mL streptomycin, 0.25 μg/mL amphotericin B (Fungizone, Invitrogen, Carlsbad, CA), and 2 mM
Antibody Biotinylation
Anti-PSMA antibody (MLN591) was labeled with biotin using the FluoReporter Mini-Biotin-XX Protein Labeling Kit (Molecular Probes, Eugene, OR) according to the supplied instructions. Briefly, the antibody was incubated with stirring in 0.1 M sodium bicarbonate solution containing biotin-XX, sulfosuccinimidyl ester, and sodium salt for 1.5 hours at room temperature. Free biotin was removed using the provided spin column. The FluoReporter Biotin Quantitation Assay Kit (Molecular Probes), a sensitive fluorometric assay, was used to determine the average number of biotin labels per antibody.
Flow Cytometry
In the initial flow cytometry experiment (Figure 1), LNCaP and DU145 cells were incubated with 10 μg/mL 3C6 anti-PSMA antibody (Northwest Biotherapeutics, Bothell, WA) on ice for 30 minutes. After washing with phosphate-buffered saline (PBS) containing 0.1% bovine serum albumin (BSA) and 0.1% azide (fluorescence-activated cell sorter [FACS] wash buffer), a phycoerythrin conjugate of rat antimouse antibody (10 μg/mL) (BD Biosciences, Palo Alto, CA) was added for an additional 30 minutes on ice. Cells were then washed and analyzed immediately using a Becton Dickinson FACScan Flow Cytometer equipped with a 488 nm argon laser and CellQuest software (San Jose, CA).
Antibody Conjugation to Nanoparticles
MACS Streptavidin μMACS (ie, nanoparticles, 50 nm total diameter, ≈60 wt. % iron oxide) (500 μL) were incubated with biotinylated MLN591 or biotinylated antihuman immunoglobulin G (IgG) (Sigma-Aldrich) (200 μg) antibody for 1 to 1.5 hours at room temperature. Prior to incubation, preservatives were removed from the magnetic particles by washing with PBS. As a final step, unbound antibody was removed from the antibody-conjugated nanoparticle solution using MACS Micro columns, and cells were eluted in PBS containing 0.1% BSA to a final volume of 200 μL.
Concentration of Antibody Bound to Particles
The amount of antibody available for binding to cell surface PSMA in labeled nanoparticles was determined by comparing cell surface labeling of free antibody with that of nanoparticle-conjugated antibody. LNCaP cells were incubated with either 0 to 20 μg/mL free antibody or 2.5 to 25 μL of nanoparticle-conjugated antibody for 30 minutes on ice in FACS wash. After washing, cells were incubated with 10 μg/mL goat antihuman IgG antibody conjugated to fluorescein (Pierce, Rockford, IL) for 30 minutes on ice. Cells were fixed in 2% formalin after a final wash, and data were acquired by flow cytometry.
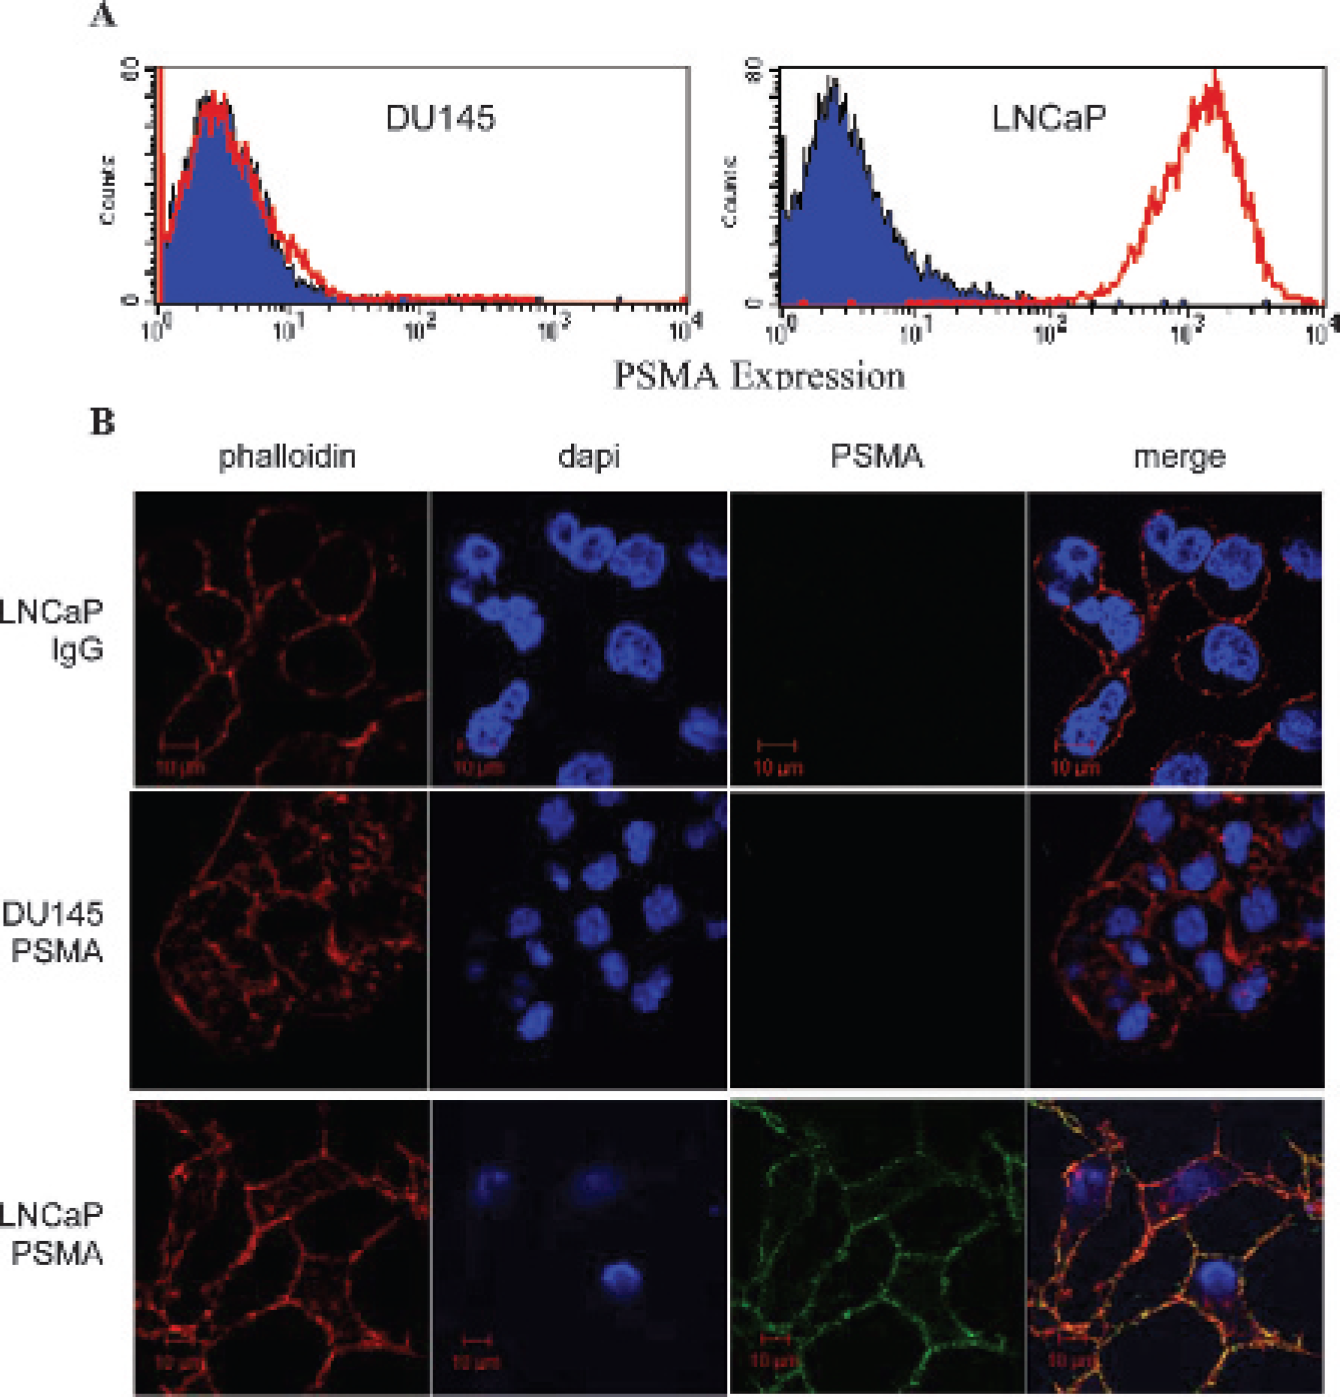
Iron oxide nanoparticles specifically label prostate-specific membrane antigen (PSMA)-expressing cells. A, LNCaP cells express high levels of PSMA on their cell surface, whereas DU145 cells lack PSMA expression. LNCaP and DU145 cells were labeled with anti-PSMA antibody and analyzed by FACS analysis. B, Streptavidinconjugated iron oxide nanoparticles were labeled with either biotinylated anti-PSMA J591 antibody or a biotinylated isotype control antibody. LNCaP and DU145 cells were incubated with the antibody-conjugated nanoparticles at 4°C, followed by labeling with goat antihuman Alexa Fluor 488–labeled antibody. Cells were then fixed and permeabilized with Triton X-100 for labeling with Alexa Fluor 555 phalloidin. Confocal microscopy images demonstrate specific binding of anti-PSMA antibody–conjugated nanoparticles to the surface of LNCaP cells, with no binding to DU145 cells. The isotype control antibody–conjugated nanoparticles did not bind to LNCaP cells.
Rate of Particle Internalization
The rate of particle internalization was determined by the method of Lammerts van Bueren and colleagues. 10 LNCaP cells (5 × 10⁵/measurement) were incubated with 10 μL anti-PSMA antibody–conjugated nanoparticles (containing 110 μg iron/mL) or 10 μg/mL free antibody on ice for 30 minutes, followed by two washes in FACS wash buffer. Each sample was then placed at 37°C for one of the following intervals: 0, 5, 10, 15, 30, or 60 minutes. Control samples were kept on ice for the stated time intervals. Internalization was stopped by adding 2 mL ice-cold FACS buffer. Remaining cell surface–bound particles were labeled at 4°C for 30 minutes with goat antihuman IgG fluorescein-conjugated antibody (Pierce). The samples were then washed twice in PBS and resuspended in 2% formalin. Samples were analyzed using a FACSCalibur Flow Cytometer (Becton Dickinson).
Inhibition of Clathrin-Mediated Endocytosis
To determine if anti-PSMA-labeled nanoparticles were internalized through clathrin-mediated endocytosis, samples were prepared and handled as described above, except that the FACS wash buffer contained 12.5 μg/mL chlorpromazine hydrochloride (Sigma-Aldrich). Trypsinized cells were preincubated with chlorpromazine for 45 minutes at 37°C prior to adding nanoparticles. Samples were incubated at 37°C to allow internalization for 0 to 30 minutes.
Iron Determination
The iron content in the NMR samples was determined using a photometric assay. The agarose, cells, and the dextran coating on the particles were dissolved in 6 N HCl (0.125 mL) for 1.5 hours at 50°C. Any ferrous chloride present was oxidized to ferric chloride using 0.1 mg/mL ammonium persulfate (Bio-Rad, Richmond, CA). An equal volume of a 5% solution of K4[Fe(CN)6]·3H2O (Sigma-Aldrich) was added for 10 minutes, and absorbance was read at 690 nm in a Shimadzu (Columbia, MD) spectrophotometer. 11 A standard curve was made using iron (III) chloride hexahydrate (Sigma-Aldrich).
NMR Sample Preparation
LNCaP cells (1.5 × 10⁶) were incubated with 25 μL anti-PSMA antibody–labeled nanoparticles for 30 minutes on ice. Four milliliters of PBS was added to the sample, and the sample was equally split into two pools and centrifuged for 1 minute at 400g. One sample was fixed in 1 mL of 4% formalin for 10 minutes and then centrifuged, resulting in cells with anti-PSMA antibody–conjugated nanoparticles bound to the cell surface. The second sample was placed at 37°C for 30 to 45 minutes to induce internalization of the nanoparticles and then fixed, and the cells were pelleted. For each sample, the cell pellet volume was brought up to 50 μL with PBS. An additional 50 μL of 2% melted agarose was added to the sample, and the sample was placed in a tube for MR imaging as described below.
A 500 μL layer of cell-free 1% agarose in PBS was added to a 12 × 75 mm BD falcon tube (VWR Scientific, Inc., West Chester, PA) followed by a 100 μL layer of agarose containing 7.5 × 10⁵ LNCaP cells labeled with surface-bound anti-PSMA antibody–conjugated nanoparticles. Another layer of cell-free agarose (250 μL) was added to segregate a second 100 μL layer of 7.5 × 10⁵ LNCaP cells, labeled with internalized anti-PSMA antibody–conjugated nanoparticles. The sample was finished with a 250 μL layer of cell-free agarose.
A second set of MR samples (unlabeled cells, surface-labeled cells, and internally labeled cells) were prepared using three separate 5 mm NMR tubes (WILMAD/Lab Glass, Buena NJ) that contained only the cell pellet (1 × 10⁶ cells) suspended in PBS plus 1% agarose to yield a total sample volume of 100 μL in each tube.
MR Measurements
All NMR and MR imaging was carried out in a 1.0-Tesla Neomax permanent magnet using an MRTechnology (Ibaraki, Japan) spectrometer and gradient set and a home-built solenoid probe. The proton frequency was 44.2 MHz. For the 12 mm tube containing both surface-and internally labeled cells, T2-weighted images were acquired using a standard two-dimensional spin echo (SE) imaging sequence with an echo time (TE) of 29.7 to 119.7 milliseconds and a repetition time (TR) of 2.0 seconds, and the number of signal averages (NEX) was 8. The two-dimensional SE sequence (with TE = 4.7 milliseconds) was also used to acquire T1-weighted images by varying TR from 300 milliseconds to 3 seconds. For imaging the three 5 mm NMR tubes, a T1-weighted SE sequence was used (TE = 3 milliseconds, TR = 500 milliseconds, NEX = 8).
The relaxation times T1 and T2 were measured for each 5 mm sample using a standard inversion-recovery sequence (T1) and a standard Hahn echo sequence (T2). The T1 relaxivity (r1) is a measure of the increase in the relaxation rate (1/T1) for a given concentration of a contrast agent (in this case, iron). We define r1 in the standard way:


Confocal Analysis
For immunofluorescence experiments, cells were seeded onto microglass coverslips (VWR Scientific, Inc.) in 6-well plates at 100,000 cells/well. After 24 hours, fresh medium (500 μL) containing either RPMI plus 1% fetal calf serum (FCS), or PBS with calcium and magnesium, plus 1% BSA was added to the cells along with anti-PSMA antibody-conjugated nanoparticles (10 μL/well, 22 μg iron/mL). Cells were then incubated on ice for 30 to 45 minutes. Then cells were washed and incubated with medium containing 10 μg/mL goat antihuman IgG Alexa Fluor 488 (Molecular Probes) for 30 minutes on ice. For internalization studies, nanoparticle-labeled cells were incubated at 37°C in RPMI complete media for the indicated amount of time before proceeding. For lysosomal staining, 50 nM Lysotracker Red DND-99 (Molecular Probes) was added to the cells during the last 30 to 45 minutes of their incubation at 37°C.
For actin staining, nanoparticle-labeled cells were fixed in 4% formaldehyde (without methanol) for 15 minutes at room temperature. After two washes, cells were permeabilized (0.1% Triton X-100 in PBS for 5 minutes) and incubated with 25 U/well Alexa Fluor 555 phalloidin (Molecular Probes) for 20 minutes at 4°C in PBS containing 1% BSA. After two PBS washes, coverslips were mounted onto all slides using Vectashield mounting medium with 4'6-diamidino-2-phenylindole (DAPI) (Vector Laboratories, Inc., Burlingame, CA). Analyses were done using a Zeiss LSM510 META Confocal Laser Scanning Microscope (Thornwood, NY).
Golgi apparatus staining was done using the same protocol except that cells were incubated with rabbit polyclonal to giantin IgG antibody (1:200; Abcam Inc., Cambridge, MA) for 30 minutes at 4°C in PBS containing 1% BSA, followed by incubation with 10 μg/mL highly cross-absorbed goat antirabbit IgG Alexa Fluor 555 antibody for an additional 30 minutes at 4°C. For caveolin staining, cells labeled with nanoparticles were incubated at 37°C for 7.5 minutes. After washing in PBS, cells were fixed and permeabilized in ice-cold methanol:acetone (50:50 v/v) for 5 minutes. Cells were then stained with 10 μg/mL Cy3-conjugated rabbit anti-caveolin 1 antibody (Sigma-Aldrich) and 10 μg/mL goat antihuman IgG Alexa Fluor 488 for 30 minutes at 4°C.
Degradation of Nanoparticles
To determine if labeled nanoparticles were being degraded in the lysosome, cells labeled with Alexa Fluor 488 antibody–conjugated nanoparticles were incubated at 37°C for 0 to 165 minutes. Immediately after incubation, cells were washed and fixed in 2% formalin. Analyses were done using a FACSCalibur Flow Cytometer (Becton Dickinson).
Results
Anti-PSMA Conjugated Nanoparticles Selectively Bind to PSMA-Positive Cells
Cultured LNCaP and DU145 cells were stained with an anti-PSMA antibody, followed by a phycoerythrin-conjugated secondary antibody. Flow cytometric analysis of LNCaP cells revealed strong expression of PSMA, whereas DU145 cells failed to express PSMA (Figure 1A). These results are in agreement with previously published studies.12,13
To demonstrate that nonspecific binding is not responsible for nanoparticle binding to LNCaP cells, nanoparticles were labeled with biotinylated control IgG antibody. LNCaP cells were incubated with IgG-labeled nanoparticles for 30 minutes at 4°C, followed by labeling with goat antihuman IgG Alexa Fluor 488. To designate the location of the plasma membrane, Alexa Fluor 555 phalloidin was used to label actin. Confocal analysis showed clear actin staining, with no labeling by nanoparticles (Figure 1B).
To show that anti-PSMA antibody attachment to the nanoparticles did not alter the binding specificity of the antibody, nanoparticles were labeled with biotinylated anti-PSMA antibody using a FluoReporter Mini-Biotin-XX Protein Labeling Kit. It was determined that each antibody was labeled with approximately four biotins using the FluoReporter Biotin Quantitation Assay Kit. Labeled nanoparticles were incubated with either DU145 or LNCaP cells at 4°C. The PSMA-positive LNCaP cells had abundant surface labeling with the nanoparticles, whereas the PSMA-negative DU145 cells were free of labeling (see Figure 1B).
Antibody-Conjugated Iron Oxide Nanoparticles Are Internalized into LNCaP Cells with the Same Efficiency as Free Antibody
PSMA receptors are constitutively endocytosed, and these events are enhanced by antibody binding to the receptors. 14 Given that most clathrin-coated vesicles are only 80 to 100 nm, 15 we wanted to determine if attaching a derivatized nanoparticle with an overall diameter of approximately 75 nm would inhibit uptake. LNCaP cells were labeled with either free antibody or anti-PSMA antibody–conjugated nanoparticles, followed by goat antihuman IgG Alexa Fluor 488 at 4°C. The labeling medium was replaced with warm RPMI medium containing 10% FCS, and cells were incubated at 37°C for 60 minutes to induce internalization. Again, actin labeling was used to designate the location of the plasma membrane. Confocal analysis showed that both free antibody and antibody-conjugated nanoparticles were endocytosed into the cells (Figure 2A).
The rate of antibody or antibody-conjugated nanoparticle internalization was studied by labeling LNCaP cells with surface antibody or particles at 4°C and then incubating the cells at 37°C for 0 to 30 minutes. Control samples were maintained at 4°C throughout the experiment. Uptake was stopped by adding 2 mL ice-cold PBS to the sample. Samples were then incubated with goat antihuman IgG Alexa Fluor 488 to label antibody or antibody-conjugated particles that were still located on the cell surface. Samples were analyzed by flow cytometric analysis, and data were plotted on an x, y scatter graph. Both free and bound antibody was rapidly taken up by the cells at 37°C (Figure 2B). Incubation at 4°C for the duration of the experiment did not affect surface labeling. The data were then fit to an exponential decay curve. The half-time (t1/2) for free antibody was 5.00 minutes, whereas the t1/2 for antibody-conjugated particles was 4.95 minutes. Therefore, both free and nanoparticle-conjugated antibody is internalized by LNCaP cells with the same kinetics, suggesting uptake by the same pathway.
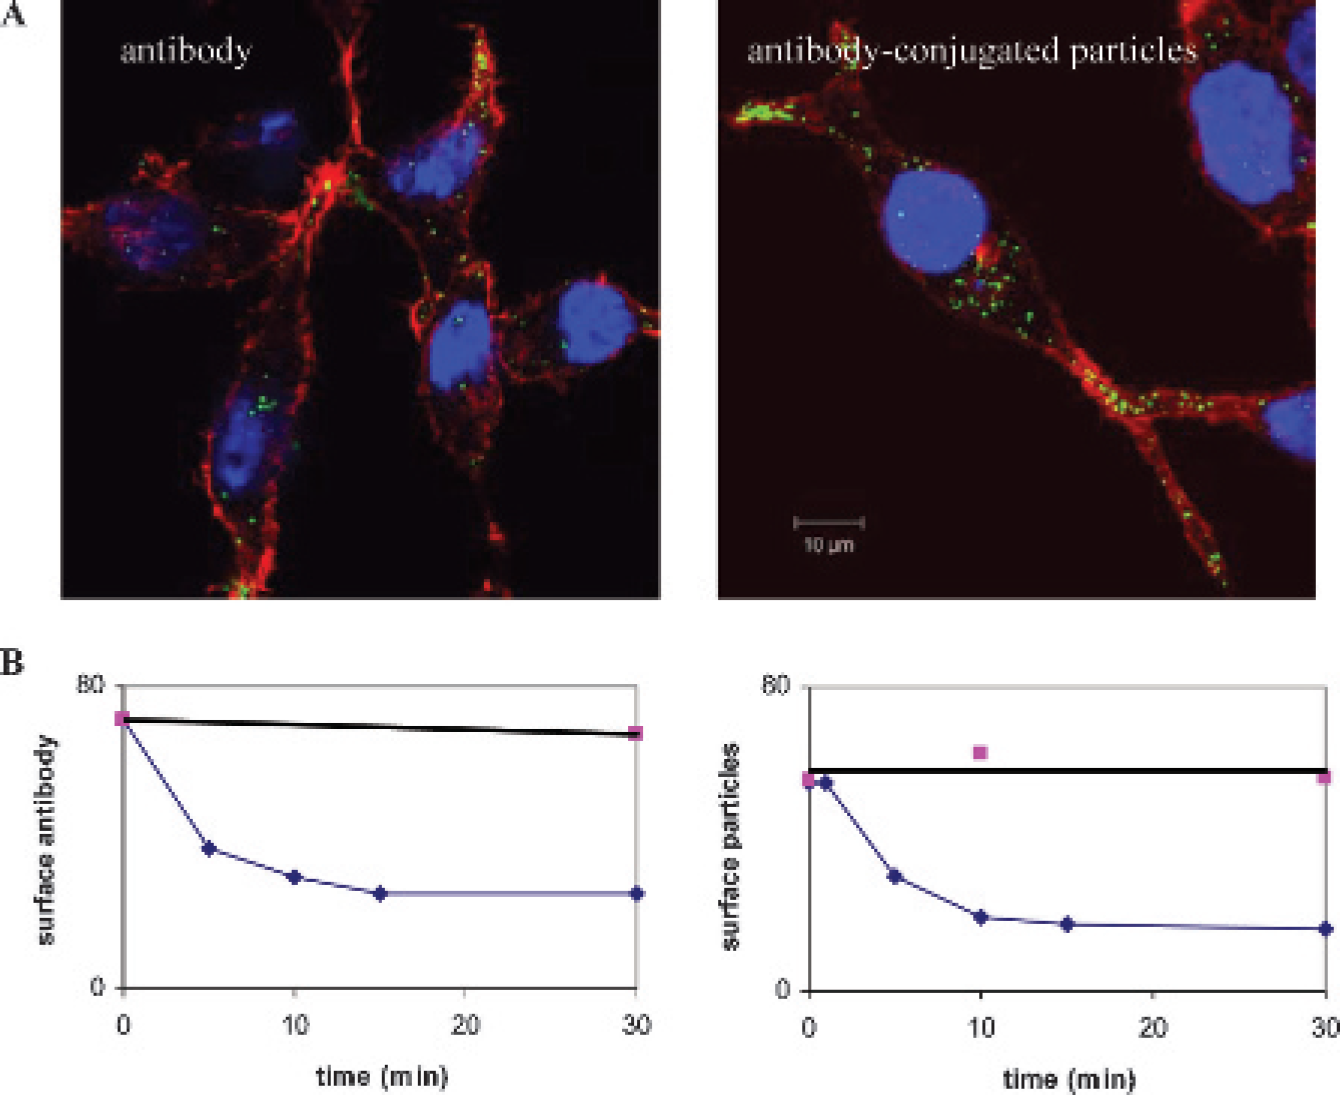
Antibody-conjugated iron oxide nanoparticles are internalized into LNCaP cells with the same efficiency as free antibody. A, LNCaP cells were labeled with either free antibody or antibody-conjugated nanoparticles (green) at 4°C and then switched to 37°C for 45 minutes to induce internalization. Actin was labeled with phalloidin (red) to designate the location of the plasma membrane. B, The rate of nanoparticle or free antibody internalization was determined by FACS analysis. After surface labeling with free antibody or antibody-conjugated particles, LNCaP cells were incubated at 37°C for the indicated time periods. The proportion of antibody (or antibody-conjugated nanoparticle) that remained on the cell surface was then determined by labeling with fluorescein isiothiocyanate–conjugated secondary antibody. The data were fit to an exponential decay curve. Free antibody t1/2 = 5.00 minutes; antibody-conjugated particle t1/2 = 4.95 minutes.
Characterization of Antibody-Conjugated Particles
The Mallory method was used to determine iron content in iron oxide nanoparticles. This method is based on the reaction between ferric ions (Fe3+) and ferrocyanide (K4[Fe(CN)6]·3H2O), which react in acid solution to produce a Prussian Blue pigment that absorbs at 690 nm. Nanoparticles were incubated in 6 N HCl for 1.5 hours at 50°C, followed by treatment with ammonium persulfate to oxidize ferrous ions. After a 10-minute incubation with ferrocyanide (K4[Fe(CN)6]·3H2O), absorbance was read at 690 nm. Miltenyi MACS nanoparticles were found to contain between 6.0 and 9.4 mM iron as supplied. Treatment with ammonium persulfate, which oxidizes Fe2+ to Fe3+, did not significantly alter the concentration, suggesting that all iron was in the form of Fe2O3. In preparing our antibody-bound nanoparticles, 500 μL of nanoparticles was used, and the final sample was eluted from a Miltenyi column in 200 μL of PBS. Therefore, based on a concentration factor of 2.5, our final (working) antibody-bound particle solution contained approximately 20 mM iron.
To determine the amount of antibody bound to each nanoparticle, LNCaP cells were first titrated with free antibody to determine the antibody's binding affinity for cell surface PSMA. A saturation plot of bound antibody as a function of antibody concentration is shown in Figure 3A. A binding affinity (Kd) of 0.09 μg/mL was calculated for PSMA antibody MLN591 using the following equation for equilibrium binding to a single class of receptors:

To estimate the concentration of antibody in our antibody-conjugated nanoparticle preparation, we made the assumption that the binding affinity of the free and bound antibody was similar. The volume of antibody-conjugated nanoparticles required for maximal binding was determined by creating a saturation plot (Figure 3B). The equation for equilibrium binding was used to determine specific binding and antibody concentration. The specific binding calculated using 10 μL of the nanoparticle-bound antibody (80), Bmax = 120, and Kd = 0.09 μg/mL was used to determine the concentration of antibody in the final sample. Taking into account a 10-fold dilution of our antibody-bound nanoparticle preparation, the concentration of antibody was calculated to be 1.8 μg/mL. However, this is just an estimate since it is possible that biotinylation and attachment of the antibody to the nanoparticles altered the conformation and the binding affinity of the antibody.

Characterization of antibody-conjugated nanoparticle binding to LNCaP cells. A, The affinity of anti–prostate-specific membrane antigen (PSMA) antibody for cell surface receptors was determined by performing a saturation binding experiment. The concentration of anti-PSMA antibody was varied between 0 and 20 μg/mL, and binding to PSMA on the surface of LNCaP cells was determined by flow cytometry. B, The binding affinity of antibody-conjugated nanoparticles for surface receptors was also determined. LNCaP cells were titrated with increasing volumes of antibody-conjugated nanoparticles, and the volume of nanoparticles required to saturate binding sites was determined.
Positive Contrast Is Greater for Surface Particles than Internalized Particles in NMR Images
To determine if nanoparticle internalization alters contrast in MR images, MR samples were prepared by labeling LNCaP cells with either surface or endocytosed particles and suspending the cells in a bed of agarose. Separate NMR tubes contained either unlabeled cells, surface-labeled cells, or internally labeled cells. Figure 4A shows a T1-weighted SE MR image acquired at TE = 3 milliseconds, TR = 500 milliseconds, and NEX = 8. The brightest tube contained surface-labeled cells (c), whereas the internally labeled cells were dimmer (b), and the unlabeled cells were the darkest (a). The measured longitudinal relaxation times (T1) of protons in these samples were 1.46 seconds (surface labeled), 1.63 seconds (internally labeled), and 2.44 seconds (unlabeled) with ± 0.02 second uncertainty. Thus, the relaxivity (r1) of the surface-labeled cells was ≈35% greater than that of internally labeled cells, assuming the same iron content for each. The measured transverse relaxation times (T2) were 0.053 seconds (surface labeled), 0.052 seconds (internally labeled), and 0.100 seconds (unlabeled) with ± 0.001 second uncertainty.
Surface- and internally labeled LNCaP cells were also imaged in a single 12 mm plastic tube. The tube, containing agarose gel, also contained the two types of labeled cells, separated into distinct layers (Figure 4E). Figure 4, B and C, shows SE images taken with different imaging parameters to reveal the T1 (bright) and T2 (dark) contrast. Consistent with the 5 mm sample results, surface-labeled cells had greater T1 contrast (see Figure 4B), whereas the T2-weighted images showed the same level of contrast for surface- and internally labeled cells (see Figure 4C).
To confirm that the differentially labeled cells contained the same amount of iron, the Mallory method was used to quantitate iron. The samples were dissolved directly in the NMR tubes by adding 6 N HCl and incubating at 50°C for 1.5 hours. The surface-labeled cells contained 21 nmol of iron, whereas the internally labeled cells contained 23 nmol of iron, with an uncertainty of ± 2 nmol. This confirms that enhanced T1 contrast for surface-bound nanoparticles compared with internal nanoparticles (as shown in Figure 4D) is not a consequence of higher iron content. Based on the difference in iron concentration between NMR samples containing labeled and unlabeled cells, the iron concentration attributable to the nanoparticles was 0.030 ± 0.015 mM, resulting in T1 relaxivities (r1) of approximately 9 s−1mM−1 and 7 s−1mM−1 for surface-labeled and internally labeled nanoparticles, respectively, and a T2 relaxivity (r2) of 300 s−1mM−1 for both. In previous studies, iron oxide nanoparticles with diameters similar to those used in this study (ie, tens of nm) have yielded fairly similar r1 values (10–30 s−1mM−1) at similar NMR field strengths.16–18
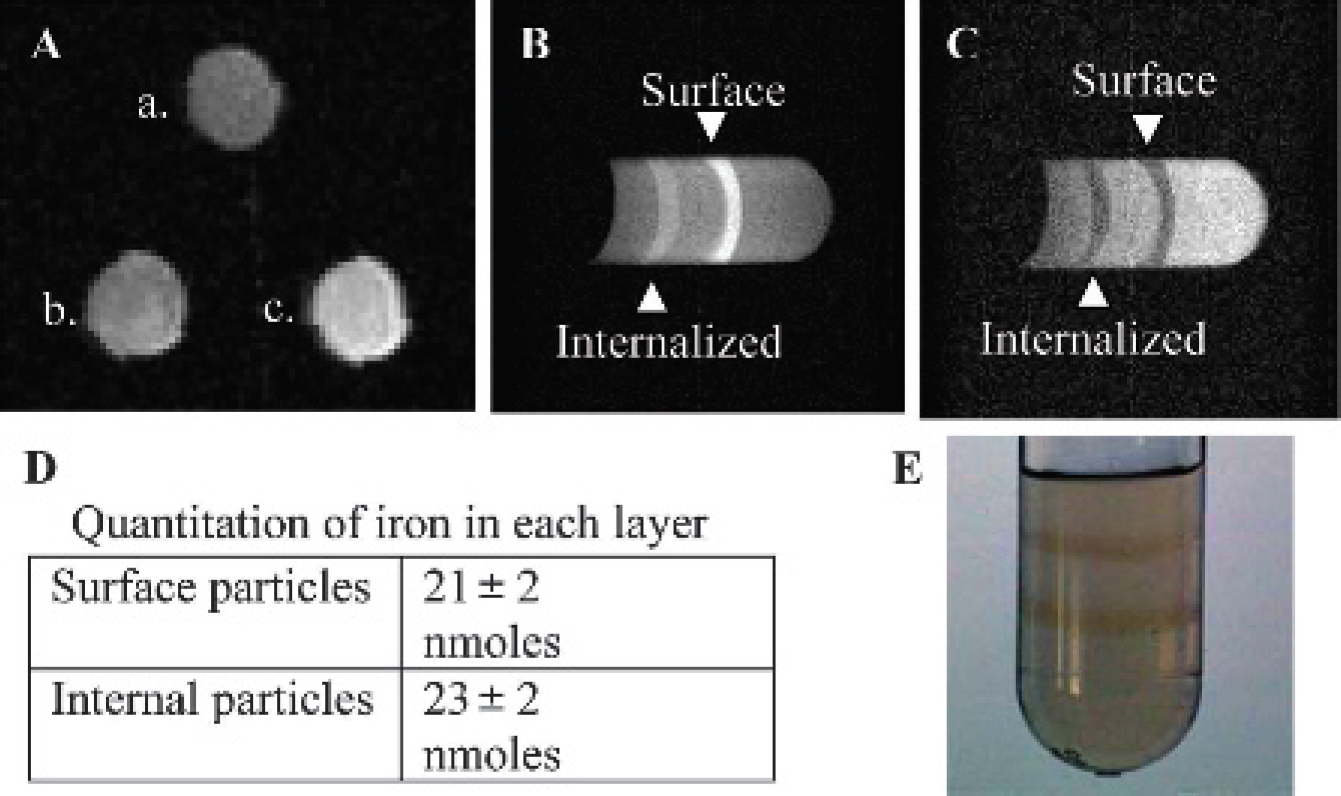
Positive contrast in magnetic resonance images is greater for surface-bound iron oxide nanoparticles than internalized particles. LNCaP cells were labeled with prostate-specific membrane antigen antibody–conjugated iron oxide nanoparticles. The sample was divided, and half was kept on ice to retain particles on the surface, whereas the other half was incubated at 37°C for 30 minutes to induce endocytosis of the particles. A contains three 5 mm nuclear magnetic resonance (NMR) tubes containing 1% agarose in phosphate-buffered saline with either cells alone (a), cells with internalized nanoparticles (b), or cells labeled with surface nanoparticles (c). In B and C, a single tube contains both surface and internalized nanoparticles in discrete layers. By modifying the sequence parameters, either a T1-weighted (positive contrast, B) or a T2-weighted image (negative contrast, C) can be obtained. The T1-weighted image is sensitive to the location of nanoparticles, showing greater contrast with surface nanoparticles. In contrast, the T2-weighted image is similar for surface and vesicle-bound nanoparticles. The amount of iron in the NMR tubes (A) was quantitated by the Mallory method and is shown used in D. In E, a picture of the NMR sample imaged in B and C is provided.
Clathrin-Mediated Endocytosis Is Involved in Internalization of PSMA-Targeted Nanoparticles
Endocytosis of PSMA has been reported to depend on clathrin-mediated pathways. 14 To determine if nanoparticles bound to PSMA were internalized by the same pathway, surface-labeled LNCaP cells were cultured at 37°C for 30 minutes. A large number of nanoparticles were seen in the cells at 30 minutes by confocal analysis (Figure 5A). When chlorpromazine was added to the incubation medium, there was a large decrease in the number of nanoparticles present in the cells. Additionally, the nanoparticles were not retained at the cell surface, indicating that PSMA may not be localized at the plasma membrane in the presence of chlorpromazine.
To determine the extent of nanoparticle internalization by clathrin-mediated endocytosis, cells were preincubated with chlorpromazine, followed by surface labeling with nanoparticles and then internalization by incubation at 37°C for 0, 5, 10, 15, and 30 minutes. After incubation, the remaining surface nanoparticles were labeled with goat antihuman Alexa Fluor 488. At each time point, there were fewer nanoparticles bound to the cell surface in the presence of chlorpromazine (Figure 5B). Given that the internalization rate was the same in the presence and absence of chlorpromazine, it was thought that fewer nanoparticles were originally bound to the cell surface but that the same number of nanoparticles were internalized. However, as stated in the preceding paragraph, the confocal data show fewer nanoparticles localized within the cells in the presence of chlorpromazine.
Given that some nanoparticles were internalized in the presence of chlorpromazine, we wanted to explore alternative endocytosis pathways in LNCaP cells. It has been shown that cells that do not express caveolin 1 protein do not develop caveolar invaginations. 19 Therefore, we investigated expression of caveolin 1 in LNCaP as a possible alternative pathway for internalization. LNCaP cells labeled on the surface with Alexa Fluor 488–tagged nanoparticles were incubated at 37°C to induce endocytosis. After 7.5 minutes, nanoparticles were either clustered on the cell surface or located in vesicles just beneath the plasma membrane (Figure 5C). In contrast, caveolin 1–labeled vesicles were located within the cytoplasm, in vesicles distinct from those containing nanoparticles.
PSMA-Targeted Nanoparticles Are Not Delivered to the Golgi Apparatus
To determine the intracellular fate of internalized nanoparticles, we used confocal microscopy to explore colocalization of nanoparticles with the trans-Golgi network (TGN). Using the TGN-specific antibody giantin, we did not find any evidence of nanoparticle trafficking through the TGN (Figure 5D). This indicates that nanoparticle-bound PSMA is not recycled back to the cell surface through the TGN.

Clathrin-mediated endocytosis is involved in internalization of anti–prostate-specific membrane antigen antibody–conjugated iron oxide nanoparticles. A, LNCaP cells were incubated in the presence or absence of 12.5 μg/mL chlorpromazine for 45 minutes at 37°C in RPMI containing 10% fetal calf serum (FCS) (chlorpromazine was included in all wash and incubation steps). Cells were then labeled with antibody-bound nanoparticles (green) at 4°C, followed by incubation at 37°C for 30 minutes. B, To determine the extent of particle binding and internalization in the presence of chlorpromazine, nanoparticle-labeled cells were incubated at 37°C for 0 to 30 minutes followed by labeling of remaining surface particles with Alexa Fluor 488. C, LNCaP cells, labeled with fluorescent nanoparticles (green), were incubated at 37°C for 7.5 minutes. The cells were then treated with methanol and acetone and incubated with Cy3-conjugated anti–caveolin 1 antibody. D, LNCaP cells, labeled with fluorescent antibody-bound nanoparticles (green, c) were incubated at 37°C for 1 hour in RPMI containing 1% FCS. LNCaP cells were then fixed and permeabilized, and the Golgi apparatus was labeled with antigigatin antibody, followed by labeling with goat antirabbit Alexa Fluor 555 (red, a).
Internalized Nanoparticles Are Degraded in the Lysosome
A possible fate of cargo traveling by way of clathrin-mediated endocytosis is degradation within the lysosome. 20 To determine if internalized nanoparticles were degraded, lysosomes were labeled with Lysotracker, and confocal microscopy was used to determine colocalization. Figure 6A shows nanoparticles accumulating in the vicinity of the lysosomes with clear colocalization.
Next, flow cytometry was used to measure a decrease in fluorescent-labeled nanoparticles in LNCaP cells over time as an indication of particle degradation. The histograms in Figure 6B show bright staining at time 0 when nanoparticles are located on the cell surface. After 15 minutes, when the majority of nanoparticles are internalized, fluorescent intensity was decreased by 20%. However, after nearly 3 hours, the fluorescent signal was further diminished. A broad histogram peak was obtained at 3 hours, indicating different levels of staining in the cell population. In Figure 6C, mean fluorescent intensity is plotted as a function of time. After nearly 3 hours, only 52% of the original signal was detected.
Discussion
Although great progress has been made in the last decade in the development of physical imaging methods for cancer, there is still significant need for increased specificity, particularly for metastatic lesions. We have exploited the increased expression of the cell surface antigen PSMA to target prostate tumor cells. Anti-PSMA antibodies conjugated to nanoparticles were used to specifically image prostate cancer cells. We chose to use LNCaP and DU145 cells for imaging based on their strong and negative expression of PSMA, respectively.
The major finding of our study is that our antibody-conjugated nanoparticles specifically label PSMA-positive cells and that these nanoparticles are internalized by receptor-mediated endocytosis. PSMA has a novel cytoplasmic tail motif, MXXXL, which belongs to neither of the two major signal categories (ie, tyrosine- and dileucine based). 21 This MXXXL motif allows internalization of the PSMA. Liu and colleagues showed that PSMA internalization occurs via clathrin-coated pits in LNCaP cells. 14 We have shown that clathrin-mediated endocytosis also has a role in internalization of PSMA-targeted nanoparticles. We showed that chlorpromazine reduces both cell surface binding and endocytosis of anti-PSMA antibody–conjugated nanoparticles. Similar to the low-density lipoprotein (LDL) receptor, PSMA may be trapped in small vesicles within the cell after treatment with chlorpromazine. 22 Only 13% of the LDL receptors remained on the cell surface after 30 minutes with 100 μM chlorpromazine. In addition, we confirmed that the kinetics of nanoparticle internalization are identical to that of free antibody, with a t1/2 of approximately 5 minutes.
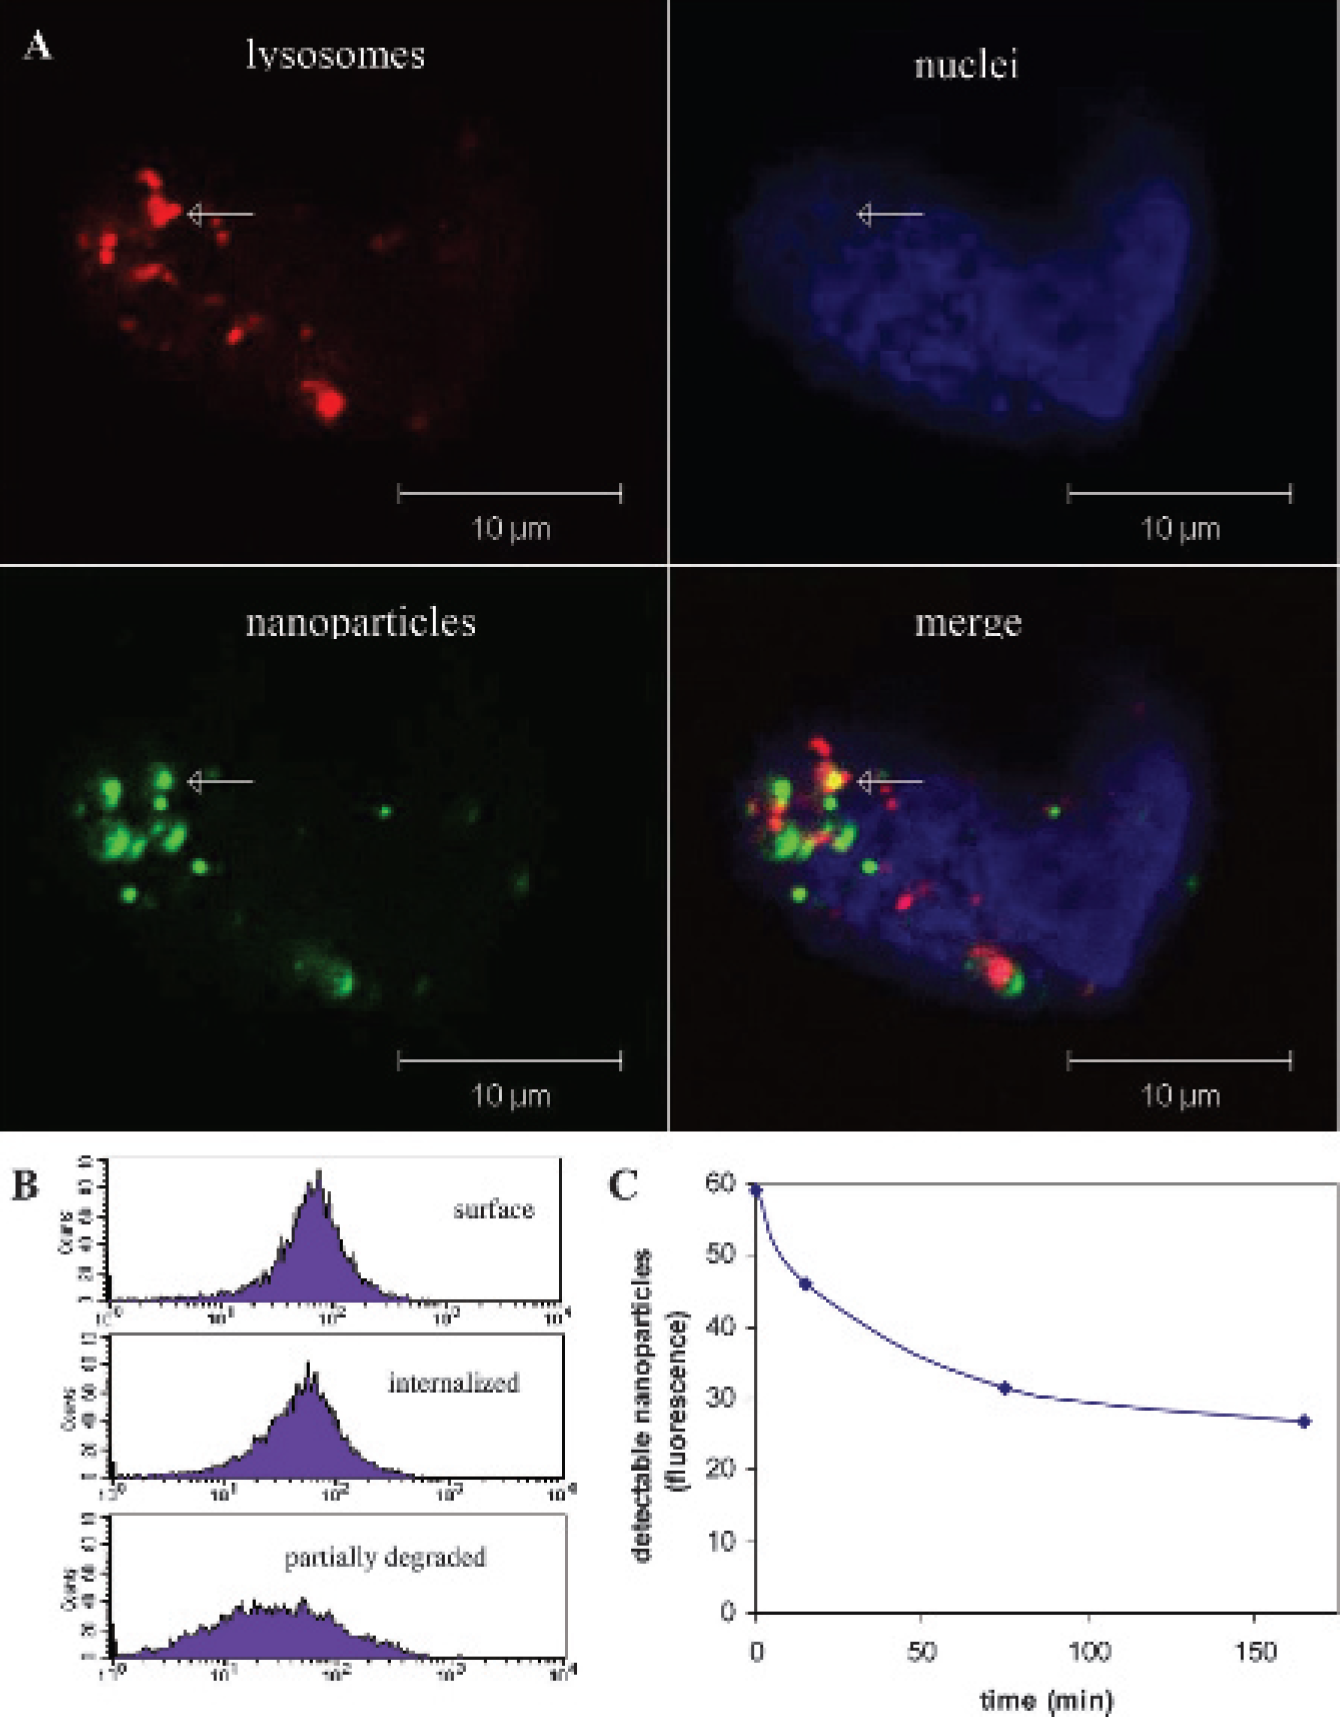
Prostate-specific membrane antigen (PSMA)-targeted nanoparticles are degraded in the lysosome. A, LNCaP cells, labeled with antibody-bound nanoparticles (green), were incubated at 37°C for 3 hours. Lysotracker (red) was added to the cells during the last 30 minutes of the incubation. The nuclei were labeled (blue) using mounting media containing DAPI. Confocal analysis of the cells revealed clustering of nanoparticles and lysosomes, with clear colocalization. B and C, To determine the time course for lysosomal degradation, cells bound by fluoresceinlabeled nanoparticles were incubated at 37°C for 0 to 165 minutes. B, Flow cytometric analysis shows an early decrease in the fluorescent signal owing to endocytosis in the first 15 minutes of incubation at 37°C. Further decay in fluorescent signal is due to degradation of the fluorescent antibody within the lysosome. C, The flow data were fit to an exponential decay curve.
It has previously been shown that PSMA expressed in human microvascular endothelial cells binds to caveolin 1 and undergoes caveolae-dependent internalization. 23 Although this pathway does not appear to play a role in internalization of PSMA-targeted nanoparticles, it does exist in LNCaP cells and may serve as a route for internalization if a different cell surface protein is targeted. This pathway is preferable for delivery of therapeutic agents since caveosomes do not fuse with acidic endosomes or lysosomes. 24
A second major finding of our study is the effect of iron oxide nanoparticle internalization on NMR relaxation times and image contrast. Iron oxide nanoparticles acquire large magnetic moments when placed into an NMR magnet, leading to the generation of large magnetic field gradients in the neighborhood of the nanoparticles. The relaxation rates of protons in water molecules surrounding iron oxide nanoparticles are enhanced, causing bright contrast in T1-weighted images and dark contrast in T2-weighted images. We found that the T1 relaxivity is greater for surface-bound nanoparticles compared with internalized nanoparticles. Once internalized, nanoparticles are enclosed in endosomes, with diameters typically the same size as our labeled nanoparticles. Restricted diffusion of water molecules within the endosomes, as well as limited space for free water, could both account for the lower relaxivity of the internalized nanoparticles relative to the surface-bound nanoparticles.
In contrast to T1-weighted images, T2 contrast was similar for surface-bound and internalized nanoparticles. It was reported by Kooi and colleagues that intracellular accumulation of iron oxide nanoparticles by the mono-nuclear phagocytic system leads to enhanced T2 effects. 25 Our findings showed unaltered T2 effects on internalization. This could be due to an already achieved accumulation at the cell surface. In summary, it appears that T2 contrast is more dependent on the overall iron concentration and the magnitude of the resulting magnetic field perturbations rather than the water diffusion rate or the accessibility of the magnetic nanoparticle surface to free water.
In conclusion, we have shown that PSMA-targeted nanoparticles selectively bind to prostate tumor cells and are efficiently internalized by receptor-mediated endocytosis. The accumulation of nanoparticles, either on the cell surface or within vesicles, enhances both T1 and T2 relaxation, leading to enhanced contrast in MR images; however, the T1 enhancement is greater when the nanoparticles remain on the cell surface. Therefore, PSMA-targeted iron oxide nanoparticles offer a specific and sensitive tool for detection of prostate cancer cells. Endocytosis of the nanoparticles may provide a mechanism for the delivery of therapeutics provided that the therapeutic is released prior to degradation within the lysosome.