
Abstract
High-frequency microultrasound imaging of tumor progression in mice enables noninvasive anatomic and functional imaging at excellent spatial and temporal resolution, although microultrasonography alone does not offer molecular scale data. In the current study, we investigated the use of microbubble ultrasound contrast agents bearing targeting ligands specific for molecular markers of tumor angiogenesis using high-frequency microultrasound imaging. A xenograft tumor model in the mouse was used to image vascular endothelial growth factor receptor 2 (VEGFR-2) expression with microbubbles conjugated to an anti-VEGFR-2 monoclonal antibody or an isotype control. Microultrasound imaging was accomplished at a center frequency of 40 MHz, which provided lateral and axial resolutions of 40 and 90 μm, respectively. The B-mode (two-dimensional mode) acoustic signal from microbubbles bound to the molecular target was determined by an ultrasound-based destruction-subtraction scheme. Quantification of the adherent microbubble fraction in nine tumor-bearing mice revealed significant retention of VEGFR-2-targeted microbubbles relative to control-targeted microbubbles. These data demonstrate that contrast-enhanced microultrasound imaging is a useful method for assessing molecular expression of tumor angiogenesis in mice at high resolution.
Although late to enter the molecular imaging field, ultrasound imaging has several potential and significant competitive advantages. Ultrasound imaging is noninvasive and inherently realtime, and examinations are routinely completed in a matter of minutes. Additionally, ultrasound imaging does not require dedicated facilities, ionizing radiation, or radioactive contrast agents. 2 However, until recently, ultrasonography has suffered from a paucity of molecular imaging contrast agents. Researchers over the last several years have shown that microbubble ultrasound contrast agents can be selectively targeted to intravascular molecular markers of various disease processes, including inflammation,3–5 thrombosis,6,7 and tumor angiogenesis,8–11 and detection sensitivities on the order of a single microbubble are possible with some clinical scanners. 12 The resolution of clinical scanners, however, remains too low to resolve many critical anatomic features and microvessels in mice. The development of noninvasive high-frequency microultrasound imaging platforms 13 has resulted in improved spatial resolution (30-100 μm), but the development of noninvasive high-frequency microultrasound imaging of molecularly targeted contrast agents has not yet been demonstrated.
In the current study, we present the first evidence for the use of molecularly targeted microbubble ultrasound contrast agents with high-frequency microultrasound imaging. This approach provides the unique combination of molecular specificity and high spatial resolution of relevant biomarkers. Specific detection of contrast agents bound to the proangiogenic receptor vascular endothelial growth factor receptor 2 (VEGFR-2) was achieved in a well-characterized xenograft mouse model of tumor growth. This work suggests that contrast-enhanced high-frequency microultrasonography is a reliable and convenient tool for imaging tumor progression and biomarker expression in vivo in small animals.
Materials and Methods
Mouse Model of Tumor Angiogenesis
All animal experiments were conducted in accordance with the animal care and use procedures of Sunnybrook Health Sciences Centre. A subdermal tumor model derived from human melanoma cells (MeWo; American Type Culture Collection, Manassas, VA) known to produce a strong angiogenic response was used to image VEGFR-2 expression. 14 Tumors were induced by subdermal injection of 5 × 10⁵ MeWo cells into the lateral aspect of the hind leg in nine nude mice. Tumors were imaged at 3 to 3.5 weeks postinoculation.
Immunohistochemistry
Five tumors were excised and immediately frozen over dry ice in Tissue Tek optimum cutting temperature compound (Miles Inc., Elkhart, IN). Staining was performed on paraformaldehyde fixed sections (5-8 μm) after permeabilization with a solution of 0.1% sodium citrate and 0.1% Triton X-100 and blocking with 10% rabbit serum. Five sections per tumor were incubated with primary antibodies against CD31 (MEC 13.3; Pharmingen, San Diego, CA) and VEGFR-2 (Avas12a1; BD Biosciences, San Diego, CA) overnight and then washed with phosphate-buffered saline (PBS) and incubated with a 4′,6-diamidino-2-phenylindole (DAPI) nuclear stain or with species-appropriate secondary antibodies conjugated to Cy3 (CD31) or fluorescein isothiocyanate (VEGFR-2). Slides were washed with PBS before mounting with fluorescent mounting medium (Dako Cytomation, Carpinteria, CA).
Tumor sections were visualized under a Carl Zeiss (Toronto, ON) Axioplan 2 microscope using bright field or appropriate fluorescence filters. Images were captured with a Zeiss Axiocam camera connected to the microscope using AxioVision 3.0 software. Images were collected using a 20× objective and 10× ocular (total magnification of 200×), which enabled clear identification of microvascular structures.
Ultrasound Contrast Agents
The microbubble ultrasound contrast agents used in this study (Targestar) were provided by Targeson (Charlottesville, VA). The agents were composed of a perfluorocarbon gas core encapsulated by a lipid shell. A layer of polyethylene glycol was grafted to the surface of the lipid shell, and targeting ligands were attached to the agents using biotin-streptavidin coupling chemistry. 3 Contrast agents were conjugated to targeting ligands on the morning of each experiment and stored on ice until administration (up to 4 hours). Contrast agent concentration and size characteristics were assessed using a hemocytometer or Coulter IIe Multisizer (Beckman-Coulter, Miami, FL).
The rat antimouse VEGFR-2 monoclonal antibody Avas12a1 was used as the targeting ligand. As a specificity control, contrast agents bearing an isotype-matched control antibody were also prepared. Both antibodies were obtained in biotinylated form from the manufacturer (eBiosciences, San Diego, CA). Both antibodies were incubated at a ratio of 8 μg antibody per 107 microbubbles. The presence of targeting ligand was assessed using flow cytometry (FACAria, Becton Dickinson, Franklin Lakes, NJ). Targeting ligands were conjugated to the contrast agents and fluorescently labeled using a Texas Red conjugated antirat immunoglobulin G2 antibody (eBioscience).
Microultrasound Imaging
A high-frequency microultrasound imaging system (Vevo 770, VisualSonics, Toronto, ON) designed specifically for imaging small animal models was used in these studies. B-mode images were acquired at a center frequency of 40 MHz (scanhead RMV 704) with axial and lateral resolutions of 50 and 100 μm, respectively. Cine loops of approximately 800 frames were collected for each experiment at a frame rate of 15 Hz.
Mice were anesthetized with 2% isofluorane in oxygen or room air. Body temperature was maintained at 37°C using a heat pad. Mice were placed prone on the imaging stage, and the left hindleg was extended and taped to the stage to minimize respiration motion. Tumors were imaged at the widest cross section, and the transducer was held fixed with an integrated small animal rail system (Vevo Integrated Rail System, VisualSonics).
Microbubbles bearing an anti-VEGFR-2 antibody or an isotype control antibody were administered via a jugular cannula consisting of PE-20 tubing. Microbubbles were administered as a bolus of 5 × 10⁷ particles in ≈100 μL followed by a 20 μL saline flush. Each mouse received one bolus each of VEGFR-2-targeted and control microbubbles in random order, separated by 20 minutes. Microbubble wash-in within the tumor was verified by imaging at low power (10%) immediately following administration, and afterward imaging was paused for 4 minutes. Following the 4-minute accumulation period, imaging was recommenced at a power of 50%. A high-power destructive pulse sequence with a center frequency of 10 MHz was applied after approximately 200 frames were imaged; the destructive sequence served to destroy microbubbles within the beam elevation. Immediately after the destruction sequence, imaging was recommenced at a power of 50%, and residual circulating microbubbles were observed to replenish the beam. Peak free field negative pressure for the Vevo 770 at 100% output is ≈2.7 MPa.
Data Analysis
Adherent (stationary) microbubbles were visualized by a destruction-subtraction imaging scheme, similar to Lindner et al 3 using the instrument's contrast mode software (VisualSonics). It was assumed that the pixel amplitude within the tumor immediately before the destructive sequence was due to the acoustic response of tissue, adherent microbubbles, and circulating (nonstationary) microbubbles. The destruction sequence eliminated microbubbles in the beam elevation, and within several seconds postdestruction, the pixel amplitude was assumed to be due to tissue and any circulating microbubbles that had replenished the beam. The spatial distribution of pixels representing adherent microbubbles was determined by defining a set of reference frames in the postdestruction region and performing a digital subtraction from the predestruction frame set. The reference set consisted of 100 frames (≈7 seconds) immediately after the destruction sequence and was prefiltered with a 3 × 3 low pass filter to remove noise. Reference frames were individually compared with a similarly filtered contrast image frame, and the optimally correlated reference frame was selected as that leaving the lowest residual after subtraction. The optimally correlated reference frame was then digitally subtracted from each frame before and after the destruction sequence, and the difference in pixel amplitude was encoded as a colored mask that was overlaid on the B-mode imaging data. A schematic of this process is shown in Figure 1.

Schematic of imaging scheme. Microbubbles (MB) were administered as a bolus at t = 5 seconds and allowed to accumulate at the target site for 4 minutes. A set of imaging frames was acquired before and after application of a low-frequency, high acoustic pressure destruction sequence intended to destroy microbubbles within the beam elevation. Reference-subtracted images were derived by digitally subtracting an optimally correlated frame selected from the reference region, and these images were visualized as a colored overlay.
The adherent microbubble signal was quantified by computing the mean received amplitude of the reference-subtracted pixel amplitude within a region of interest (ROI) encompassing the tumor exclusive of the skin line at each frame. The mean pixel amplitude was averaged over 100 frames immediately before the destruction sequence (the predestruction signal) and similarly over 100 frames immediately following the reference set (the postdestruction signal). A parameter referred to as the molecular signal, which represents the mean pixel amplitude corresponding to adherent microbubbles, was calculated by subtracting the postdestruction signal from the predestruction signal.
Quantified data are presented as mean ± standard deviation between nine mice. Statistical significance was determined using Student's t-test with a p value of .05.
Results
Verification of VEGFR-2 Expression
All inoculations resulted in detectable tumor growth. Tumors were between 3 and 6 mm in diameter and were grossly ellipsoid. DAPI staining (Figure 2A) showed the dense cellular nature of the MeWo tumors. Staining with CD31 (Figure 2B) revealed uniform microvascularity throughout all of the tumors tested. In each case, there was coregistration of the CD31 data with VEGFR-2 staining, as shown in Figure 2C. Final composite images such as that shown in Figure 2D clearly illustrate coexpression of CD31 and VEGFR-2.
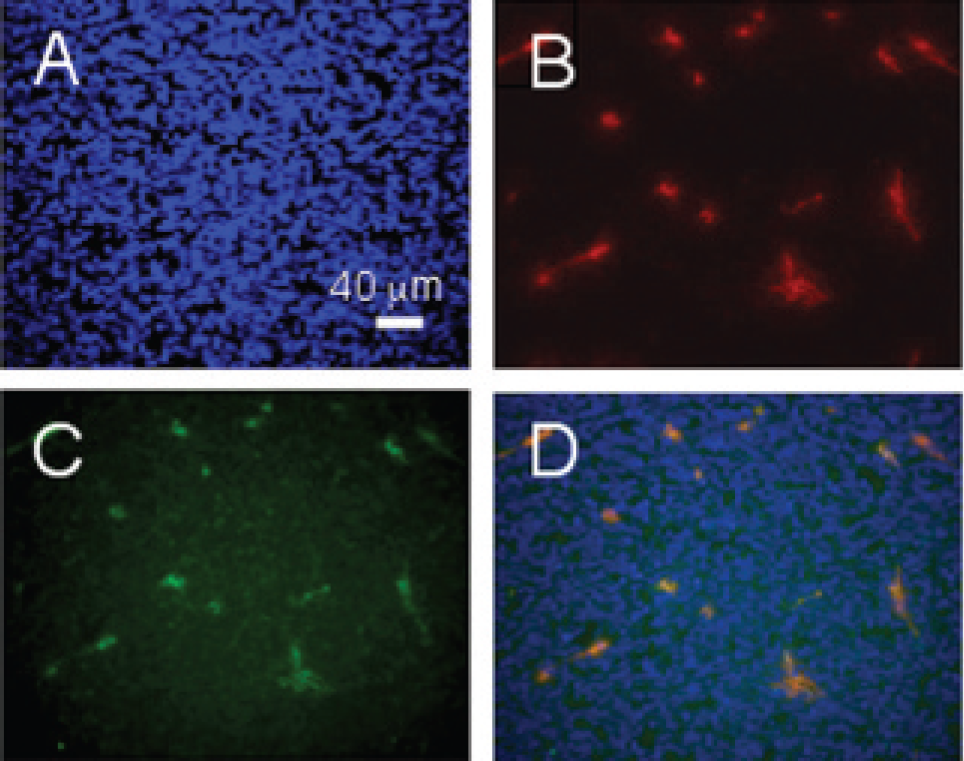
Immunohistochemical analysis of melanoma xenograft. A, Nuclear stain using DAPI; B, CD31; C, vascular endothelial growth factor receptor 2 (VEGFR-2); D, image stack confirming colocalization of VEGFR-2 with the CD31 endothelial cell marker.
Targeted Ultrasound Contrast Agents
The ultrasound contrast agents used in this study had a median diameter of 2.33 ± 1.66 μm, and < 2% of the particles were greater than 8 μm in diameter. Flow cytometry revealed specific staining of anti-VEGFR-2 or isotype control antibody on targeted and control contrast agents, respectively (Figure 3).
Microultrasound Imaging of VEGFR-2 Expression
Microultrasound imaging was performed in nine tumor-bearing mice. Representative imaging frames before and immediately after microbubble destruction are shown in Figure 4 for VEGFR-2-targeted (A and B) and control (C and D) microbubbles. The ROI is outlined in blue in each frame. Pixels corresponding to microbubbles, derived from reference subtraction, are colored in 256 levels of green overlaid on the grayscale B-mode imaging data. A significantly greater microbubble-specific signal is present in the VEGFR-2-targeted sample relative to the control sample. In both samples, a small but detectable microbubble signal is present following destruction, corresponding to circulating microbubbles. The postdestruction microbubble signal was observed to be transient, whereas the majority of the predestruction signal was stationary, further strengthening the claim that the predestruction signal corresponds to adherent microbubbles. Representative predestruction imaging frames using targeted microbubbles are shown for four separate tumors in Figure 5.
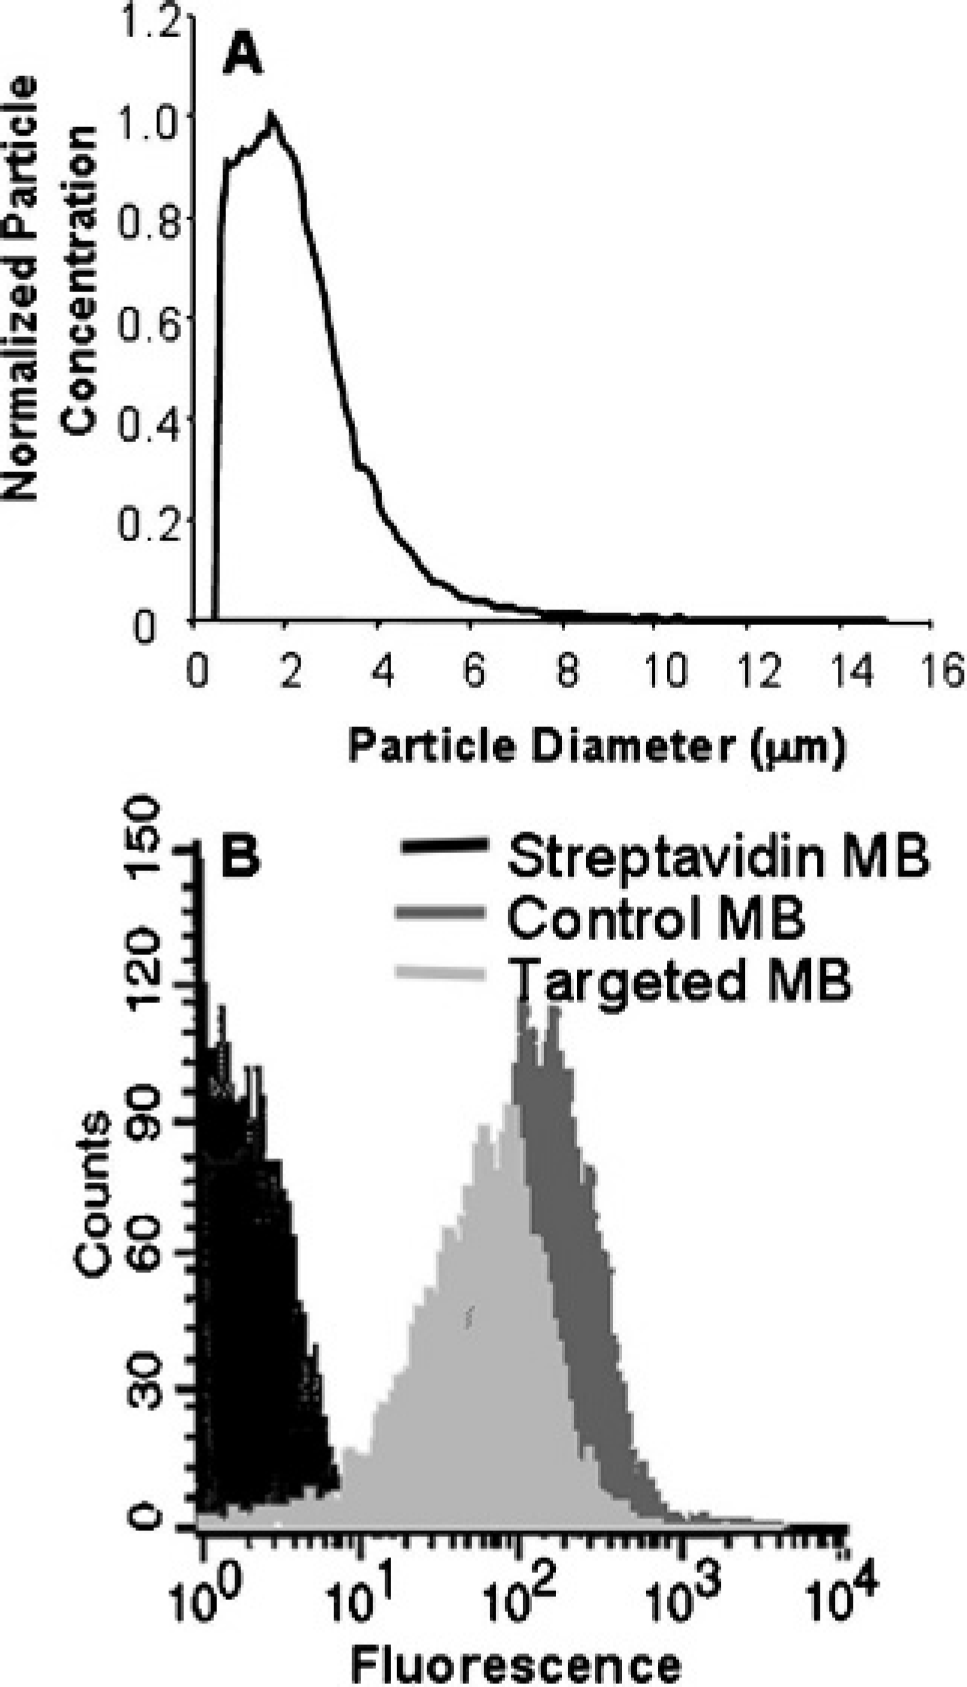
Microbubble (MB) characterization. A, Size distribution of Targestar microbubbles used in the experiments. B, Fluorescence histogram showing conjugation of the anti-vascular endothelial growth factor receptor 2 or isotype control antibody to the surface of the microbubbles. The fluorescence signal of streptavidin-coated microbubbles incubated with the labeled secondary antibody is shown in black.
Digital subtraction of a postdestruction sequence reference set allowed for elimination of the tissue-specific signal, leaving only adherent microbubbles (visible only predestruction) and circulating microbubbles (visible both pre- and postdestruction). Circulating microbubbles were virtually undetec Table 15 minutes after administration. The relative magnitude of the adherent and circulating microbubble fraction is shown in Figure 6. Administration of targeted microbubbles causes a large decrease in mean pixel amplitude following microbubble destruction, whereas administration of control microbubbles results in a smaller decrease. The reference-subtracted mean predestruction and postdestruction pixel amplitudes for VEGFR-2-targeted microbubbles were 29.0 ± 6.93 and 9.46 ± 0.54, respectively, and that of control-targeted microbubbles were 14.8 ± 3.63 and 9.31 ± 1.44, respectively (Figure 7). Microbubble destruction was confirmed using light microscopy in a flow phantom (data not shown).
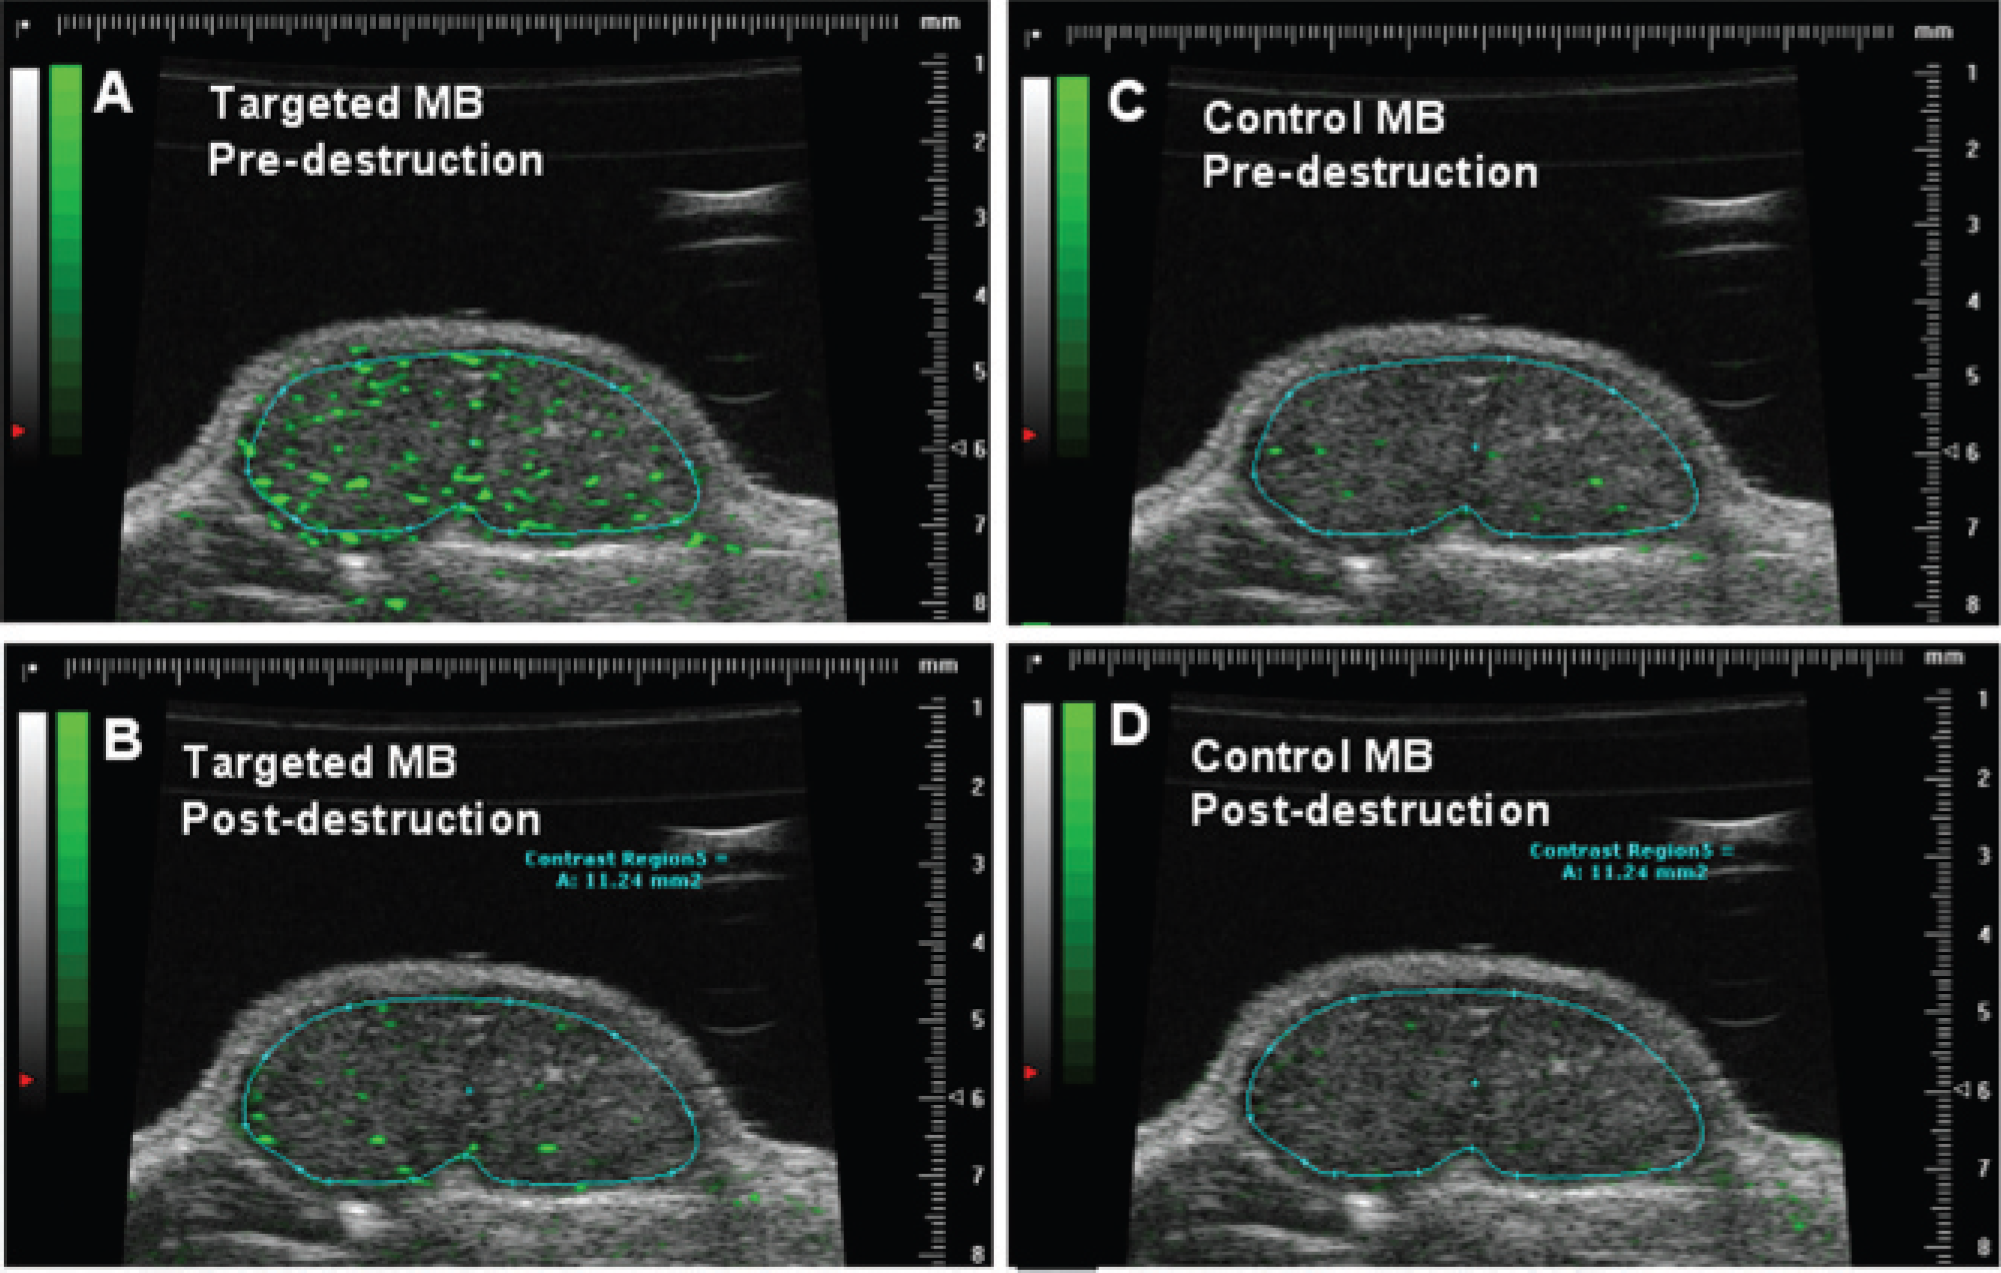
Representative frames in a single tumor before and after microbubble destruction. Vascular endothelial growth factor receptor 2-targeted microbubble signal (A) pre- and (B) post-destruction; control microbubble signal (C) pre- and (D) postdestruction. Microbubble-specific signal derived by digital subtraction is shown as a green overlay. Scale units are millimeters.
The molecular signal, defined as the 100-frame average of the reference-subtracted mean pixel amplitude predestruction minus that postdestruction, is shown in Figure 7A. The fraction of the ROI containing microbubbles (percent contrast) was quantified for targeted and control microbubbles in all nine mice, as shown in Figure 7B. A statistically significant difference in the pre- versus postdestruction percent contrast signal was detected for targeted, but not control, microbubbles, and the predestruction percent contrast was significantly greater for targeted versus control microbubbles.
Discussion and Conclusion
Site-targeted microbubble ultrasound contrast agents have been used to detect a variety of molecular markers in animal models of disease using conventional ultrasound imaging. We have adapted this technique for high-frequency microultrasound imaging and present evidence that this technique can be used to detect VEGFR-2 expression in a mouse model of tumor angiogenesis. Our strategy differs from previous efforts in that, by using high-frequency microultrasonography, it is possible to achieve a significantly higher spatial resolution. The microbubble contrast agent used here is an intravascular tracer, enabling imaging of intravascular molecular markers.

Representative predestruction frames of four different tumors after injection of targeted microbubbles. A relatively uniform targeted contrast signal was detected in each of the tumors imaged.

Reference-subtracted mean pixel amplitude as a function of time. Pixel amplitude was averaged over the region of interest at each frame. The temporal location of the microbubble destruction sequence is indicated by the black arrow. Both plots were obtained in the same mouse.
Ultrasound contrast agent detection at high frequencies differs from that used with conventional ultrasound imaging. Many clinical ultrasound scanners employ harmonic-based contrast imaging schemes, which are based on the nonlinear behavior of microbubbles in the 2 to 10 MHz range. 15 The acoustic properties of microbubble contrast agents at frequencies in the 20 to 40 MHz range are not fully understood, although nonlinear behavior, including ultra-harmonic, subharmonic, and second harmonic generation, has been reported for microbubbles in this range.16,17 Intravascular ultrasound imaging, operating in a similar high-frequency range, has also been used to generate nonlinear microbubble behavior18,19 and to detect echogenic liposome 20 and acoustic nanoparticle 21 ultrasound contrast agents using B-mode imaging.
A destruction-subtraction technique was used for targeted microbubble detection in this study. Destruction-subtraction takes advantage of the ability of high-power ultrasonography to destroy lipid-encapsulated microbubbles. Unlike clinical contrast imaging schemes that detect the nonlinear microbubble signal in realtime, the detection strategy reported here was entirely performed by postprocessing the B-mode imaging data using the Vevo contrast mode software (VisualSonics). Microbubble detection sensitivity was thus dependent on microbubble destruction; we achieved destruction adequate for imaging purposes in our peripheral tumor model. Additional optimization for orthotopic and deep-seated tumors may be required.

Microbubble signal. A, Molecular signal for targeted and control microbubbles. B, Percentage of region of interest containing microbubble-specific signal pre- and postdestruction for targeted and control microbubbles. **p < .01 and *p < .05.
We found that a microbubble dose of 1 to 5 × 10⁷ particles was effective to observe targeted retention. Although no adverse effects were observed on microbubble administration, these doses are approximately 5 to 10 times higher than doses typically used with conventional ultrasound imaging. The requirement for a higher dose is likely related to the physics of microbubble detection at high imaging frequencies. Although nonlinear scattering can occur, microbubble signals in our B-mode imaging system were likely due to predominantly linear acoustic scattering. We have not investigated the role of microbubble size in acoustic scattering, and it may be possible that only a subset of the administered microbubbles produces detectable backscatter at the frequencies used here. Additionally, we have not attempted to correlate the magnitude of the detected targeted acoustic signal with quantitative estimates of VEGFR-2 expression; such a comparison is important for rigorously demonstrating that our targeted microultrasound imaging technique can accurately measure molecular signals and will be presented in a subsequent study.
In summary, we have developed a system for high-frequency microultrasound imaging of targeted microbubbles in a mouse model of tumor growth. Although microbubble detection may be less sensitive at high frequencies, our system enabled successful and reproducible VEGFR-2 detection at unprecedented spatial resolution. The molecular signal parameter, which is independent of the backscatter from tissue and circulating microbubbles, was ≈4-fold higher for targeted relative to control microbubbles, similar to molecular imaging results reported in low-frequency ultrasound systems yet with the benefit of a 10-fold increase in spatial resolution. The results presented demonstrate that microbubble-based contrast-enhanced microultrasonography is a viable technique for molecular imaging in small animal models of disease.
Footnotes
Acknowledgments
The authors wish to acknowledge the financial support of the Canaduian Institutes of Health Research, the National Cancer Institute of Canada with funds from the Terry Fox Foundation, and the Ontario Research and Development Challenge Fund. FSF discloses a financial interest in VisualSonics.