
Abstract
The purpose of this study was to investigate the use of micro–computed tomography (micro-CT) for morphological and functional phenotyping of muscle LIM protein (MLP) null mice and to compare micro-CT with M-mode echocardiography. MLP null mice and controls were imaged using both micro-CT and M-mode echocardiography. For micro-CT, we used a custom-built scanner. Following a single intravenous injection of a blood pool contrast agent (Fenestra VC, ART Advanced Research Technologies, Saint-Laurent, QC) and using a cardiorespiratory gating, we acquired eight phases of the cardiac cycle (every 15 ms) and reconstructed three-dimensional data sets with 94-micron isotropic resolution. Wall thickness and volumetric measurements of the left ventricle were performed, and cardiac function was estimated. Micro-CT and M-mode echocardiography showed both morphological and functional aspects that separate MLP null mice from controls. End-diastolic and -systolic volumes were increased significantly three- and fivefold, respectively, in the MLP null mice versus controls. Ejection fraction was reduced by an average of 32% in MLP null mice. The data analysis shows that two imaging modalities provided different results partly owing to the difference in anesthesia regimens. Other sources of errors for micro-CT are also analyzed. Micro-CT can provide the four-dimensional data (three-dimensional isotropic volumes over time) required for morphological and functional phenotyping in mice.
In vivo cardiac imaging with isotropic three-dimensional resolution, however, is possible with micro–computed tomography (micro-CT). Our recently implemented micro-CT system 5 allows in vivo characterization of cardiac structure and function in mice, based on true four-dimensional data sets with an isotropic spatial resolution of 94 microns and a temporal resolution of 10 ms. 6 We have shown that cardiac micro-CT with a combination of a high-flux x-ray tube, precise physiologic gating, and the use of blood pool contrast agents results in images with voxels of ≈1 × 10⁻³ mm3, roughly 10 to 50 times higher spatial resolution than reported for MR microscopy.7,8
To determine if micro-CT can accurately characterize the morphological and functional features of failing cardiac murine hearts, we applied this imaging method to muscle LIM protein (MLP) null mice. The MLP is an essential regulator of cardiac muscle development. Mice lacking MLP develop dilated cardiomyopathy with myocardial hypertrophy and heart failure starting shortly after birth.9,10 MLP null mice reproduce the morphological, functional, biochemical, and gene expression changes seen in patients with the MLP gene mutations and dilated cardiomyopathy11–16 and have been used to identify therapeutic targets in dilated cardiomyopathy. 17 Imaging studies using echocardiography 11 and MR microscopy 18 have shown that in MLP null mice, the LV chamber is enlarged, the myocardium walls are thinned, and LV function is reduced.
Thus, the purpose of the present study was (1) to investigate the use of micro-CT in functional and morphological phenotypes of failing murine hearts and (2) to compare the micro-CT measurements with M-mode echocardiography.
Materials and Methods
Experimental Setup
Animal studies followed protocols approved by the Duke University Institutional Animal Care and Use Committee. MLP null mice (n = 7) and controls C57BL/6 mice (n = 7) were imaged with echocardiography and micro-CT on the same day. The M-mode echocardiographic imaging was described in detail in Rockman and colleagues. 17 We used an HDI 5000 echocardiograph (ATL, Bothell, WA) with a 9 MHz transducer. Animals were anesthetized with isoflurane (1.5–2%) delivered by a nose cone. Prior to micro-CT, the animals were anesthetized with an intraperitoneal injection of ketamine (115 mg/kg) and diazepam (27 mg/kg) and then perorally intubated for mechanical ventilation using an in-house-developed ventilator 19 at a rate of 90 breaths/min with a tidal volume of 0.4 mL. A solid-state pressure transducer on the breathing valve measured airway pressure, and electrodes (Blue Sensor, Medicotest, UK) taped to the animal footpads acquired an electrocardiographic signal. Both signals were processed with Coulbourn modules (Coulbourn Instruments, Allentown, PA) and displayed on a monitor using a custom-written LabVIEW application (National Instruments, Austin, TX). Body temperature was recorded using a rectal thermistor and maintained at 36.5°C by an infrared lamp and feedback controller (Digi-Sense, Cole Parmer, Chicago, IL). A catheter was inserted into the tail vein and used for the injection of the contrast agent Fenestra VC (ART Advanced Research Technologies, Saint-Laurent, QC) at a dose of 0.014 mL/g body weight. Fenestra VC is a newly developed blood pool agent consisting of iodinated triglycerides formulated in a stable, submicron, oil-in-water lipid emulsion20,21 containing 50 mg/mL iodine. Animals were placed on a Plexiglas cradle and scanned in a vertical position. During imaging, the anesthesia was maintained with ketamine (0.04 mL) delivered intraperitoneally about every 30 minutes.
Micro-CT System
The micro-CT system, described in detail elsewhere, 5 acquires projected radiographs of the animal as it is rotated in the vertical position in front of a high-resolution x-ray detector (X-ray ImageStar, Photonics Science, East Sussex, UK). The system has a large focal spot (1 mm) x-ray tube capable of producing high fluence rates with exposure times of less than 10 ms. Motion is minimized for any single projection by synchronizing exposures to both cardiac and breathing cycles (see Badea and colleagues 5 for details). The x-ray settings for the present studies were 80 kVp, 170 mA, and 9 ms per exposure. The scanning time was approximately 7 min/data set, and, on average, 8 points in the cardiac cycle (15 ms temporal resolution) were acquired. Each data set contained 170 projections acquired over a 187° arc. The projection images were next used to reconstruct tomograms with a Feldkamp algorithm and Parker weighting 22 using the Cobra EXXIM software package (EXXIM Computing Corp, Livermore, CA). The reconstructed data sets are three-dimensional image arrays (512 × 512 × 512) from which one can display two-dimensional slices in any orientation.
Dosimetric measurements were performed using a Wireless Dosimetry System Mobile MOSFET TN-RD-16, SN 63 B (Thomson/Nielsen, Ottawa, ON). Five MOSFET dosimeter silicon chips (1 mm 2 active area 0.2 × 0.2 mm) were positioned at the surface and the center of an acrylic rodent-like phantom.
Data Analysis
The resulting four-dimensional micro-CT images (three-dimensional volume images at multiple time points in the R–R cycle) were used for wall thickness and volumetric measurements throughout the cardiac cycle. Estimation of the LV diameter dimensions in diastole and systole and the wall thickness measurements, that is, interventricular septum (IVSW) and posterior wall (PW), were performed with ImageJ 23 in a midventricular slice.
The LV volumetric measurements were performed using the PSC Volume Browser (PSC-VB) developed by the Pittsburgh Super Computing Center (http://www.psc.edu/biomed/research/VB/).
An illustration of the LV volumetric estimation process is shown in Figure 1. In this approach, the user manually specifies a loosely defined three-dimensional region of interest (ROI). A few axial CT images (typically six) such as that shown in Figure 1A are used to draw an ROI similar to a basket that includes both the myocardium and the lumen (see Figure 1B). It is important that the outer basket perimeter is within the muscle except at the top aortic valve plane. Thus, the basket contains only two classes of voxels corresponding to blood and muscle. The voxels in the basket are next processed using a gaussian mixture modeling approach 24 to estimate the means and variances of the two classes, blood and myocardial tissue (the two peaks in the histogram shown in Figure 1C), and, consequently, the fraction of each of these components relative to the geometrically defined ROI volume. In addition to the direct measurement of LV blood volume, the process also produces a threshold value that best reproduces the measured LV volume according to a simple threshold segmentation of the ROI voxels. This segmentation serves as a visual feedback that approximates the direct volume measurement (Figure 1D).
Diastole and systole were selected as the heart phases that provided the maximum and minimum LV volume. Stroke volume (SV) and ejection fraction (EF) were calculated with the end-diastolic (EDV) and end-systolic (ESV) volumes (SV = EDV - ESV; EF = SV/EDV). For cardiac output (CO), SV was multiplied by heart rate (HR). Cardiac index was computed as the ratio between the CO and the body weight.
To validate the absence of distortions in the micro-CT and the accuracy of the volumetric measurements performed with PSC-VB software, we imaged a phantom containing a calibration grid and two vials with 0.4 and 0.2 mL solutions of Isovue 370 (Bracco Diagnostic, Princeton, NJ) with 50 mg iodine/mL concentration.
Statistical analysis was performed using two unpaired t-tests on the micro-CT data and M-mode echocardiography for comparison of the MLP null mice and their controls. Comparison of correlation between wall measures (PW, IVSW), fractional shortening (FS), and heart rate (HR) with the two modalities was performed as described by Bland and Altman. 25
Results
Micro-CT images of the phantom containing two vials and a calibration grid are shown by Figure 2. No geometric distortions were visible in the reconstructed grid (see Figure 2C). The volumetric measurements performed using the PSC-VB software were 98% accurate.
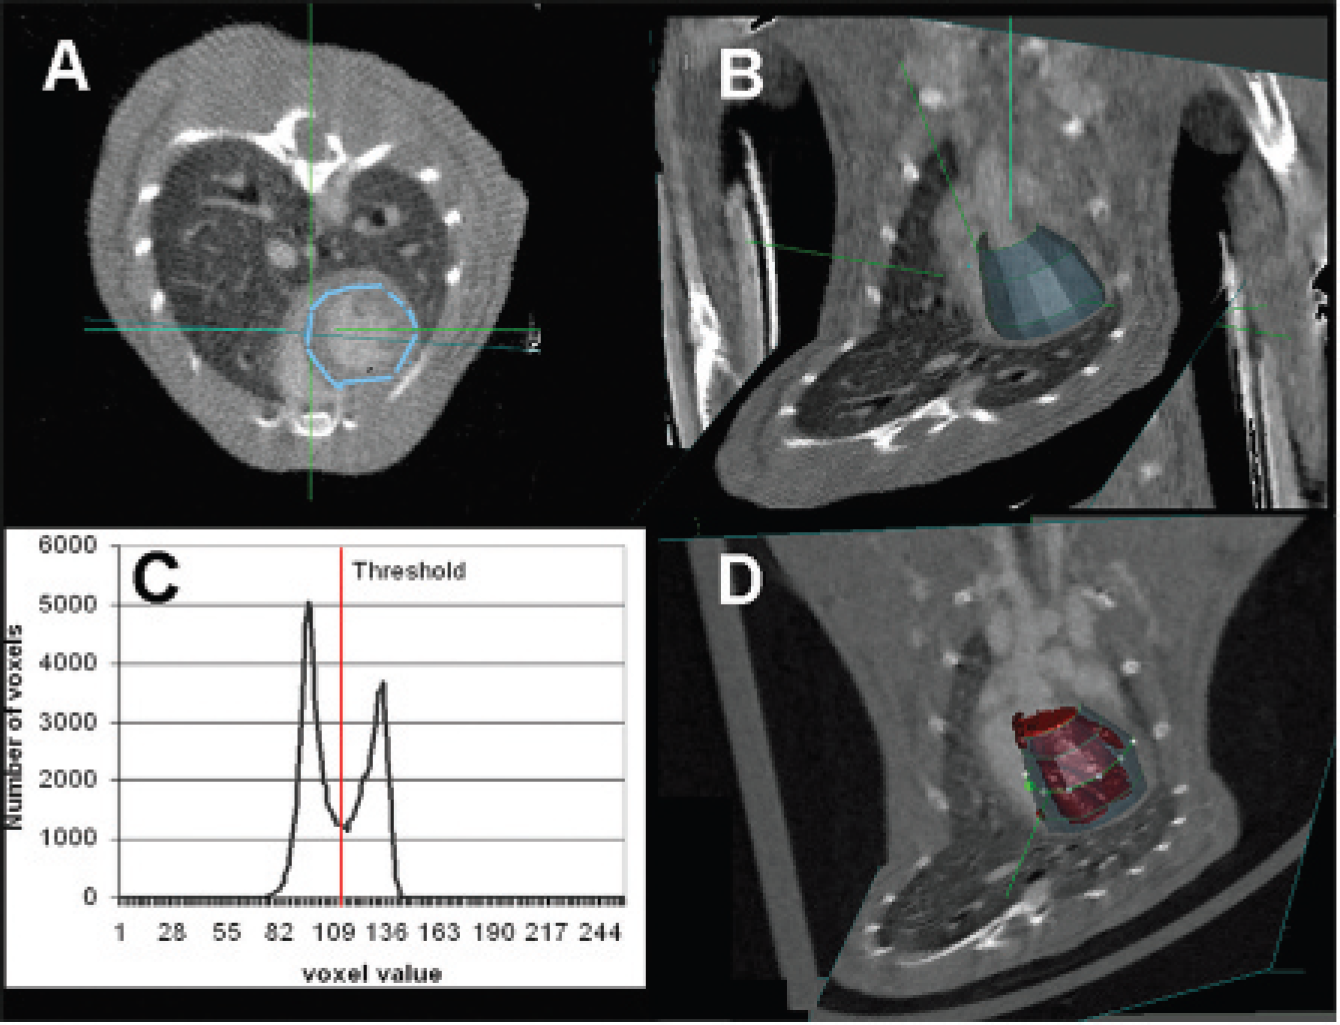
The left ventricular (LV) volumetric estimation process using the PSC Volume Browser: The axial computed tomographic images (A) are used to set a basket that includes both the myocardium and the lumen (B). An optimal threshold is computed for the bimodal histogram (C) between the two peaks of the plot (vertical line; see text for details), and the LV volume of the blood (D) is visualized and estimated.

The measurements of the calibration phantom: axial (A) and oblique slices (B, C) (cuts along lines) showing no geometric distortions (C) owing to the reconstruction process. The volumetric measurements were 98% accurate.
Micro-CT with blood pool contrast agent Fenestra VC achieves high-resolution images with sufficient contrast to noise levels. Thus, for a contrast agent (Fenestra VC) dose of 0.014 mL/g mouse, the average signal intensity difference between the myocardium and the blood pool in the LV was approximately 310 HU and the noise level about 72 HU, resulting in a contrast to noise ratio (CNR) of 4.3. The noise was measured in an air region defined just outside the mouse chest. Thus, we satisfied the limit imposed by the Rose criterion for contrast detectability with CNR that ranges between 3 and 5. 26 The radiation dose during micro-CT scanning of a mouse at 8 points on the cardiac cycle was 0.8 Gy.
Real four-dimensional data at isotropic 943-micron spatial resolution and with 15 ms temporal resolution were visualized as seen in Figure 1. Because the micro-CT data sets have isotropic resolution, the same image quality is possible in any imaging plane. Typical images corresponding to end-diastole (axial and coronal slices) are shown in Figure 3 for an MLP null mouse (A, B) and a C57BL/6 control mouse (C, D). Note the enlarged ventricles and the myocardial wall thinning in the MLP null mouse compared with the control mouse. A sequence of eight axial micro-CT images of an MLP mouse acquired during the cardiac cycle is shown in Figure 4.
The segmented LV volumes in diastole for one MLP and one C57BL/6 mouse are shown in Figure 5, A and B. The time-volume curve of these LV volumes is shown in Figure 5C. Note that the MLP null mouse shows an approximately three times larger ventricular volume in diastole than seen in the C57BL/6 control. The weight of these two representative mice was 33 g for the MLP null mouse and 30.5 g for the C57BL/6 mouse.
Micro-CT-based measurements (mean and standard errors) are given in the plot in Figure 6A, whereas Figure 6B shows the results for the measurements obtained with M-mode echocardiography for both the MLP null mouse and the C57BL/6 mouse. With the exception of wall thickness (PW, IVSW) and cardiac index, all micro-CT-measured values for the MLP null mice are significantly different than for the C57BL/6 mice. The same situation with one exception (PW) is shown in Figure 6B but with M-mode echocardiography data.
The Bland-Altman plots for common measures between the two imaging modalities are shown in Figure 7 for PW (A), IVSW (B), FS (C), and HR (D).
The graphs plot the differences versus the average values between the measurements with the two imaging modalities for each animal. In all graphs, the mean differences are different from zero, suggesting the existence of a bias, but there is no apparent trend in the distribution of the differences and the values are in the limits of agreement of 2 SD.
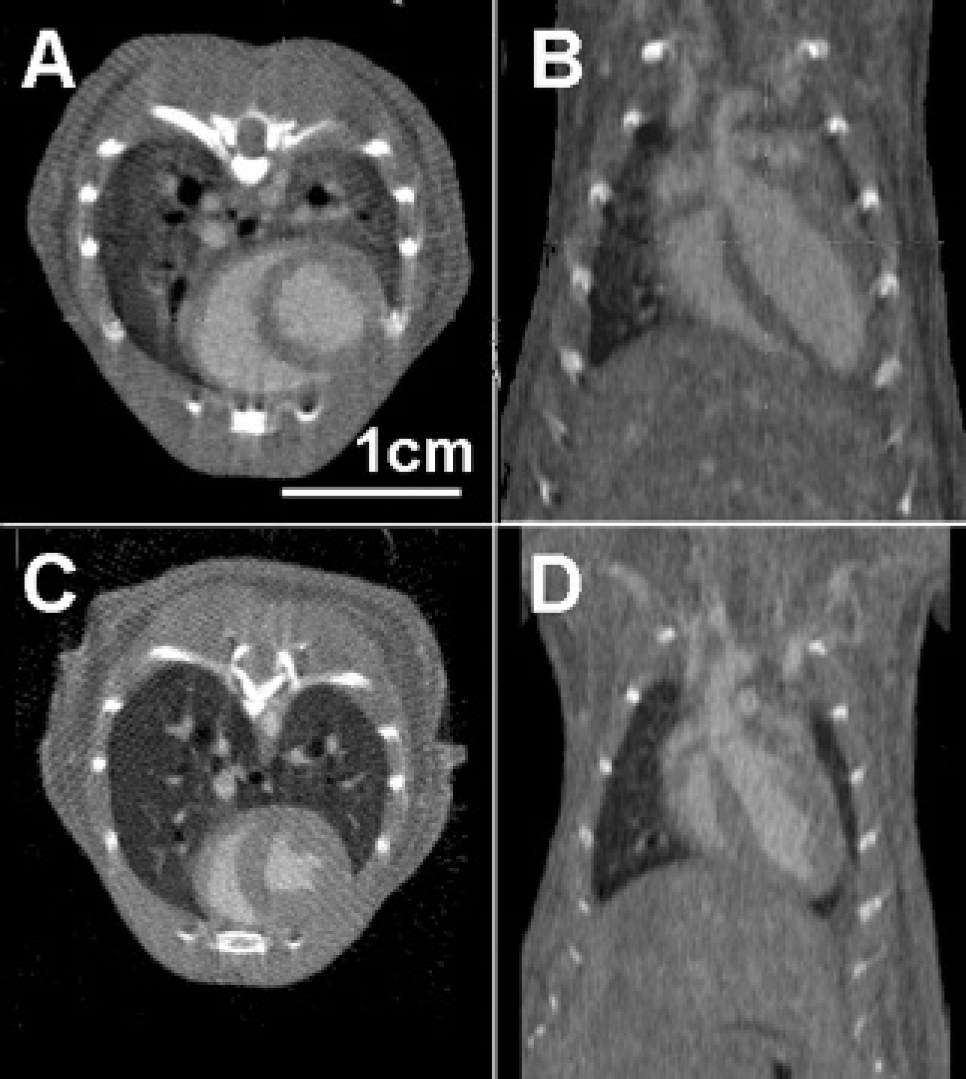
An example of images corresponding to diastole (axial and coronal cuts) for an MLP (A, B) and C57BL/6 (C, D) control mice.
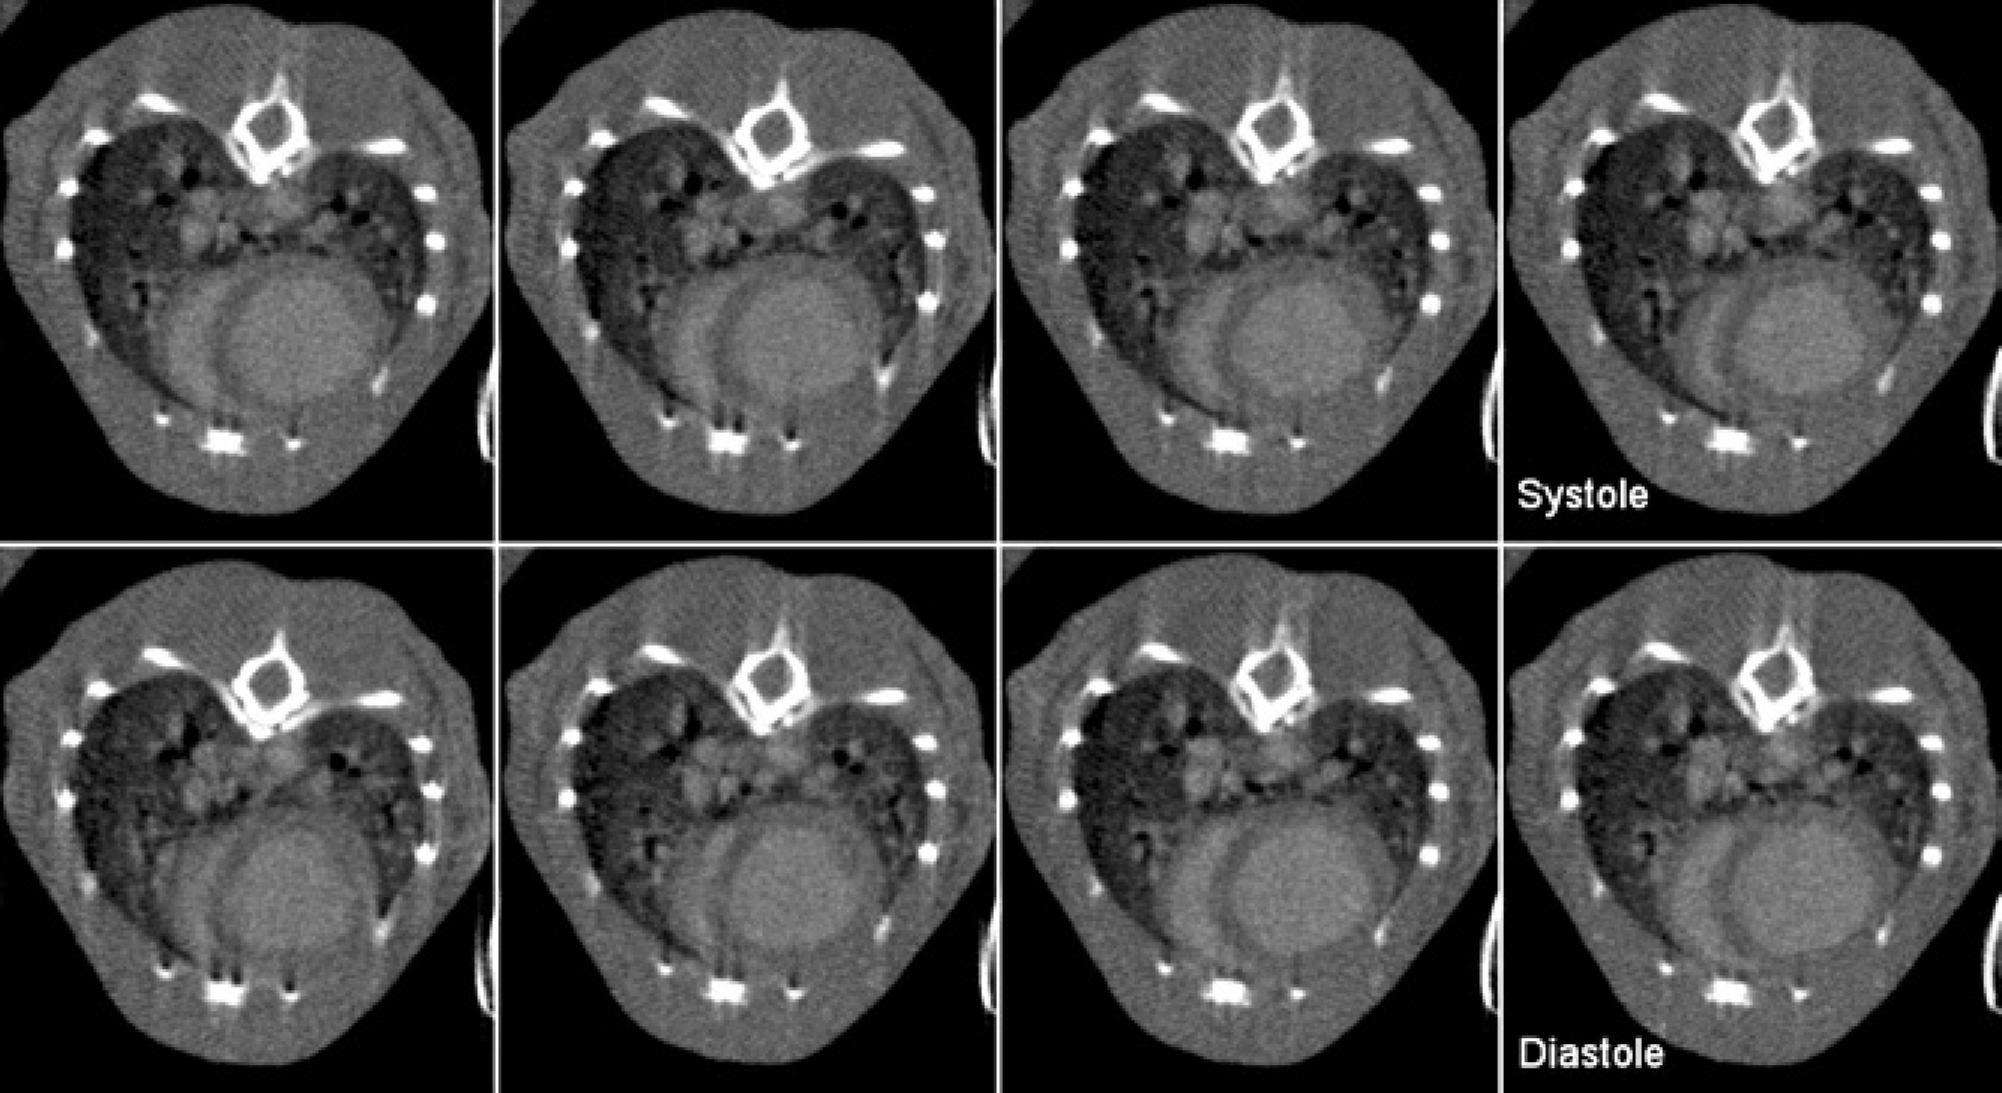
Images of the same axial slice through an MLP mouse corresponding to 8 points, that is, every 15 ms in the cardiac cycle (R–R = 120 ms) starting from the R peak.

A comparison of the left ventricular (LV) volumes for an MLP null mouse (A) and a C57BL/6 (B) mouse in diastole. The time volume curves (C) for the LV in MLP null and C57BL/6 mice: y-axis is the LV volume, and x-axis is time from the R peak. Note the larger LV volumes of the MLP null mouse, indicating an enlarged ventricle.
Discussion and Conclusions
This study demonstrates our unique ability to obtain four-dimensional cardiac data from mice using micro-CT. As shown here, both morphological (LV dilatation) and functional parameters values such as EF, SV, CO, and FS were found to be significantly different in the MLP null mice versus controls (see Figure 6A). Compared with control mice, in MLP null mice, the EDV was three times greater and the ESV was increased fivefold. However, the EF was reduced by an average of 32% in MLP null mice versus the C57BL/6 mice, indicating dilated cardiomyopathy with hypertrophy. Some of our results compare well with those provided by Wilding and colleagues using MR microscopy. 18 For example, the EF for C57BL/6 mice was 59.6% with micro-CT and 66% with MR microscopy, whereas for MLP null mice, the EF was 27.8% with micro-CT and 25% with MR microscopy. However, in our case, the CO and SV were larger for the MLP null mice. This could be due to the larger body size of the MLP mice. Indeed, after normalization to the body weight, the cardiac index becomes similar (0.39 for the MLP null versus 0.31 for C57BL/6 mice) and is not significantly different (see Figure 6A).

Mean and standard error plots for micro–computed tomography (A) and M-mode echocardiography (B). BW = body weight; CI = cardiac index; CO = cardiac output; EDV = end-diastolic volume; EF = ejection fraction; ESV = end-systolic volume; FS = fractional shortening; HR = heart rate; IVSW = intraventricular septum wall; LVDD = left ventricle diameter in end-diastole; LVSD = left ventricle diameter in end-systole; PW = posterior wall thickness. Statistical significance (p < .05, unpaired t-test) is visually marked by the asterisk on the graphs.
As shown by Bland-Altman plots (see Figure 7), the two modalities, that is, micro-CT and M-mode echocardiography, provided different results for the same measures (the mean of differences is not zero) but within the limits of agreement of 2 SD. The reasons for such differences can be attributed partly to the different HRs (see Figure 7D) and anesthesia regimens (ketamine for micro-CT and isoflurane for M-mode echocardiography). We notice an average difference of about 0.3 mm in the wall thickness (see Figure 7, A and B) and of about 15% in FS.
Micro-CT allows in vivo estimation of functional measures based on LV that are not possible with M-mode echocardiography (compare A and B of Figure 6). Typically, the long-axis measurements are very difficult and inaccurate using M-mode echocardiography. Some current M-mode methods to measure LV volumes in murine hearts are invasive as they use piezoelectric crystals surgically attached to the wall of the heart. This approach was used by Esposito and colleagues to obtain LV volumes in MLP null mice. 11 They found, similar to our results, that MLP null mice had an almost equal and even slightly larger cardiac index than their controls in this open chest study.
However, cardiac micro-CT in mice is not without problems. A temporal resolution of 15 ms in sampling could cause inaccurate determination of the ESV and EDV.
In a different experiment, we acquired data using retrospective gating and reconstructed with projection images binned postacquisition in various numbers of time points in the cardiac cycle. We noticed a reduction of 3% in EF estimation when the time points were reduced from 10 to 8 in the cardiac cycle. Increased temporal resolution would require a larger number of data sets, requiring more sampling time and an increased radiation dose. We were able to achieve a 10 ms temporal resolution in other studies.27,28 However, in the present study, we compromised on the temporal resolution versus the duration of our imaging session to keep the scanning time to less than 1 hour.
Another concern with the present study is the vertical positioning of the animal during micro-CT. It is well known that such a position in larger mammals and humans results in an orthostasis effect, that is, a reduction in venous return, LV volumes, and CO. 29 However, this effect is not observed in rodents. The influence of a vertical body position on murine systemic blood pressure and LV hemodynamics over time has been investigated with MR microscopy.4,30 These studies showed that tilting to the vertical position had no significant changes in murine LV hemodynamics. Similar results were seen in rats. 31 An acceptable explanation could be that the column of fluid in a rodent is only a few centimeters; therefore, the small gravitational effect is negated by the autoregulatory system. Thus, the vertical position was not considered to be an issue in our study.
Additionally, cardiac micro-CT involves the use of an injected blood pool contrast agent that could affect the hemodynamics owing to hypervolemia. Considering that mice have a blood volume that is about 6% of the body weight, by injecting Fenestra VC in a dose of 0.014 mL/g, we added ≈20% to the blood volume. But according to one study, an increase in hypervolemia of ≈30% in the total blood volume by adding saline did not significantly affect the cardiac index in mice. 32 We note, however, that the contrast agent used here is a lipid emulsion, and we do not know its influence on hemodynamics.

Bland-Altman plots using both micro–computed tomography and echocardiography data for posterior wall thickness (A), intraventricular septum wall (B), fractional shortening (C), and heart rate (D). The heavy line is the mean difference between the two imaging methods, and the stroked lines represent ± 2 SD. The square symbols represent MLP null data, whereas the triangle symbols show the C57BL/6 data.
MR microscopy is considered to be the gold standard for in vivo measurement of cardiac morphology function, and new methods, such as three-dimensional echocardiography, are often compared with MR microscopy. 3 But micro-CT has the potential advantage over MR microscopy by providing isotropic resolution. This is not the case with MR microscopy, in which typically a number of axial slices are scanned and the LV volume is estimated by interpolation between axial slices acquired every 1 mm. 33 When comparing MR microscopy and micro-CT, isotropic resolution, however, should not be considered isolated. The inferior spatial resolution of MR microscopy is counterbalanced by a higher temporal resolution, higher tissue contrast, and its versatile character, that is, the ability to measure perfusion, tagging, targeted molecular imaging contrast studies, or spectroscopic metabolic studies.
More recently, new echocardiographic systems (VisualSonics Inc, Toronto, ON) are available for small animals and are able to provide B-mode measurements in small animals. We add, however, that although echocardiography seems to be the method of choice to estimate cardiac function, it still uses some model-based estimations that rely on geometric assumptions that are appropriate only for normal hearts.34,35
Another invasive method to measure LV volume in mice is based on conductance catheters, but a recent study compared the conductance catheter measurements with those from MR microscopy and found that the absolute volumetric values are strikingly underestimated by conductance catheter measurements. 36
In conclusion, we show how micro-CT can characterize cardiac anatomy and function in a genetic model of dilated cardiomyopathy. The use of truly isotropic voxels with a volume resolution more than 10 times that of previous methods provides a significant increase in both precision and accuracy over both echocardiography and MR microscopy. This technique has a great potential to become an important tool in cardiac phentoyping, and this article reports on our first attempts toward such a goal.
Footnotes
Acknowledgments
We thank Art Wetzel and Stu Pomerantz from the Pittsburgh Supercomputing Center for their help with the PSC-VB software and Sally Zimney for editorial assistance.