
Abstract
The biodistribution of two near-infrared fluorescent agents was assessed in vivo by time-resolved diffuse optical imaging. Bacteriochlorophyll a (BC) and cypate-glysine-arginine-aspartic acid-serine-proline-lysine-OH (Cyp-GRD) were administered separately or combined to mice with subcutaneous xenografts of human breast adenocarcinoma and slow-release estradiol pellets for improved tumor growth. The same excitation (780 nm) and emission (830 nm) wavelengths were used to image the distinct fluorescence lifetime distribution of the fluorescent molecular probes in the mouse cancer model. Fluorescence intensity and lifetime maps were reconstructed after raster-scanning whole-body regions of interest by time-correlated single-photon counting. Each captured temporal point-spread function (TPSF) was deconvolved using both a single and a multiexponental decay model to best determine the measured fluorescence lifetimes. The relative signal from each fluorophore was estimated for any region of interest included in the scanned area. Deconvolution of the individual TPSFs from whole-body fluorescence intensity scans provided corresponding lifetime images for comparing individual component biodistribution. In vivo fluorescence lifetimes were determined to be 0.8 ns (Cyp-GRD) and 2 ns (BC). This study demonstrates that the relative biodistribution of individual fluorophores with similar spectral characteristics can be compartmentalized by using the time-domain fluorescence lifetime gating method.
Fluorescence techniques developed for probing molecular events in vitro have been translated to in vivo optical molecular imaging because of concurrent development of narrowband laser light sources, fast photodetection electronics, sophisticated image reconstruction algorithms, and the use of near-infrared (NIR) fluorescent molecules conjugated to tumor targeting moieties such as antibodies, peptides, and peptidomimetics.6–9 Imaging living systems in the NIR region between 700 and 900 nm is attractive because low tissue absorption of light allows excitation photons to reach deep tissues, thereby extending the utility of optical imaging beyond superficial organs and tissues. Unfortunately, the NIR organic fluorescent dyes used to image molecular processes in living systems have broad absorption and emission spectra, limiting multiplexing of diagnostic information from two or more NIR dyes targeting the same or different cancer biomarkers. Spectral unmixing techniques can be used to separate overlapping fluorophore spectra 10 but do not provide functional information about the regional tissue physiology.
In contrast to fluorescence intensity imaging, fluorescence lifetime mapping of the distribution of NIR molecular probes in living systems is not limited by overlapping excitation and fluorescence spectra of many NIR dyes if they have sufficiently different fluorescence lifetimes. Moreover, since the fluorescence lifetime can be sensitive to the probe's microenvironment, it can furnish additional information relating to the functional status of tumors relative to surrounding nontumor tissues.11,12 Implementation of NIR fluorescence lifetime imaging will accelerate the full realization of the roles and benefits of diverse biomarkers and molecular targets in disease management by molecular imaging. The purpose of this study is to assess the feasibility of resolving the distribution of a cocktail of fluorophores in mice by using time-resolved diffuse optical imaging.
Materials and Methods
Near-Infrared Imaging Agents
Bacteriochlorophyll (BC) from Rhodopseudomonas sphaeroides was purchased from Frontier Scientific (Logan, UT), 17-β-estradiol pellets (60-day release) from Innovative Research of America (Sarasota, FL), 5% dextran for injection and Nexaban tissue adhesive from Abbot Laboratories (Chicago, IL), and 10% Tween from Sigma-Aldrich (St. Louis, MO). The peptide-linked NIR optical imaging agent cypate-glycine-arginine-aspartic acid-serine-proline-lysine-OH (Cyp-GRD) was prepared by a method described in the literature13,14 and characterized using a mass spectrometer (LCMS-2010A, Shimadzu, Columbia, MD). The contrast agents were formulated in 1% Tween and further diluted in swine plasma to obtain a concentration of less than 1 μM for absorption and fluorescence measurements using a UV-Visible spectrophotometer (DU 640, Beckman Coulter, Fullerton, CA) and a fluorometer (Fluorolog-3, Jobin Yvon/Horiba, Edison, NJ), respectively. The absorption and emission spectra of the compounds are shown in Figure 1.
Animal Studies
All animal studies were performed in compliance with institutional requirements for the humane care and use of laboratory animals in research. Six 4-week-old male NCr nu/nu mice were anesthetized with ketamine (87 mg/kg) and xylazine (13 mg/kg) via intraperitoneal injection. A 5 mm incision was made through the left dorsal cervical skin, an estradiol pellet was inserted into the subcutaneous pocket, and the incision was closed with tissue adhesive. After 72 hours, human breast cancer MDA-MB-361 cells (3 × 10⁶) were injected subcutaneously in the right and left flanks of each mouse. Tumors were allowed to grow to 7 to 10 mm maximum diameter before treatment. For in vivo imaging, mice were anesthetized with the ketamine-xylazine cocktail as above. The fluorescent imaging agents were dissolved completely in ethanol. The resultant solution was added to 10% Tween 80, sonicated 30 minutes to ensure dispersion, and then diluted to 1% Tween 80 in 5% dextrose to give a working solution. Concentrations were determined by absorbance method using published extinction coefficients of 297,000 M−1 cm−1 for cypate 15 and 60,000 M−1 cm−1 for BC. 16 Solutions of the contrast agents were injected (100 μL) intravenously via the lateral tail vein at 400 nmol (BC) and 30 nmol (Cyp-GRD) per kilogram of body weight. Different concentrations of the contrast agents were used to normalize their fluorescence intensities at equimolar concentration using the 780 nm excitation source.
Imaging Method and Analysis
In vivo mouse images were acquired with a time-domain diffuse optical imaging system (eXplore Optix, GE Healthcare, Waukesha WI), as reported previously. 17 Briefly, the animals were positioned in ventral recumbency on the heated imaging platform. Images were acquired at 1, 6, and 24 hours postinjection. The optimal imaging height was ensured by side-view charge-coupled device (CCD) camera. The two-dimensional scanning region of interest (ROI) was selected by top-view CCD camera to include the area from the neck to the pelvis, including the estrogen pellet, chest, abdomen, and tumor areas. ROI were raster-scanned for absorption at 780 nm and emission at 830 nm in 1.5 mm increments. Laser power was maintained at 0.04 μW for absorption scans. For fluorescence imaging, the laser power was adjusted for optimal signal strength: 300 μW for preinjection images and 50 μW after molecular probe administration.

Left, Structures of bacteriochlorophyll (BC; 1) and cypate-glysine-arginine-aspartic acid-serine-proline-lysine-OH (Cyp-GRD; 2). Right, Absorption (dashed) and fluorescence (solid) spectra for BC and Cyp-GRD in swine plasma. Solutions were excited at 730 nm to obtain the full fluorescence spectral profiles for both compounds.
Acquired images were analyzed with the Analysis Workstation software provided by ART, Inc. (Montreal, QC). Raw fluorescence data were smoothened by the program using photoinformation from the absorption scan. Fluorescence lifetimes for individual data points were obtained from the temporal point-spread functions (TPSFs) and used to create a lifetime map. At each point, contributions from each of the fluorophores are expected to result in biexponential decay of the TPSFs. In some ROI, we observed that only a single fluorophore contributes to the signal with a clean single exponential model, whereas in other ROI, two decays needed to be modeled. Thus, by fitting to a mono- or biexponential model using a weighted least squares algorithm adapted for photon counting noise (Poisson distribution), the spatial map of lifetime distribution was recovered. In regions where there was insufficient fluorescence signal to estimate lifetime (ie, outside the fluorescent regions), the estimates were not used for the lifetime analysis owing to a lack of statistical significance of the TPSF fit.
Results
Molecular Probes and Spectral Characterizations
In designing the study, we chose two fluorophore systems that absorb and emit light in the NIR wavelengths at 780 nm and 830 nm, respectively, but possess different fluorescence lifetimes. We also needed optical molecular probes that could distribute unevenly to different tissues in mice for fluorescence lifetime mapping. As shown in Figure 1, both BC and Cyp-GRD possess spectral profiles that are susceptible to imaging at the desired NIR wavelengths, with average lifetimes of 2.5 ns 18 and 0.8 ns, 17 respectively, in solutions. The long hydrophobic side chain for BC and hydrophilic peptide for Cyp-GRD are expected to have different pharmacodynamics and biodistribution in mice. Formulation of both contrast agents in 1% Tween prevented the formation of aggregates, which was observed in aqueous dimethylsulfoxide solution of the hydrophobic BC.
Intrinsic Fluorescence Intensity and Lifetime Maps of Untreated Tumor-Bearing Mice
Nude mice were used for this study because a variety of human tumor xenografts grow in this species and the hairless mice are suitable for optical imaging by eliminating light scattering owing to animal fur. As part of an ongoing study, we used the human breast cancer cell line MDA-MB-361 for this work. To facilitate the growth of these estrogen receptor–positive cells in nude mice, we implanted estradiol pellets at the left dorsal cervical skin. 19 Optical imaging of untreated mice with 300 μW laser power was conducted to establish the level and range of background fluorescence intensity and lifetime, respectively. The data captured during in vivo imaging were displayed as fluorescence intensity maps with individual pixel values representing the area under respective TPSF curves. Each TPSF was deconvolved to determine the respective fluorescence lifetime(s) of fluorophores within the tissue at that point. 20 The result showed multiexponential lifetime decays or more complex behavior with the majority of signals at 0.3 to 0.5 ns and 1.7 ns (Figure 2). Here the background fluorescence lifetime measures scattered photons from the excitation pulse and the intrinsic fluorescence from tissue and blood components. Although the resulting TPSF fits a multiexponential function (see Figure 2C), the shortest exponential decay value of 0.28 ns is likely representative of the instrument response function (IRF), which includes a contribution from the excitation laser pulse width, and does not originate from an intrinsic fluorophore lifetime decay contribution. Most of the fluorescence signal from the untreated mice was detected in the kidney, liver, and estrogen pellet regions, reflecting the differences in tissue optical properties and refractive indices. Animal chow in the stomach and intestines, composed of fluorescent materials, could contribute to the intrinsic fluorescence in mice, as shown by the longer fluorescence lifetime of 1.7 ns in the untreated mice (see Figure 2C). Typically, this signal would be much brighter if imaged in the visible wavelengths, demonstrating the advantage of using NIR imaging. Because the background fluorescence is low and the intrinsic lifetimes are different from those of exogenous contrast agents used in this study, background fluorescence intensity and lifetimes can be readily eliminated without subjecting the animal to special diets, such as chlorophyll-free foods. 21 At the much lower excitation laser power (50 μW) used for the treated mice, the signal for the untreated mice was practically nonexistent.

In vivo fluorescence intensity (A) and lifetime (B) images of an untreated mouse with specific regions labeled: 1 = estrogen pellet; 2 = liver; 3 = kidney. Fluorescence intensity is relatively low despite 300 μW laser power (see color scale bar). Fluorescence lifetime dominating at all points is below 0.35 ns and corresponds to a mixture of instrument response function (the dominant part) and autofluorescence. Temporal point-spread function (TPSF) (C) acquired from the untreated mouse, which displays a mixture of the instrument response (initial phase, 0.28 ns) and autofluorescence (later phase, 1.7 ns). This TPSF is not monoexponential, as expected.
Fluorescence Intensity and Lifetime Maps of Bacteriochloropyll in Tumor-Bearing Nude Mice
Having established the optical properties of the untreated mice, we administered the exogenous contrast agents separately in mice animals to establish their individual biodistribution profiles and optical properties. Representative white-light images of mice with overlaid fluorescence intensity and lifetime maps and TSPFs for BC are shown in Figure 3. The fluorescence signal was most concentrated in the regions of the liver, kidneys, tumor, and estradiol pellet (see Figure 3A). The fluorescence lifetime of BC in vivo was determined to be 2.2 ns. This value is similar to the average lifetime of 2.5 ns measured for BC in organic solvents that have hydrogen-bonding and metal-chelation propensities most similar to the likely conditions in vivo. 18 The monoexponential log decay is visibly less steep than those from the untreated and Cyp-GRD treated mice (see below). Longitudinally, the lifetime of BC in vivo did not vary significantly with time over the measurement period but was slightly lower (< 2.1 ns) in the liver and kidneys relative to other ROIs. This may be due to differences in the environment presented to the BC in these organs, giving a change in hydrogen bonding to its peripheral substituents, a change in ligation state of the central magnesium, or perhaps demetallation to give bacteriopheophytin, which has a lifetime of 2 ns in solution. 22
Fluorescence Intensity and Lifetime Maps of Cyp-GRD in Tumor-Bearing Nude Mice
In contrast to BC, the noninvasive fluorescence intensity image of the Cyp-GRD-treated mouse (Figure 4) showed that the molecular probe accumulated in the kidneys and estradiol pellet, with very low fluorescence in the breast tumor xenograft (see Figure 4A). However, the fluorescence lifetime best fit a monoexponential model similar to BC, with measured lifetime of 0.8 ns (see Figure 4B). At 24 hours postinjection, the measured fluorescence lifetime for Cyp-GRD remained at 0.8 ns in all ROI except the kidney and liver regions, where it increased to about 0.9 ns in the same region measured longitudinally. These results are not due to decreased detected fluorescence signal but indicate real fluorophore lifetime changes owing to environmental effects or metabolism of the fluorophore. Future studies will investigate the physical and biochemical factors responsible for the changes in measured fluorescence lifetime in vivo.

Fluorescence intensity (A) and lifetime (B) maps of a nude mouse with bilateral subcutaneous flank tumors after injection of bacteriochlorophyll (BC) and a representative temporal point-spread function (TPSF) (C) from the mouse after injection of BC; 1 = estrogen pellet; 2 = liver; 3 = kidney; 4 = tumor.
Fluorescence Intensity and Lifetime Maps of a Cocktail of Bacteriochloropyll and Cyp-GRD in Tumor-Bearing Nude Mice
The strength of using fluorescence lifetime detection in this study is the ability to delineate the distribution of a mixture of BC and Cyp-GRD in the same mouse, thereby allowing the multiplexing of information under identical imaging conditions. To explore this feasibility, we injected a cocktail of the two contrast agents in a different set of breast tumor–bearing mice. The in vivo biodistribution of the coinjected molecular probes is shown in Figure 5. The fluorescence intensity map (see Figure 5A) suggests a distribution profile of the molecular probe mixture similar to a combination of the individual probes shown in Figures 3 and 4. The mean fluorescence lifetime of the combined molecular probe cocktail derived from the acquired signal is shown in Figure 5B. The proportion of fluorescence signal from each fluorophore was determined by averaging the area under the curve of each lifetime region and plotted against time. The measured fluorescence lifetimes indicate that the hydrophobic BC remains in the mouse much longer than the hydrophilic Cyp-GRD. Deconvolution of the combined lifetimes into the component fluorophore systems demonstrates that fluorescence lifetime gating can be used to map the distribution of each molecular probe (see Figure 5, D-F). The measured fluorescence lifetime components indicate that Cyp-GRD signal is localized in the regions of the estrogen pellet, liver, and kidneys 24 hours after injection, whereas BC is distributed throughout the body and tumor. These results clearly illustrate the utility of fluorescence lifetime detection in optical imaging.

Fluorescence intensity (A) and lifetime (dominant component) (B) maps 24 hours after injection of cypate-glysine-arginine-aspartic acid-serine-proline-lysine-OH (Cyp-GRD) in a nude mouse. Representative temporal point-spread function (TPSF) (C) acquired 24 hours after injection of Cyp-GRD; 1 = estrogen pellet; 2 = liver; 3 = kidney; 4 = tumor.

Fluorescence intensity (A) and lifetime (B) maps 24 hours after injection of bacteriochlorophyll (BC)–cypate-glysine-arginine-aspartic acid-serine-proline-lysine-OH (Cyp-GRD) cocktail; 1 = estrogen pellet; 2 = liver; 3 = kidney; 4 = tumor. Representative temporal point-spread function (TPSF) (C) from the mouse 24 hours after injection of the BC-Cyp-GRD cocktail, which demonstrates multiexponential decay. Deconvolution of this multiexponential decay recovered 0.7 ns and 2.4 ns components and allowed separation of the signals. D and E are the lifetime-weighted fluorescence intensity maps of the long lifetime component (> 1.5 ns) and the short lifetime component (> 1.5 ns) and show the relative biodistribution of the two fluorophores. Similarly, the TPSF (C) represents the combined fluorescence decays of BC and Cyp-GRD as demonstrated by the separated decays in F.
Discussion
Fluorescence microscopy has revolutionized the imaging of molecular and physiologic processes at the cellular level. 23 Critical to these successes is the availability of fluorescent dyes and materials that interact with the target molecules or localize in a desired cellular compartment with high specificity. Previous studies have shown that similar studies could be conducted in living systems at the tissue level. For deep tissue imaging, the favorable light-tissue interactions in the NIR wavelengths between 700 and 900 nm have resulted in the development of NIR fluorescent dyes for in vivo imaging. 6 An added advantage of these organic dyes is the flexibility in selecting light sources and emission filters for optical imaging because of their broad excitation and emission spectra (see Figure 1). However, the same physical properties present problems for multiplexing biologic data when more than one NIR molecular probe is needed. Recent studies have shown that quantum dots and other luminescent nanomaterials have broad excitation but narrow emission bands. 24 Despite these and other advantages, large-scale commercial availability of quantum dots, reproducibility, and characterization of quantum dot derivatives remain important limitations. Moreover, unlike most nanomaterials, many organic dyes have been used in humans without deleterious effects to patients. Consequently, methods that will allow multiplexing of contrast agent–mediated optical imaging in the NIR window are highly desirable.
One such approach is to use the fluorescence lifetime properties of NIR organic molecular probes. Previously, we demonstrated the feasibility of imaging tumors by using the fluorescence lifetime of a NIR tumor-targeted molecular probe, Cyp-GRD. 17 Comparison of the fluorescence intensity and lifetime images showed identical biodistribution profiles of the molecular probe in mice. Further analysis revealed that the measured lifetimes in the A549 lung tumor were slightly elevated relative to other tissues, suggesting a higher metabolic rate in the proliferating tissue. In addition to proving functional information, we demonstrated in the present study that the biodistribution of two NIR fluorophore systems can be separated on the basis of differences in their fluorescence lifetimes. This will allow future development of methods to target different molecular events and monitor their expression with the same laser input and detector system. To accomplish this goal and simplify in vivo imaging protocols, the fluorophore systems would ideally have similar absorption and emission maxima, molar absorptivity, and fluorescence quantum yield. A further restriction on the choice of fluorophores systems for this study was imposed by our time-domain optical imaging system, which has a single excitation laser operating at a 780 nm and 830 nm detector system. As shown in Figure 1B, BC and Cyp-GRD can be excited at 780 nm and have distinct fluorescence lifetimes. A closer analysis of the data showed that the fluorescence intensity of Cyp-GRD is much higher than that of BC at 830 nm using equimolar concentrations of both fluorophores. This can be traced largely to the lower molar absorption coefficient of BC than Cyp-GRD at the 780 excitation wavelength. Consequently, we normalized the fluorescence intensity by using more than 10-fold excess of BC relative to Cyp-GRD for this study.
Although none of the contrast agents used in this study were targeted specifically to the breast tumor, the hydrophobic BC was retained in the tumor (see Figure 3). The mechanism of this observed uptake is not clear at this time, but similar pyrrole derivatives, such as chlorins and bacteriochlorins, are currently used as photosensitizers in photodynamic therapy (PDT) of tumors. The tumor uptake of this class of compounds has been attributed to low-density lipoprotein receptor-mediated binding.25,26 The results clearly demonstrate that BC can be used to image, and possibly treat by PDT, breast tumors. Decoupling the imaging and treatment components is feasible because the laser power used for imaging is low for inducing PDT effect. 27 In contrast, Cyp-GRD, which binds to β3 integrin receptor-positive tumors, 13 was not retained in the MB-MDA-361 tumor. Subsequent immunohistochemical analysis validated low expression of the β3 integrin needed for the binding of Cyp-GRD to tumors. For this reason, Cyp-GRD served as a nonspecific contrast agent in this study.
An important aspect of this study is to demonstrate the feasibility of reconstructing the fluorescence intensity maps of each fluorophore after administration of the cocktail in mice. In contrast to traditional multiplexing with multiple probes that absorb and emit light at different wavelengths, the multiple-probe fluorescence lifetime imaging described herein could be used to differentiate two or more fluorophores at the same excitation and emission wavelengths. This approach minimizes variability in data arising from differences in tissue optical properties at different wavelengths. Although the detection of multiple fluorophores by their fluorescence lifetimes has been conducted in tissue-simulating phantoms,28,29 lifetime measurements in living subjects have been limited to endogenous fluorophores 30 or single contrast agents.29,31–33 Recently, we reported the whole-body fluorescence lifetime imaging of an NIR single-fluorophore system in mice. 17
Imaging the fluorescence lifetime distribution of the two molecular probes individually in different mice has allowed us to study their characteristics and variations in the animal model prior to administering the cocktail. The time-dependent mean fluorescence lifetimes of BC and Cyp-GRD are shown in Figure 6, A and B, which indicates that the lifetime of BC remained fairly constant but that of Cyp-GRD changed slightly over a 24-hour period. This observation could be attributed to structural differences between the two fluorophore systems. Although the lifetime of BC can be affected by axial ligation and hydrogen bonding, it is a fairly rigid molecule with little conformational motions that could alter fluorescence lifetimes. In contrast, the carbocyanine dye in Cyp-GRD is more flexible, with the possibility of adopting different conformations on dynamic interaction with different proteins or binding pockets of the same protein. Over time, it attains dynamic equilibrium in the most stable binding site of surrounding protein, with resultant stability in the calculated average lifetime. Binding of carbocyanine dyes to proteins is known to alter their fluorescence lifetimes, and it is also possible that the observed changes are related to the stabilities of these dye-protein interactions over time. Future studies will focus on deciphering the mechanism of in vivo lifetime changes of cyanine dyes.
As shown in Figure 6B, some of the fluorescence lifetimes of Cyp-GRD are close to the IRF and were obtained after eliminating background fluorescence. A problem that can be seen with the measurement of short-lifetime fluorophores using our instrument is the interference of scattered excitation light. The time-of-flight of these photons ranges from 0.2 to 0.5 ns, compounding their separation from molecular probes with shorter lifetimes. Because the IRF is predictable and imaging in the NIR region minimizes background lifetimes from endogenous fluorophores, the time-domain diffuse optical imaging (DOI) system used in this study is optimal for molecular probes with lifetimes > 0.5 ns.
Fluorescence lifetime maps shown in Figures 3 to 5 (B) represent the average fluorescence for each point. The lifetime-gated fluorescence intensity distribution in Figure 5 (D and E) was determined by gating the fluorescence detected as less than 1.5 ns for Cyp-GRD or greater than 1.5 ns for BC. After separating the detected fluorescence by lifetime, it is evident that the Cyp-GRD preferentially distributed to the estrogen pellet, liver, and kidneys relative to BC, which was dominant in other areas, including the tumor region. This method is analogous to the reverse of image multiplexing in that individual channels were separated instead of overlaid. At the earlier time points, the fluorescence lifetime of the Cyp-GRD was predominantly observed because of its optimized detection at 830 nm, despite the concentration adjustment between the two fluorophore systems. As the more hydrophilic Cyp-CRD cleared from blood, the mean lifetime changed until the average lifetime between the two fluorophores was obtained (Figure 6C). These results clearly show that the more hydrophilic Cyp-GRD localized in the kidneys and the estrogen pellet, whereas the more hydrophobic BC was retained in the tumor tissue. Additional information can be obtained if the fluorescence lifetimes of individual fluorophore systems are altered in response to their local environment. Future investigations will implement targeted molecular probes with distinct lifetimes for selective imaging of multiple targets simultaneously using fluorescence lifetime gating.
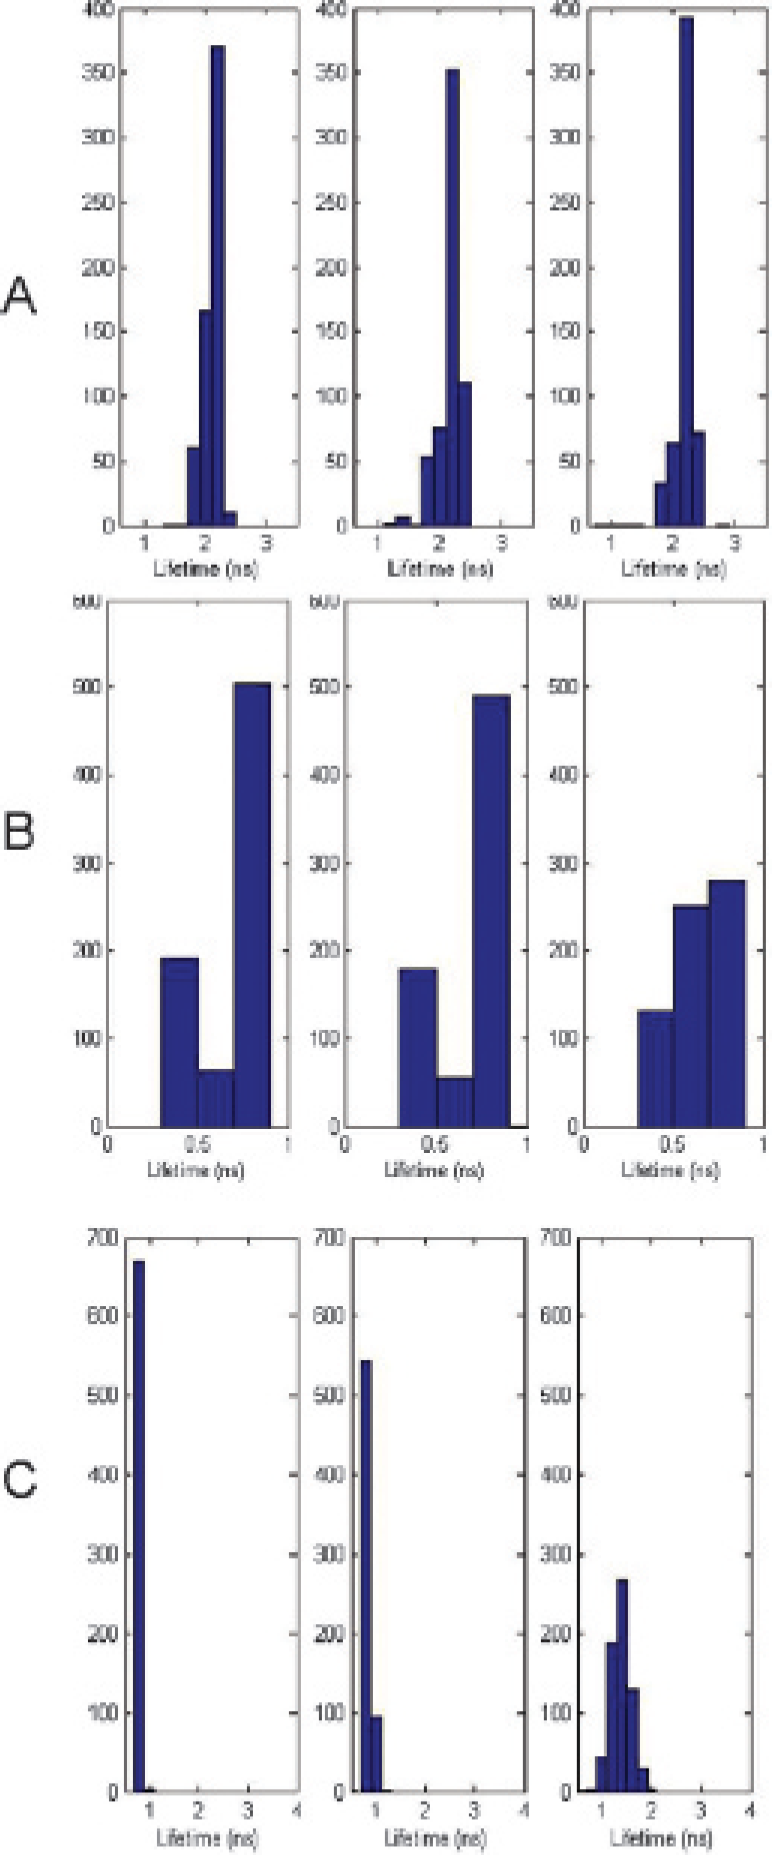
A, Histograms of fluorescence lifetime distributions at 1, 6, and 24 hours after injection of bacteriochlorophyll (BC) representing the estimated lifetime of all temporal point-spread functions (TPSFs) in the scan, excluding those with a low signal count and where the estimation cannot be determined accurately. B, Histograms representing the estimated lifetime of all TPSFs in the scan at 1, 6, and 24 hours after injection of cypate-glysine-arginine-aspartic acid-serine-proline-lysine-OH (Cyp-GRD). The low lifetimes (< 0.5 ns) originate from points in the image with low fluorescence and are mainly due to the instrument response function. Observed values indicate a small change in measured lifetimes over the course of the study. The mean lifetime was about 0.8 ns for Cyp-GRD in vivo. C, Histograms of fluorescence lifetime data at 2, 6, and 24 hours after injection of a BC-Cyp-GRD fluorophore cocktail. There is a noticeable shift in average measured lifetime over the course of the study. The results show that Cyp-GRD is cleared from the body more quickly than BC, as determined by fluorescence lifetime measurement.
In conclusion, we have shown that injection of a cocktail of two NIR fluorophores, BC and Cyp-GRD, produced signal indistinguishable by fluorescence intensity measurements using a single-source detector system but were separable by fluorescence lifetime mapping in mice using a time-DOI system. In addition, pharmacokinetic mapping of the relative distribution of these molecular probes can be obtained in the same animal by using fluorescence lifetime measurements to stratify the data. A common excitation wavelength and detector system was used, thereby minimizing the differences observed by traditional use of fluorophores with different excitation and emission sources. Some potential uses of imaging multiple lifetimes include the feasibility of noninvasive and longitudinal imaging, the biodistribution of more than one NIR contrast agent in the same animal, thereby limiting the number of animals used, staging tumors that differentially express different targets at various growth phases, assessing the functional status of metastatic tumors at different loci, and identifying or validating important molecular targets in vivo. To the best of our knowledge, this study represents the first demonstration of mapping the fluorescence lifetime of two NIR fluorophores simultaneously in living animals and illustrating its use to delineate the contribution of each fluorophore to the fluorescence intensity image.
Footnotes
Acknowledgments
We thank Ms. Kexian Liang for synthesis of Cyp-GRD and Dr. Mikhail Berezin for assistance with spectral characterization of samples.