
Abstract
Superparamagnetic iron oxide (SPIO) nanoparticles, either modified or in combination with other macromolecules, are being used for magnetic labeling of stem cells and other cells to monitor cell trafficking by magnetic resonance imaging (MRI) in experimental models. The correlation of histology to MRI depends on the ability to detect SPIO-labeled cells using Prussian blue (PB) stain and fluorescent tags to cell surface markers. Exposure of PB-positive sections to ultraviolet light at a wavelength of 365 nm commonly used fluorescence microscopy can result in color transformation of PB-positive material from blue to brown. Although the PB color transformation is primarily an artifact that may occur during fluorescence microscopy, the transformation can be manipulated using imaging process software for the detection of low levels of iron labeled cells in tissues samples
MAGNETIC LABELING OF CELLS provides the ability to monitor their temporal spatial migration in vivo by magnetic resonance imaging (MRI). Various methods have been used to magnetically label cells using coated superparamagnetic iron oxide (SPIO) nanoparticles. Prussian blue (PB) staining for the detection of iron in cells and tissues is commonly used to identify magnetically labeled cells with iron oxide nanoparticles on histologic examination of tissues. The crystalline structure of PB is based on a near-cubic matrix in which ferric ions and ferrous ions are bridged by cyanide ligands with Fe3+ always being attached to the nitrogen and Fe2+ always attached to carbon. Ferrous iron (Fe2+) in the unit cell of PB is in a metastable state and appears to be blue because of energy transfer transitions between the Fe2+ and Fe3+ in the crystal lattice. 1 PB staining of histologic sections usually consists of potassium ferrocyanide and ferric salts mixed in solution with various percentages of hydrochloric acid that is used to ionize insoluble iron within the tissues. 2 Owing to the acidity of PB stain, immunohistochemical staining of tissues to identify cell surface markers or antigen is commonly performed first followed by PB staining for iron to minimize possible overlap or may lead to degradation of initial histologic findings.3,4 The purpose of this article is to present the properties of PB and describe the physiochemical mechanisms behind the color transformation of PB stained magnetically labeled cells following exposure to ultraviolet light that can result in a possible misinterpretation of the histological sections.
Methods
Cell Labeling
HeLa cells (American Type Culture Collection, Manassas, VA) and human mesenchymal stem cells (MSCs) (Bio-Whittaker, Walkersville, MD) were grown in the appropriate cell culture medium as previously described.5–7 To label the cells, ferumoxide nanoparticles (Feridex IV, Berlex, Wayne, NJ) and poly-L-lysine (molecular weight = 388 kDa; Sigma, St. Louis, MO) were combined in standard growth medium on a rotating mixer for 1 hour at concentrations of ferumoxides of 50 μg/mL and poly-L-lysine (PLL) of 1.5 μg/mL of medium as previously described.3,4 The FE-PLL complex was added in a 50:50 volume:volume ratio to cells in culture and incubated for 2 to 12 hours for cells grown in six-well plates or in flasks. Following labeling, cells were washed three times with phosphate-buffered saline (PBS) and collected.5,6
PBlue Staining and Color Transformation
PB staining was performed on deparaffinized tissue sections or 4% gluteraldehyde-fixed cell cytospins. The tissue sections or cell cytospins were incubated for 30 minutes with 2% potassium ferrocyanide (Perl's reagent, Sigma) in 3.7% hydrochloric acid at 60°C, washed again, and counterstained with nuclear fast red. For color transformation experiments, PB-stained cytospins or tissue sections were subjected to ultraviolet (UV) irradiation by a Zeiss fluorescent microscope (Axioplan II, Thornwood, New York) for different periods of time. Both color and fluorescent images of PB-stained cytospins or tissue sections at 6 to 8 microns thick were obtained before light irradiation and serially after every 15 seconds of irradiation until 2 minutes. Three different wavelengths of light were used to excite the sample: 365, 490, and 550 to 570 nm corresponding to the peak excitation profile for the DAPI, fluorescein isothiocyanate (FITC), and rhodamine filters in the microscope. Irrespective of irradiation wavelength, images were taken using three filters and using normal halogen light. Filter profiles for the fluorescent microscope were DAPI emission at ⩾ 420 nm, FITC emission at 530 ± 50 nm, and rhodamine emission at 620 ± 60 nm. Region of interest (ROI) analysis of PB-positive cells was obtained of the serial UV exposures of Fe-PLL-labeled MSCs from the eight-bit fluorescent photomicrographs using Adobe Photoshop 7.0 image processing software. Using preset color filters and histogram analysis in the imaging processing software, the mean histogram signal intensities for the red, green, and blue channels and for each time point were obtained. Difference images were created from the digital photomicrographs before and after irradiation.
UV/Visible Light and Fluorescence Spectra
Adherent tumor cells (HeLa) were labeled with Feridex-PLL, washed twice, trypsinized, and replated in plastic microcuvettes in sufficient numbers to cover the side-walls of the cuvettes. One cuvette was plated with FE-PLL-labeled HeLa cells stained with PB, whereas a second cuvette was plated with unstained FE-PLL-labeled HeLa cells. The cuvettes were used without further addition of media or solvent. The UV/visible light (VIS) spectra were collected using a Shimadzu UV/VIS spectrometer (Shimadzu Scientific Instruments, Columbia, MD). The spectra were collected from 200 to 800 nm in 1 nm intervals. One cycle was run for each sample with a scan speed of 240 nm/min through a 1 nm slit. The data were collected as text files and analyzed using standard spreadsheet software. To determine the excitation and emission profile of the unstained and PB-stained cells, cells were labeled and plated as described above. Both the excitation and emission profiles were measured using a PTI spectrofluorometer (Photon Technology International, Lawrenceville, NJ).
Experimental Studies
Tissue samples for this study were obtained from the approved Animal Care and Use Committee protocol at the Clinical Center at the National Institutes of Health. We previously reported on the correlation of MRI to histopathology in nude rats that had received FE-PLL-labeled human MSCs infused into the tail veil and followed serially over time. 8 The tissue section from the liver of the animal containing labeled cells was used in the current experiment. 8
Results
Figure 1 is an example of FE-PLL-labeled PB-positive MSCs exposed to light at 546, 490, and 365 nm sequentially for 120 seconds at each frequency band and observed under rhodamine, FITC, and DAPI filters and white light. Following 15 seconds of exposure to 365 nm wavelength light, color transformation from blue to brown was observed in iron oxide nanoparticles in the PB-positive MSCs. Qualitatively, a minimal color change was also observed following exposure to light at a wavelength around 490 nm, whereas no visual change was observed after exposure to light at 546 nm. No autofluorescence was observed from the unstained MSCs following exposure to 365, 490, and 546 nm wavelength light for 120 seconds at each wavelength (see Figure 1B). PB-positive MSCs also exhibited fluorescence over time when observed under the DAPI and FITC filters compared with the rhodamine filter. Figure 2 shows graphs of ROI obtained from serial fluorescent micrographs obtained every 15 seconds of PB-positive MSCs exposed to 365 nm light and observed using DAPI (see Figure 2A) and FITC (see Figure 2B) filters. A steady increase in signal intensity was observed with time using the DAPI filter (emission sensitivity of ⩾ 420 nm) compared with FITC filter (emission sensitivity 530 ± 50 nm) in which signal intensity peaked at 15 seconds and then decreased. Detection of the increase in signal intensity with both DAPI and FITC channels on the fluorescent microscopy is due to overlapping sensitivity profiles of the filters. Following irradiation at 365 nm, the signal intensity from labeled cells was unchanged when images were acquired using the rhodamine filter.

A, Prussian blue (PB)-positive human mesenchymal stem cell (MSC) exposure time (t) for 120 seconds performed sequentially to light at three frequencies and fluorescent micrographs obtained using rhodamine, fluorescein isothiocyanate (FITC), and DAPI filters and with optical imaging. Exposure of cell to light at 365 nm clearly demonstrates blue to brown color transformation. B, Unlabeled human MSCs (X40 bright field original magnification) exposed to 560, 490, and 365 nm wavelength light for 120 seconds demonstrate no autofluorescence.

Graphs of regions of interest of the mean signal intensity obtained from the DAPI- (A) and fluorescein isothiocyanate– (B) filtered fluorescent micrographs of the red, green, and blue channels using arbitrary units (au) versus time acquired following irradiation of Prussian blue–positive mesenchymal stem cells at 365 nm (A) and 490 nm (B) at 15-second intervals.
A graph of UV/VIS spectra from unstained and PB-positive FE-PLL-labeled HeLa cells is shown in Figure 3. PB-positive HeLa cells showed an absorbance between 365 and 400 nm when compared with unstained cells. The fluorescence emission and excitation spectra are shown in Figure 4, A and B. Emission peaks were observed for unstained and PB-positive FE-PLL-labeled HeLa cells between 320 and 330 nm (see Figure 4A). There was an additional fluorescence peak at 468 nm (see Figure 4A) for PB-positive labeled HeLa cells consistent with PB-positive cells exhibiting fluorescence detected using DAPI and FITC filter observation over time. These results show the increase in iron oxide absorption by the PB crystal lattice and the blue shift in fluorescence (see Figure 4). The increase in blue fluorescence with time indicates continued emission of light at wavelengths around 470 nm from the PB crystal lattice in the labeled cells and is therefore within the sensitivity profile of the DAPI and FITC filter used in this study.

Ultraviolet/visible light spectra of unstained FE-PLL-labeled HeLa cells and Prussian blue (PB)-positive FE-PLL-labeled HeLa cells plated on cuvettes along with a blank cuvette. The PB-positive FE-PLL-labeled HeLa cells exhibit a broad absorbance peak between 350 and 400 nm.
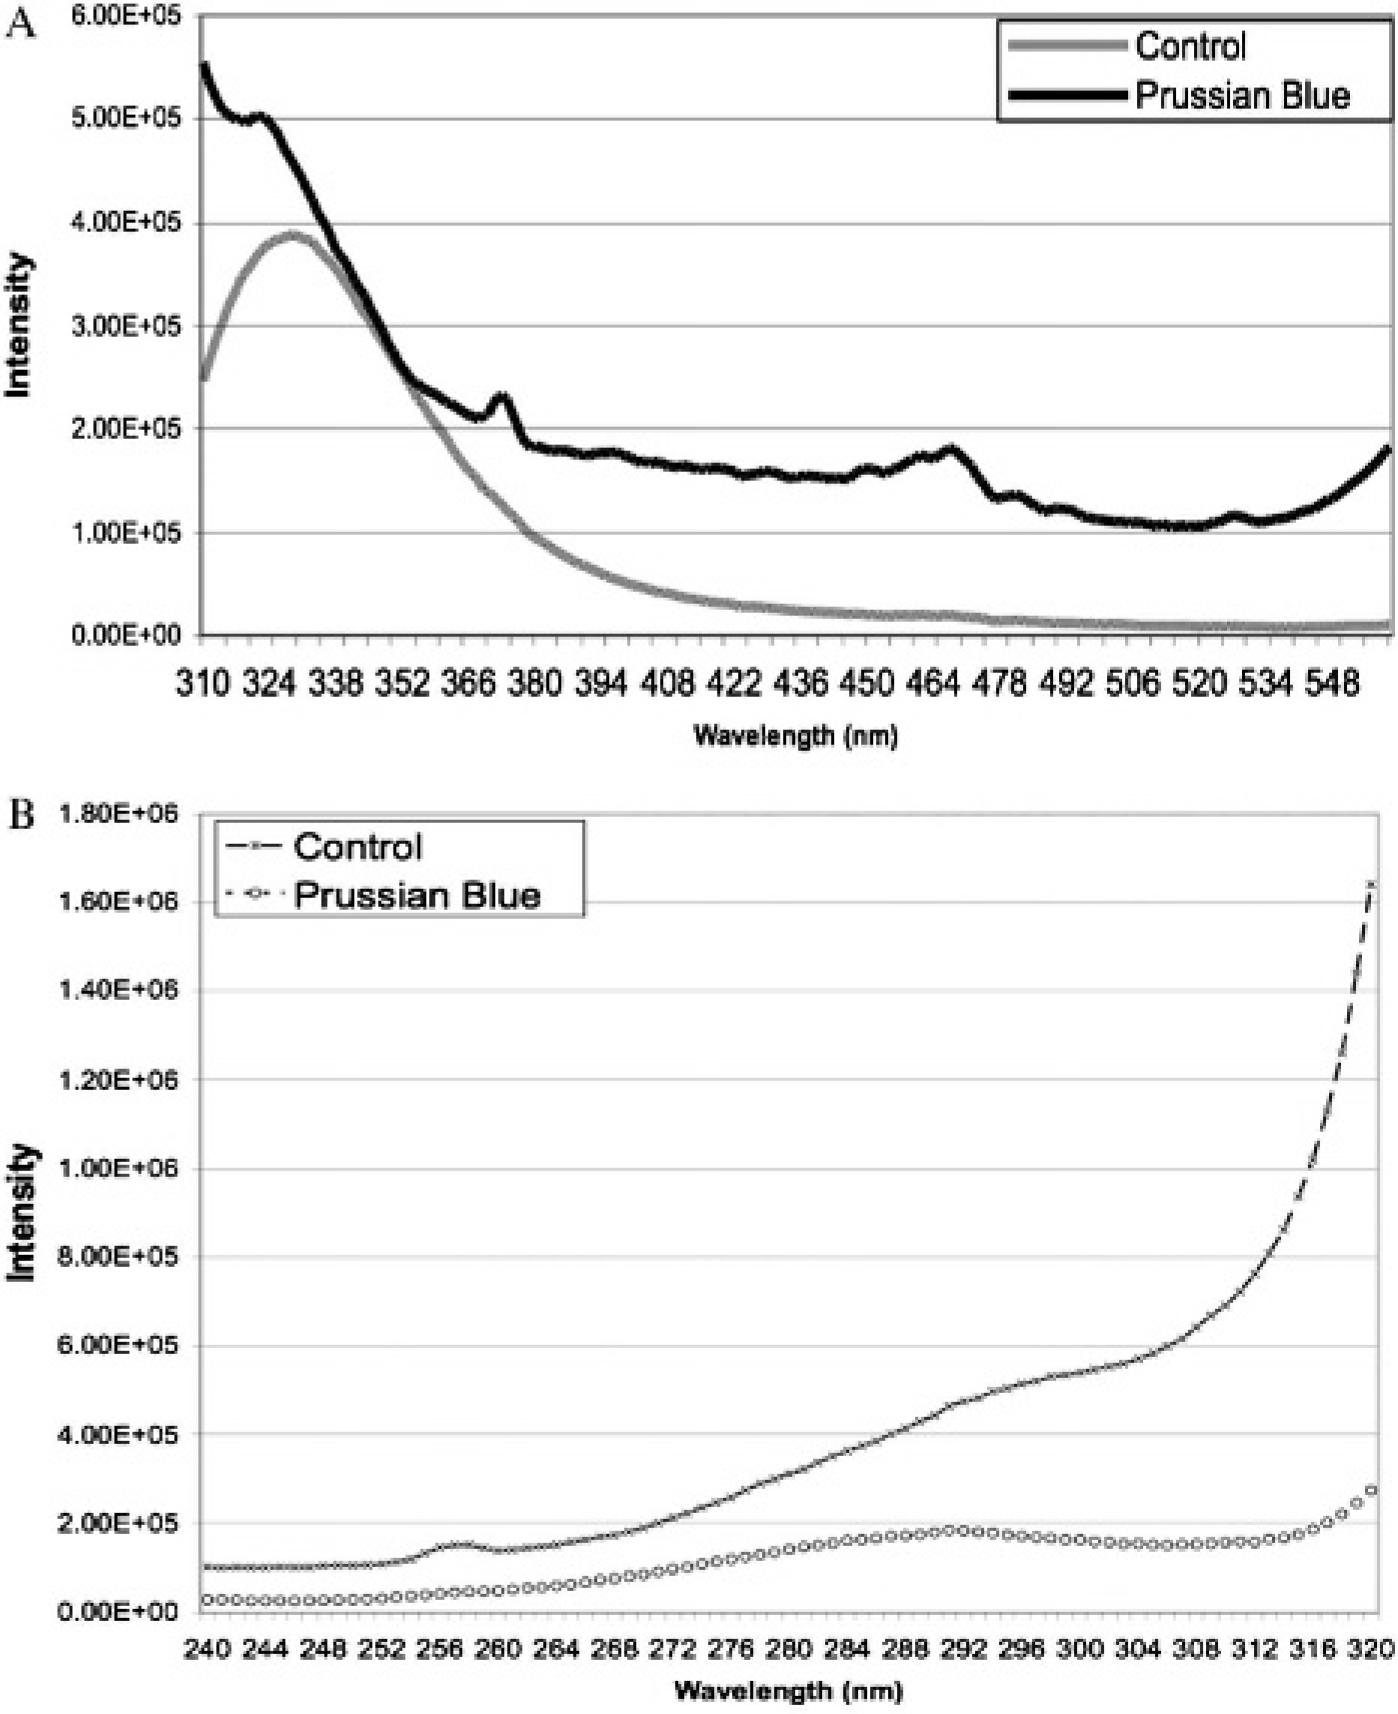
The emission (A) and excitation (B) spectra of unstained FE-PLL-labeled HeLa cells and Prussian blue–positive FE-PLL-labeled HeLa cells plated on cuvettes. Both the unstained and stained cells emit light between 320 and 330 nm; however, the stained cells also emit light at 468 nm.
Figure 5 is a tissue section from nude rat liver in which animals received 106 FE-PLL-labeled human MSCs by intravenous injection. Following 2 minutes of exposure to light at 365 nm, a color change in the PB-positive MSCs was observed, whereas normal hepatocytes did not exhibit a change in the difference image.

Prussian blue (PB)-stained section from nude rat liver counterstained with nuclear fast red from an animal that received FE-PLL-labeled cells. A is a photomicrograph before exposure to 365 nm wavelength light; B is a photomicrograph following 5 minutes of exposure to light at a wavelength of 365 nm; and C is the subtracted difference image of A and B. PB-stained mesenchymal stem cell color transform (blue to brown) following exposure to 365 nm light can be seen on difference image C.
Discussion
Color transformation of PB occurs because of energy absorption at 365 nm by the PB crystals, resulting in a transition of a paired Fe2+ 5d orbital electron into a higher energy state, releasing a photon, and a color change occurs from blue to brown corresponding to the ferrous iron electronic configuration moving to a stable energy state. 1 Although the color transformation experiment is commonly performed in chemistry classes, to our knowledge, this observation in tissue samples stained with PB and containing SPIO-labeled cells has not been reported. PB staining can be used to detect the presence of a sufficient amount of Fe3+ in tissues, as can be found in ferritin; therefore, the color transformation is not specific to the detection of iron in SPIO in cells. 2 The ferric ferricyanide reduction test has been used for histochemical examination of tissues and as a spot test performed under 15 minutes to detect for the presence of various amines, organic alcohols, acids, and sulfides in tissues resulting in various color changes in reduced iron in the PB crystal lattice. 9 This color transformation may occur within 1 minute of 365 nm wavelength light exposure of PB-positive cells and possibly of inhibiting the detection of magnetically labeled cells migrating into tissue (see Figure 5). Given that the ferric ferrocyanide will absorb light from 365 to 490 nm, exposure of PB-positive histopathology may exhibit background autofluorescence and confound the interpretation of fluorescent microscopy studies of the tissue.
Schroeter and colleagues recently reported on a method to improve the sensitivity of PB staining to detect the presence of ultrasmall superparamagnetic iron oxide (USPIO)-labeled cells as they migrated into photochemically induced strokes in rat brains. 10 These authors suggested that standard PB staining might not be sensitive enough to detect the presence of USPIO nanoparticles in cells in the brain even after diaminobenzidine (DAB) enhancement and demonstrated improved sensitivity with the addition of gold and silver impregnation of the histologic section. 11 Although some studies have used PB staining to detect USPIO-labeled cells in tissue sections,5,12 the additional steps of following DAB should improve detection of cells labeled with low levels of iron oxide. Ferumoxide-labeled cells can also be detected by using a rhodamine or FITC tagged to a commercially available antidextran antibody that binds to the dextran coat of the SPIO nanoparticles. 13 Double fluorescence would then be used to identify cells based on surface markers and the presence of the ferumoxides within the cells. However, the sensitivity of this fluorescent antidextran antibody to low levels of ferumoxides in cells over time needs to be determined. Attaching multiple fluorochromes to the dextran coat of USPIO nanoparticles allowed for the detection of a fluorescence tag in macrophages that uptake the iron oxide nanoparticle in areas of inflammation that corresponded to signal intensity changes observed on in vivo MRI. 14
Studies have shown that decalcification of bone using acid may alter the staining characteristics of tissue, thus making it difficult to detect iron on PB stain. 15 Decalcification occurs secondary to an acid bath of bone performed before histologic sectioning of the soft tissue. Therefore, for example, when correlating labeled cell migration on MRI of spinal cord in disease models to histopathology, it is recommended to remove the cord from the column prior to decalcification to minimize the loss of the iron in labeled cells. It is important to recognize that it is also possible to bleach the nuclear fast red–counterstained PB-positive tissue sections by exposure to light; thus, if PB is to be intentionally exposed to 365 nm light to induce a color transformation to detect low levels of iron, it would be desirable to perform the color transformation without counterstaining the sample. Finally, it should be noted that the color transformation approach is a destructive process such that once the blue to brown transformation occurs, it cannot easily be reversed.
The observations in this study were based on qualitative assessment of PB-positive cells and tissue following exposure to light through an FITC filter for relatively short exposure times. Attempts to correlate the fluorescence and color transformation to the amount of iron in cells were not reliable, possibly owing to limitations in the study design. However, color transformation occurred following exposure to 365 nm light for various PB-positive cells (ie, T cells, MSCs, HeLa cells) that have been reported to uptake various amounts of SPIO nanoparticles 3 following incubation with ferumoxides complexed to transfection agents (data not shown).
If it is possible, we recommended that prior to PB staining, fluorescence microscopy should be performed and then sections stained with PB to determine the presence of magnetically labeled cells to correlate with MRI. However, if there is a need to verify relatively small amounts of iron-labeled cells in tissue sections, the color transformation of the section with difference imaging may help confirm the presence of these cells in the pathologic tissue section.
Footnotes
Acknowledgments
We wish to thank Karyn Ledbetter of Henry Ford Health Systems' Neurology NMR Laboratory for her assistance.