
Abstract
Multimodality scanners that allow the acquisition of both functional and structural image sets on a single system have recently become available for animal research use. Although the resultant registered functional/structural image sets can greatly enhance the interpretability of the functional data, the cost of multimodality systems can be prohibitive, and they are often limited to two modalities, which generally do not include magnetic resonance imaging.
Using a thin plastic wrap to immobilize and fix a mouse or other small animal atop a removable bed, we are able to calculate registrations between all combinations of four different small animal imaging scanners (positron emission tomography, single-photon emission computed tomography, magnetic resonance, and computed tomography [CT]) at our disposal, effectively equivalent to a quadruple-modality scanner.
A comparison of serially acquired CT images, with intervening acquisitions on other scanners, demonstrates the ability of the proposed procedures to maintain the rigidity of an anesthetized mouse during transport between scanners. Movement of the bony structures of the mouse was estimated to be 0.62 mm. Soft tissue movement was predominantly the result of the filling (or emptying) of the urinary bladder and thus largely constrained to this region.
Phantom studies estimate the registration errors for all registration types to be less than 0.5 mm. Functional images using tracers targeted to known structures verify the accuracy of the functional to structural registrations.
The procedures are easy to perform and produce robust and accurate results that rival those of dedicated multimodality scanners, but with more flexible registration combinations and while avoiding the expense and redundancy of multimodality systems.
IMAGES ACQUIRED WITH positron emission tomography (PET), single-photon emission computed tomography (SPECT), and other functional modalities generally lack a detailed anatomic context important to their accurate interpretation. To compensate for this deficit, investigators often seek to coregister functional with anatomic (primarily magnetic resonance [MR] and computed tomography [CT]) image data sets of the same subject.
Early efforts at coregistration used fiducial marker systems1–3 that required prospective application and short interscan time intervals. These requirements, however, were incompatible with routine clinical use. Thus, with the increased availability of inexpensive computational power, investigators turned to retrospective methods that based the registration on the information content of the images themselves.4–7 Given a reasonable amount of redundant information in the image sets to be registered, these methods can achieve subpixel accuracies in cases in which a six-parameter, rigid-body transform is sufficient to overlay the two data sets accurately. These techniques, for example, are routinely used to register 18F-fluorodeoxy-glucose (FDG) PET and MR images of the brain.
However, for routine whole-body registration, the changes in patient body position between scanning sessions invalidate the rigid-body assumption, requiring that some type of nonrigid transform be applied. Nonrigid (ie, image warping) transforms require many more than six parameters for their characterization and sufficient mutual information between data sets for their constraint. With functional to structural image registrations, this mutual information is often lacking, and when it is present, the need to coregister the image sets in many cases is obviated.
Circumventing this problem, many manufacturers have developed combined functional/structural scanners (eg, PET-CT and SPECT-CT). With these scanners, since the patient does not move off the scanner bed between the acquisitions of the functional and anatomic scans, the patient's body remains in the same position for the two image sets. The resulting registered data sets have been shown to assist in the interpretation of the functional images,8–16 and this has led to the rapid acceptance and proliferation of combined-modality scanners.
The success of the combined-modality scanners within the clinical arena has, in turn, led to the offering of similar combined units for the imaging of small animals for research purposes. However, many of the limitations encountered in the clinical setting that have motivated the development of combined scanners do not apply in the research setting. In research studies, the investigator generally has foreknowledge of the need to coregister data sets, and with animals, steps impractical in humans can be undertaken to maintain body positioning between scanning sessions.
Here we propose such a system to maintain an animal's rigidity between scanning sessions, allowing combined-modality results without a combined-modality scanner. These proposed procedures were applied to four scanners representing a broad scope of differing modalities and manufacturers and resulting in registrations for all possible combinations. Although the details of the procedures that we describe are specific to these scanners, the overall methods and concepts are generic, applicable in principle to any scanner; maintain animal rigidity; and establish a reproducible frame of reference (origin and axes) relative to the bed.
Materials and Methods
Scanners
The Siemens/CTI microPET R4 (Siemens Medical Solutions, Malvern, PA) is designed for small animal use with a 7.8 cm axial by 10 cm transaxial field of view (FOV). It uses an 8 × 8 array block of 2.4 × 2.4 × 10 mm lutetium oxyorthosilicate (LSO) detectors coupled to position-sensitive photomultipliers via optical fiber bundles, achieving an average resolution of about 2 × 2 × 2 mm. It has a motorized bed, allowing movement vertically and parallel to the scanner's central axis with optically encoded digital position readouts, precise to 0.01 mm and with a repositioning accuracy of better than 0.1 mm in both dimensions.
The Siemens/CTI microCAT II (formerly from Imtek and now sold by Siemens Medical Solutions, Malvern, PA) is a small-animal CT scanner with an 8.5 cm axial by 5.0 cm transaxial FOV. It uses a 2,048 × 3,096 element charge-coupled device array coupled to a high-resolution phosphor screen via a fiberoptic taper and a Tungsten anode with a 6-micron focal spot. Its highest reconstructed resolution is about 15 microns in each dimension. Like the microPET, the microCAT has an optically encoded, motorized bed positioning mechanism with controlled positioning capabilities and repositioning accuracy similar to that of the microPET.
The Gamma Medica X-SPECT/CT (Gamma Medica, Inc., Northridge, CA) is a dual-modality small animal SPECT and CT system. The cameras use an array of 2 × 2 × 6 mm NaI(Tl) crystals coupled to a position-sensitive photomultiplier tube readout, resulting in a 130 × 130 mm FOV. Pinhole collimators are available with interchangeable apertures of 1, 2, or 3 mm. It has a motorized bed but lacks a positional readout.
The Bruker Biospec 47/40 (Bruker Biospin Inc., Karlsruhe, Germany) is a 4.7-Tesla 40 cm horizontal bore small animal imaging spectrometer equipped for multi-nuclear imaging studies and spectroscopy. Subjects are placed within its FOV manually using a semirigid rail system.
Description of Bed and Adapters
Each of the imaging modalities comes from the manufacturer with its own unique animal bed and bed positioning system. Given that we wished to move our bed—with the animal affixed—easily and reproducibly between imaging systems, a different bed to scanner adapter was needed for each modality (Figure 1). On the side of the adapter that attaches to the bed are three mating dowels; on the scanner side, each has a unique mechanism that clamps the adapter to the bed positioning hardware. In the case of the MR scanner, which is located in a space not designated to contain radioactive materials, the adapter includes a cylindrical chamber that can be sealed around the entire animal bed, thus isolating its contents from the surrounding environment.

The mouse bed shown in A is made of balsa wood (shown here in green) with a Delrin plastic header (white). The backside of this header is shown in B and contains alignment holes used to attach the bed to dowels on each of the modality adapters shown in C to E: Gamma Medica X-SPECT (C), Siemens/CTI microPET and microCAT (D), and Bruker Biospec MR (E). In the case of the magnetic resonance scanner, the adapter includes a cylindrical chamber that can be sealed around the entire animal bed, thus isolating its contents from the surrounding environment.
The animal bed used in these studies was designed for use with mice, shaped out of a 2.5 × 3.5 × 18 cm piece of balsa wood with beveled-edge cutouts over which the legs are comfortably laid (see Figure 1A). Into the top surface of the bed, a set of four 3 mm deep grooves form an 8 cm long by 2.5 cm wide H-like pattern but with two crossbars spaced 4 cm apart. Permanently placed within each of these is a capillary tube, 1.2 mm ID and 1.6 mm OD, filled with gadolinium-diethylenetriaminepentaacetic acid-doped water (visible to both MR and CT) and sealed at both ends. The grooves are filled with balsa wood filler (a mixture of wood glue and balsa wood filings), fixing the capillary tubes in place. A reservoir drilled through the bed and filled with absorbent material is located to collect any urine produced during or between imaging sessions.
One end of this bed is secured to a Delrin plastic header, on the far side of which are three drilled holes spaced to receive the mating dowels of the adapter. An alignment hole (drilled vertically through the header traversing the central large dowel) and corresponding locking pin are used to ensure a reproducible connection of the bed to the adapter (see Figure 1B).
The mouse is positioned atop the bed with a nose cone for the administration of oxygen and gaseous anesthesia. It is maintained rigidly in this position by means of a thin 0.01 mm polyethylene wrap (Figure 2). The wrap applies light pressure over the entire body of the animal, gently and efficiently restricting its movement. Blanketing the animal in this way with a vapor barrier also helps maintain its body temperature.
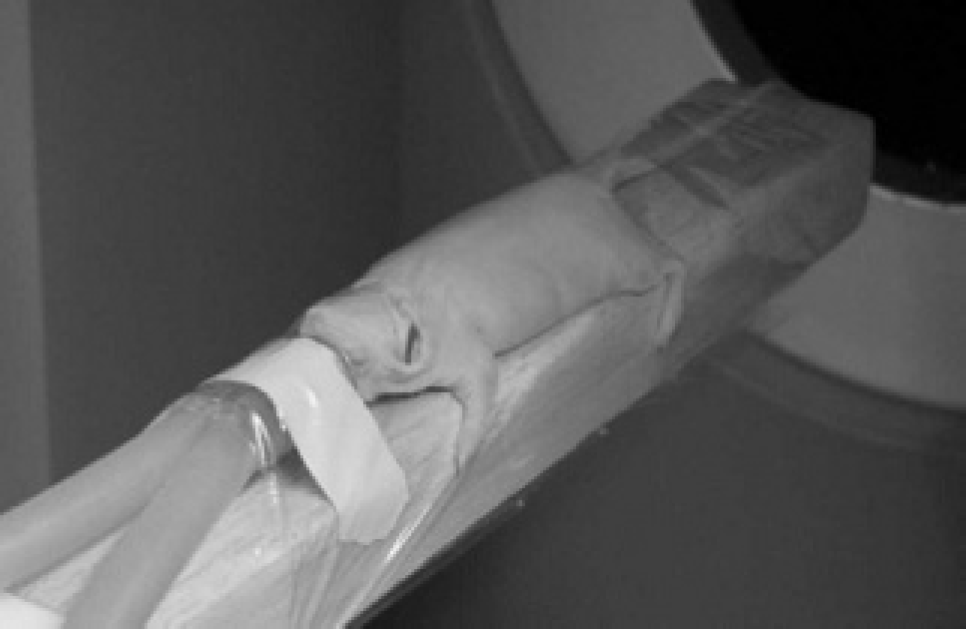
To prevent any change in the animal's position during transport between scanners, it is secured to the bed using 0.01 mm polyethylene plastic wrap.
Animals and Imaging Procedures
In the context of this study, 14 normal mice were imaged each up to four times on varying selections of the aforementioned modalities while wrapped in position on the bed. Twelve animals received at least one microCAT scan, seven received repeat microCAT scans, eight received a Bruker MR scan, five received a microPET scan, and three received both SPECT and CT scans on the Gamma Medica.
In all studies, anesthesia was induced with 2% isoflurane and the eyes of the mouse were dabbed with a sterile ocular lubricant (Paralube Vet Ointment, Pharmaderm, Melville, NY) to prevent drying. After injecting the appropriate tracers/contrast, the mouse was placed on the bed and secured with the plastic wrap. The mouse was maintained under anesthesia using 1% isoflurane continuously throughout and between all imaging studies, with only momentary disconnections to allow transport between imaging systems.
MicroPET Imaging Protocol
Mice were injected via the tail vein with either 500 μCi of 18F-fluoride, a tracer whose predominant uptake is into normal bone, or with 750 μCi of 18F-FDG, which tracks tissue glucose metabolism. In both types of study, starting approximately 1 hour after the injection, the mouse was imaged for 15 minutes using a 350 to 750 keV energy window and a 6 nsec timing window. Images were reconstructed into a 128 × 128 × 63 matrix covering a 5.54× 5.54 × 7.75 cm FOV (ie, 0.433 × 0.433 × 1.23 mm voxels) using a two-dimensional ordered subsets expectation maximization reconstruction following Fourier rebinning.
Gamma Medica SPECT and CT Imaging Protocols
Mice were injected intravenously with 900 μCi of 99mTc-dimercaptosuccinic acid (DMSA), which targets the renal cortex. Four hours after the injection, the mouse was imaged for approximately 1 hour using 128 angles of 30 seconds each, covering a full 360° with each head. Pinhole collimators with a 1 mm aperture and a 20% energy window were used. The projection images were reconstructed into a 56 × 56 × 56 matrix over a 4.24 cm diameter by 4.24 cm long FOV using an iterative reconstruction algorithm. The SPECT acquisition was followed immediately by a CT image acquisition involving 256 views over 360° and reconstructed with a cone-beam three-dimensional filtered back-projection (FBP) algorithm (COBRA software, Exxim Computing Corp. Pleasanton, CA) into 0.156 × 0.156 × 0.156 mm voxels arranged in a 512 × 512 × 512 array. The SPECT and CT images were registered to one another and resampled to a 256 × 256 × 256 element matrix of 0.312 × 0.312 × 0.312 mm voxels using a precalculated transform and software provided by Gamma Medica.
Bruker MR Imaging Protocol
Images were acquired using a 7 cm Bruker birdcage coil tuned to 200.1 MHz and the 10 mT/m gradient coil system. Three-dimensional images were obtained with a fast spin-echo sequence with a repetition interval of 1.2 seconds, effective echo time of 40 milliseconds, image matrix of 128 × 96 × 256, 8 repetitions per phase encoding step, and a total imaging time of 61 minutes. The final voxel dimensions for these images are 0.341 × 0.333 × 0.333 mm.
MicroCAT Imaging Protocol
Three hundred sixty transmission images were acquired at 1° increments, encircling the mouse. These images were reconstructed with a cone-beam three-dimensional FBP algorithm (COBRA software) into a 192 × 192 × 384 matrix over a 4.38 × 4.38 × 8.76 cm FOV (ie, 0.228 × 0.228 × 0.228 mm voxels).
Description of Overall Registration Procedures
Registrations between and among all of the imaging modalities described above can be attained through combinations of the direct transforms labeled A through G in Figure 3; all are six-parameter rigid-body transforms. Note that here and in the following descriptions, we use these labels (A-G) to refer to both the forward and inverse transforms.
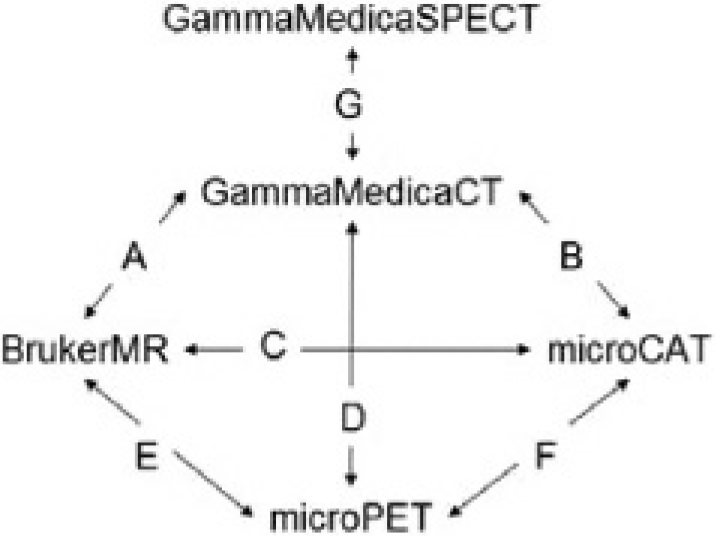
Diagram showing the directly calculated primary transforms effecting image registrations between image modality pairs. Through combinations of these, images from any modality can be registered to any other.
Among the four scanners for which we wish to generate registered images, two have calibrated bed positioning hardware, the microPET and the microCAT. The frame of reference (FOR) of each of these systems was chosen such that it would be fixed relative to the bed positioning mechanism itself. Thus, a single fixed geometric transformation (see F in Figure 3) can be used to register image sets between these two systems regardless of where the subject is positioned within the FOV and intramodality registrations are accomplished with the identity transform. Note that when the identity transform is applied, there is an implicit spatial shift determined by the image origins stored in the respective image headers.
The Gamma Medica X-SPECT system does not have calibrated bed positioning, but it is a dual-modality SPECT/CT system. Thus, there is a fixed transform (G), calculated by the manufacturer, that relates the SPECT and CT images, not unlike the transform we calculated relating the FOR of the microPET bed to that of the microCAT.
With the Bruker MR system, the animal bed is placed in the FOV manually, so precise repositioning is not easily accomplished. However, because MR images depict many of the same anatomic structures seen by the CT and because the animal's body is effectively rigid, then retrospective rigid-body mutual information-based volume registration methods produce highly accurate results. Once registered to a microCAT or Gamma Medica CT image set (transforms C and A, respectively), the MR images can then be registered to the PET or SPECT by applying the aforementioned fixed transforms (F or G).
The registration of a PET to a SPECT data set is also possible through a similar volume registration using a microCAT and Gamma Medica CT image set pair as proxies (transforms G, B, and F). In this case, because the two image sets are from the same modality (ie, they are both CT scans) it is advantageous to use a cross-correlation cost function.
As described thus far, to register an MR image set to a PET or SPECT scan, an intermediate CT scan is required (transforms C and F). In many cases, however, it is desirable to avoid the radiation dose and/or procedural overhead associated with the CT scan. The fiducial markers that we have implanted within the animal bed enable a means of registration that avoids the acquisition of a microCAT intermediary when performing an MR to PET registration (transform E). Again, this is possible only because the animal is maintained in a rigid position relative to the bed (and the markers therein).
In our current scheme, a set of four landmarks, manually identified at the crossings of the fiducial marker capillary tubes as seen on the MR image, is used to calculate a transform that places the bed in the same position in which it would appear within the microCAT FOR. This is accomplished using the homologous point registration method described by Arun and colleagues 17 and requires two sets of four coordinate locations as input. The latter set of four points, those within the microCAT FOR, are constant (because we defined the FOR relative to the bed) and therefore need to be determined only once.
A similar set of operations allows a Gamma Medica-derived CT image set and associated SPECT scan to be registered to a microPET scan without a second CT scan (transform D).
Registration Errors
For the procedures we describe, the errors in the registrations can be traced to three different sources: (1) movement of the animal, (2) inaccuracies in the spatial transforms, and (3) bed repositioning errors. It should be noted, however, that the distinction between a bed positioning error and a transform error is actually a semantic one. The error in any given transform can equivalently be attributed to the positioning of the bed at either end of the transform. In the context of the microPET and microCAT motorized beds, it is sensible to describe the errors in terms of bed repositioning, but in other contexts, the expression in terms of a transform error is more appropriate. We also find it useful to move between these two conceptualizations.
In all cases, we will express the registration errors as a euclidian distance. For the bed repositioning and transform error estimates, this distance is calculated using a three-dimensional voxel grid with 1 mm spacing and overall dimensions approximating those of the animal image sets (specifically 3.5 × 3.0 × 8.0 cm). Distances are measured from every voxel (ie, every grid cross-point) within a given grid, relative to the corresponding voxels of a grid operated on by a reference transform (or at reference bed position). Sampling the space within the FOV in this manner provides a much more intuitive and useful error estimate than reporting shift and rotation differences, particularly since the shifts and rotations are often correlated (eg, the error resultant from rotation about the z axis can be mitigated somewhat by compensatory translations along the × and y axes). We generally summarize these intervoxel distances using the mean and maximum over all voxels.
Animal Movement Estimate
Animal movement was assessed in a cohort of mice that underwent repeat microCAT scans while held in position by the polyethylene wrap. The time interval between microCAT scans ranged from 20 minutes to 2.5 hours, generally with intervening scans on other modalities. Seven scan pairs were acquired. Registration of the repeat scans was based on the positioning of the microCAT bed; therefore, the movement estimates include a component that is actually due to microCAT bed repositioning inaccuracies.
Two subcategories of animal movement were distinguished: movement of the bony structures of the mouse and soft tissue movement. Movement of the bony structures was assessed quantitatively using anatomic landmarks, whereas movement of soft tissues was assessed subjectively by visualizing the registered images.
In the quantitative assessment, the same four bony landmarks were manually located on all of the registered CT image sets. These landmarks, the odontoid process, the manubriosternal joint, the right thirteenth costovertebral joint, and the symphysis pubis, were chosen based on the ease with which they could be precisely localized and because they are distributed broadly across the animal. The identification of the location of the landmarks was conducted for each image set independent of (and in sequence remote from) its pair. The distance between each of the paired homologous landmarks was determined, and the means, standard deviations, and maximums for each landmark over all pairs were calculated.
The qualitative assessment involved simply viewing registered CT image set pairs and drawing contour lines that appeared at equivalent locations on both.
Transforms and Their Errors
The spatial transforms calculated in these studies are one of three types depending on how they are calculated: (1) fixed transforms (eg, transforms F and G in Figure 3), (2) volume registration-based transforms, or (3) fiducial marker-based transforms.
Of the two fixed transforms, the CT to SPECT transform was calculated by the manufacturer (Gamma Medica), and error estimates were not provided. The procedure they follow, however, is similar to the procedure we use for the microCT to microPET transform; therefore, it is assumed to have similar errors.
Our calculation of the fixed transform relating the FOR of the microCAT to that of the microPET was conducted with a phantom consisting of a 3 cm diameter by 6 cm long plastic cylinder onto the surface of which 12 1 mm diameter point sources, visible on both PET and CT, were distributed. The phantom was taped to the bed and imaged on each of the two scanners four times. Between each scan, the bed positioning mechanism was rehomed and the bed was removed from the adapter, replaced, and then reimaged at various bed positions, each time maintaining all point sources within the FOV.
The point source locations on each of the PET and CT image sets were identified manually using the computer's cursor. For each of the 16 possible PET to CT phantom image combinations, the best least squares homologous point rigid-body transform was determined.
18
The rotation and translation parameters for the 16 transforms were averaged together to produce the transform applied in the animal studies. The error in this averaged transform can be estimated from the error for a single transform in a manner akin to estimating a standard deviation of the mean from the standard deviation of a single sample, namely dividing the sample standard deviation by the square root of the sample size. The mean intervoxel distance between the averaged transform and each of the 16 contributing transforms is an estimate of the error in a single transform and is therefore analogous to a sample standard deviation. The error in a fixed transform calculated as the average of 16 individual transforms is, therefore, the mean intervoxel distance divided by
The error estimates for the transforms calculated using a retrospective volume registration procedure are described elsewhere. 19 These estimates were based on measurements involving registrations of CT and MR images of the human head, which we believe to be roughly analogous to our rigid whole-body registrations, the main difference being that for our data sets, there is a greater potential for movement, particularly of the soft tissues involved in digestive and excretory processes. To get a handle on the impact of these movements on the volume registration algorithm, the serial CT image set pairs used in the movement estimate studies were registered to one another using a normalized cross-correlation volume registration procedure (MIPAV [Medical Image Processing Analysis of Visualization] version 2.7 18 , National Institutes of Health, Bethesda, Maryland). The error in the resultant transforms was assessed using the intervoxel mean and maximum distances relative to corresponding transforms defined by the microCAT bed position.
The estimates of the error in the fiducial marker-based transforms were conducted using a phantom consisting of two 7 × 1.3 cm water-filled cylindrical glass tubes taped side by side, lengthwise, on the bed. This phantom was imaged in different positions, four times each on the microCAT, the Gamma Medica CT, and the Bruker MR. Within each of the 12 image sets, four landmark points were manually identified (using the computer's cursor) corresponding to the crossings of the fiducial marker capillary tubes.
Between each pair of scanners (three pairs altogether), transforms were calculated for each of the 16 possible paired combinations taken from the two groups of four image sets. All transforms in a set were in the same direction (eg, always microCAT to Bruker MR, but not the reverse). In addition, between the image sets within each scanner, transforms were calculated for each of the six possible paired combinations taken from the single group of four scans. Thus, altogether, there were six sets of transforms: three interscanner sets with 16 transforms each and three intrascanner sets with six transforms each.
All transforms were calculated two ways: once by applying the method described by Arun and colleagues 18 to the fiducial marker landmarks and a second time using a volume registration procedure. When both image sets of a transform-related pair were of the same modality (ie, MR to MR or CT to CT), a normalized cross-correlation cost function was used in the volume registration procedure (MIPAV version 2.7 17 ). When the image sets of a pair were acquired from different modalities, a normalized mutual information cost function was used (MIPAV version 2.7 17 ). The volume registration procedure-generated transforms were taken to be the gold standard against which the fiducial marker-based transforms were compared.
The transform errors were taken to be the mean of the intervoxel distances between the fiducial marker-based and gold standard results within each of the six sets. The maximum of the intervoxel distances is also reported.
In the procedures described here, we are measuring the error for the transform between two sets of ad hoc determined landmarks. In practice, however, one of the landmark sets is fixed and resultant from the landmark locations averaged over several phantom image sets. To the extent that the averaged locations are a more accurate specification of the true positions of the landmarks, we expect that the error measurements reported here will slightly overestimate the error for registrations to the fixed landmarks.
Bed Repositioning Error Estimates
Given that the microCAT and microPET use similar hardware, the repositioning accuracy was measured on the microCAT and the results are presumed to apply to the microPET as well. The estimate of the bed repositioning accuracy of the microCAT was conducted using the same dual-cylinder phantom that was used in the fiducial marker-based transform error estimates. This phantom was imaged four times on the microCAT. Between each scan, the bed positioning mechanism was rehomed, the bed was removed from the adapter, and the adapter was removed from the scanner. The adapter and bed were then replaced, and the phantom was reimaged at various bed positions, each time maintaining the entire phantom within the FOV.
Because the FOR was defined relative to the bed, the transform relating each pair of scans is expected to be the identity transform, this in spite of the phantom appearing in different locations within the FOV. As the gold standard measurement of the actual transform, we used a retrospective volume registration procedure that maximized the normalized cross-correlation of the voxel intensities between image pairs (MIPAV version 2.7 17 ). This procedure was applied to generate the six transforms relating all paired combinations of the four CT scans. Each of these transforms involves two “re“-positionings of the bed, one for each image set at either end of the transform.
The error in the transform was taken to be the mean of the intervoxel distances between the bed position-determined and volume registration-determined transforms. If we assume that the error in each bed positioning operation is independent and stationary (ie, not changing over time), then their errors would be expected to be equal and to add in quadrature. The repositioning error, therefore, is equal to the transform error, divided by
Results
The procedures to immobilize the animal and position the bed within the imaging devices were easy to perform and were well tolerated by all animals.
Animal Movement Quantitative Assessment
The results of the quantitative assessment of the movement of the mouse while wrapped are shown in Table 1. In one of the image sets, the odontoid process was inadvertently positioned outside the FOV; therefore, only six of the seven distance measures were possible. All seven distance measurements were made for each of the remaining landmarks.
Statistics Describing the Distances between Registered L Landmark

The weighted mean error over all landmarks is 0.62 mm, and the maximum overall is 1.13 mm.
Animal Movement Qualitative Assessment
Based on the viewing of the seven registered paired repeat microCAT scans, movement of the bony structures of the mouse in all cases was judged to be virtually undetectable, including at the landmark locations used in the quantitative analysis. We infer from this that the distances measured in the quantitative assessment may be more a function of the difficulty in identifying the landmark locations than of the motion of the animal per se. Soft tissue movement was seen in and around the urinary bladder but not in other regions of the body.
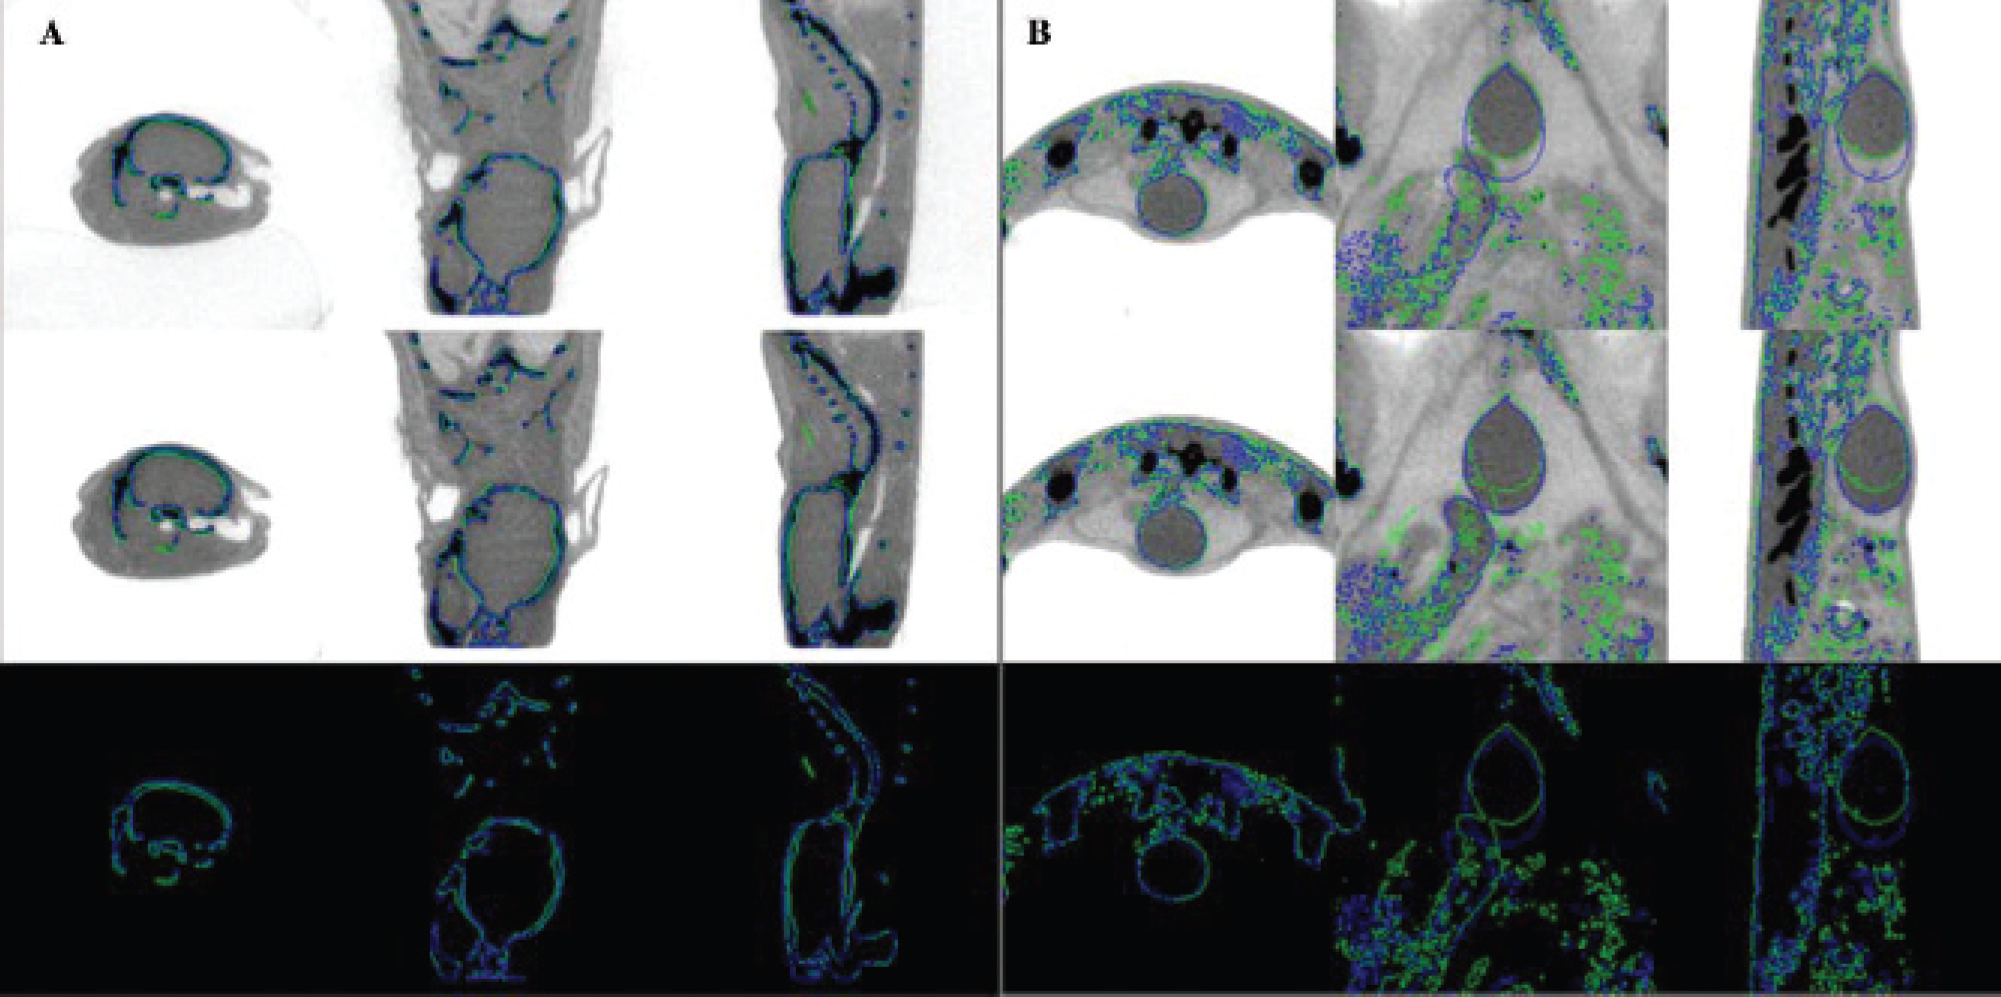
Figures 4 and 5 show the registrations for two of the animals that are typical of the remaining five. On each of these figures, isointensity lines have been superimposed. The green contours were derived from the first CT scan (top panel) and the blue contours from the second CT scan (middle panel). Both sets of contours are superimposed on both images and on a black background (bottom panel) so that the accuracy of the registration can be easily evaluated visually.

Two computed tomographic (CT) images acquired approximately 45 minutes apart. The top panel of images shows orthogonal views of the mouse abdomen from the first CT scan, whereas the middle panel shows registered images from the second CT scan. The green isointensity contours were determined at the bone threshold from the first CT data set, and the blue contours were calculated at the same threshold from the second CT. The bottom panel shows only the isointensity contours on a black background. The images in B on the right are a close-up of the regions within A delineated by the red boxes.
Registered pair of computed tomographic images similar to those in Figure 4 except this time acquired 2.5 hours apart. The registration accuracy in the region of the head (A) and in the region of the urinary bladder (B) is shown. Note that the bladder has filled in the interval between the two scanning sessions, causing some movement of nearby structures but without adversely affecting the overall registration.
Figure 4A shows orthogonal cross-sections through the mouse abdomen, whereas Figure 4B shows a close-up of the regions delineated by the red boxes in Figure 4A. Close examination of the registration results shows a nearly perfect superimposition of the data sets. These two scans were acquired 45 minutes apart, with an intervening microPET scan.
Figure 5A is a close-up showing the head region, and Figure 5B shows the bladder region of the same animal (but different from the animal of Figure 4). In this case, the two microCAT image sets were acquired 2.5 hours apart. In this interval, the animal was imaged on both the microPET and on the Bruker MR, requiring two trips between buildings with elevator rides at either end and thus ample opportunity for changes in the animal's position to occur. From these images, it is apparent that the bladder has increased in size in the interval between the two CT scans and adjacent organs have moved in concert, but outside this vicinity, no significant movement is discernible.
Transform and Bed Repositioning Errors
The error in the fixed transform (F) relating the microCAT and microPET FORs was estimated to be 0.11 mm, assuming a transform based on an average of 16 measurements. The maximum encountered intervoxel distance between the averaged transform and the individual transforms was 1.2 mm.
The fiducial marker-based transform errors are given in Table 2. As expected, the magnitude of the errors in the intrascanner registrations roughly correlates with the resolutions at which the images were reconstructed, with larger errors associated with the lower-resolution image sets. Relative to the intrascanner results, however, the interscanner results are slightly worse than expected if one were to assume that resolution alone was limiting the registration accuracy. Based on an examination of the registered data sets, we believe that this discrepancy is due to subtle spatial distortions that differ between modalities and between scanners of the same modality.
Fiducial Marker-Based Transform Errors

GMCT = Gamma Medica CT; MR = Bruker MR; SCT = Siemens CT.
The bed repositioning error for the microCAT was 0.071 mm, somewhat better than expected, and the maximum intervoxel distance encountered was 0.16 mm. For the microCAT to microCAT volume registration procedure applied to live mice, the error was estimated to be 0.22 mm, with a maximum encountered intervoxel distance of 0.56 mm, suggesting only a slight degradation owing to animal motion.
The error for registrations involving combinations of transforms can be estimated by adding the above-described component errors in quadrature. For example, the error for a PET to MR registration using fiducial markers can be calculated as the square root of the sum of the squares of four errors: (1) the error in the fiducial marker-determined MR to microCAT transform, (2 and 3) the microCAT and microPET bed repositioning errors, and (4) the microCAT to microPET fixed transform error. Substituting with the numerical estimates, sqrt(0.392 + 0.0712 + 0.0712 + 0.112), results in a composite error estimate for the MR to PET registration of 0.42 mm. Note that this error is well below the 2 mm resolution of the microPET.
Selected Typical Registration Results
For demonstration purposes, we have selected a variety of different registration results that show the accuracy and utility of the proposed registration procedures applied to live animals. The registrations selected were by no means chosen based on the accuracy of the registration; rather, they were chosen because they were in some regard interesting or demonstrative, or else they were chosen arbitrarily.
Figure 6 shows registration results for the two different methods of performing an MR to CT registration. Shown in the left panel is the reference CT acquired on the Gamma Medica. Red isointensity contours derived from this image at two different thresholds (skin and bone) are superimposed on all three panels. In the center panel is the MR image registered using a retrospective rigid-body mutual information volume registration procedure and on the right is the same MR image, this time registered to the CT scan using the fiducial landmarks.
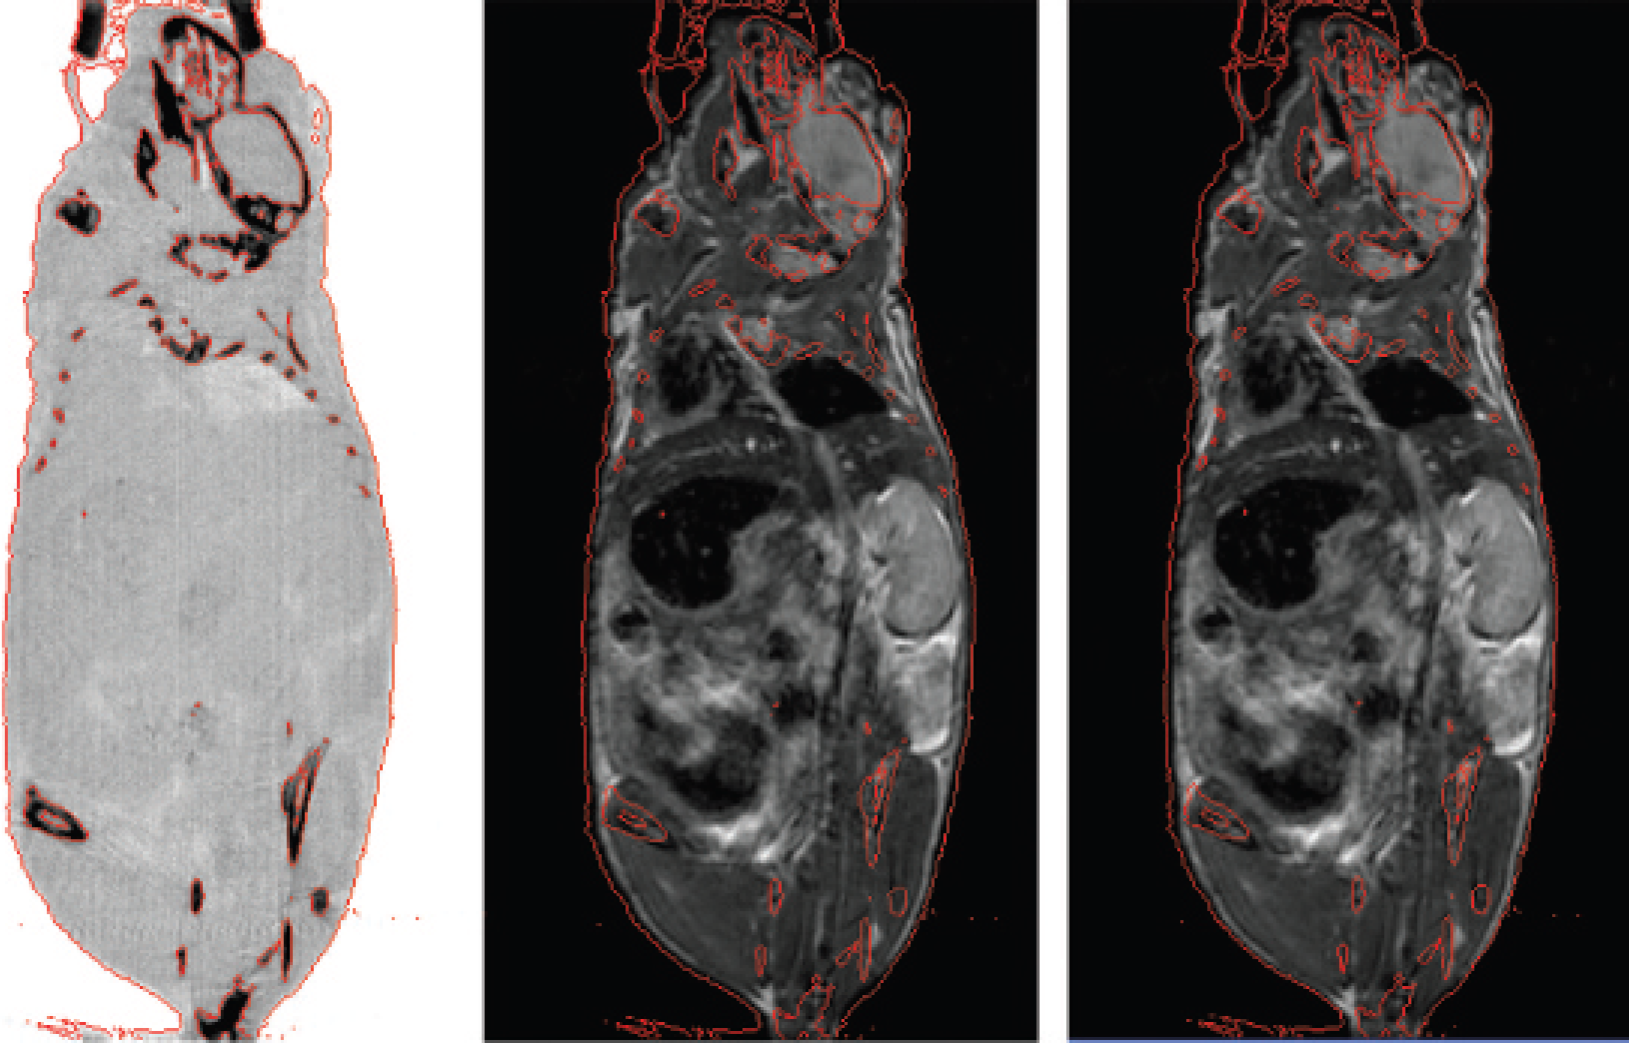
Comparison of the results of two registration methods applied to a computed tomographic (CT) and magnetic resonance (MR) image set pair. The left panel shows a coronal view of the CT image set. The red isointensity contours, appearing on all panels, were determined at the bone and skin thresholds from this data set. The middle panel shows the MR scan registered to the CT using a retrospective, rigid-body, mutual information volume registration procedure. The right panel shows the same MR image set but this time registered to the CT using a fiducial marker-determined transform.
The accuracy of the microCAT to microPET image registrations is dependent on the accuracy of both the bed repositioning hardware and the fixed transformation derived from the phantom measurements. As can be seen in Figure 7, which shows surface-rendered images of the mouse skeleton determined from the CT together with a volume-rendered 18F-fluoride PET bone scan (shown in green), these errors are well within the resolution of the microPET image. Note that successive images in this series are rendered from slightly different angles rotating about the mouse and ordered such that they can be viewed in a “cross-eyed” stereographic fashion.
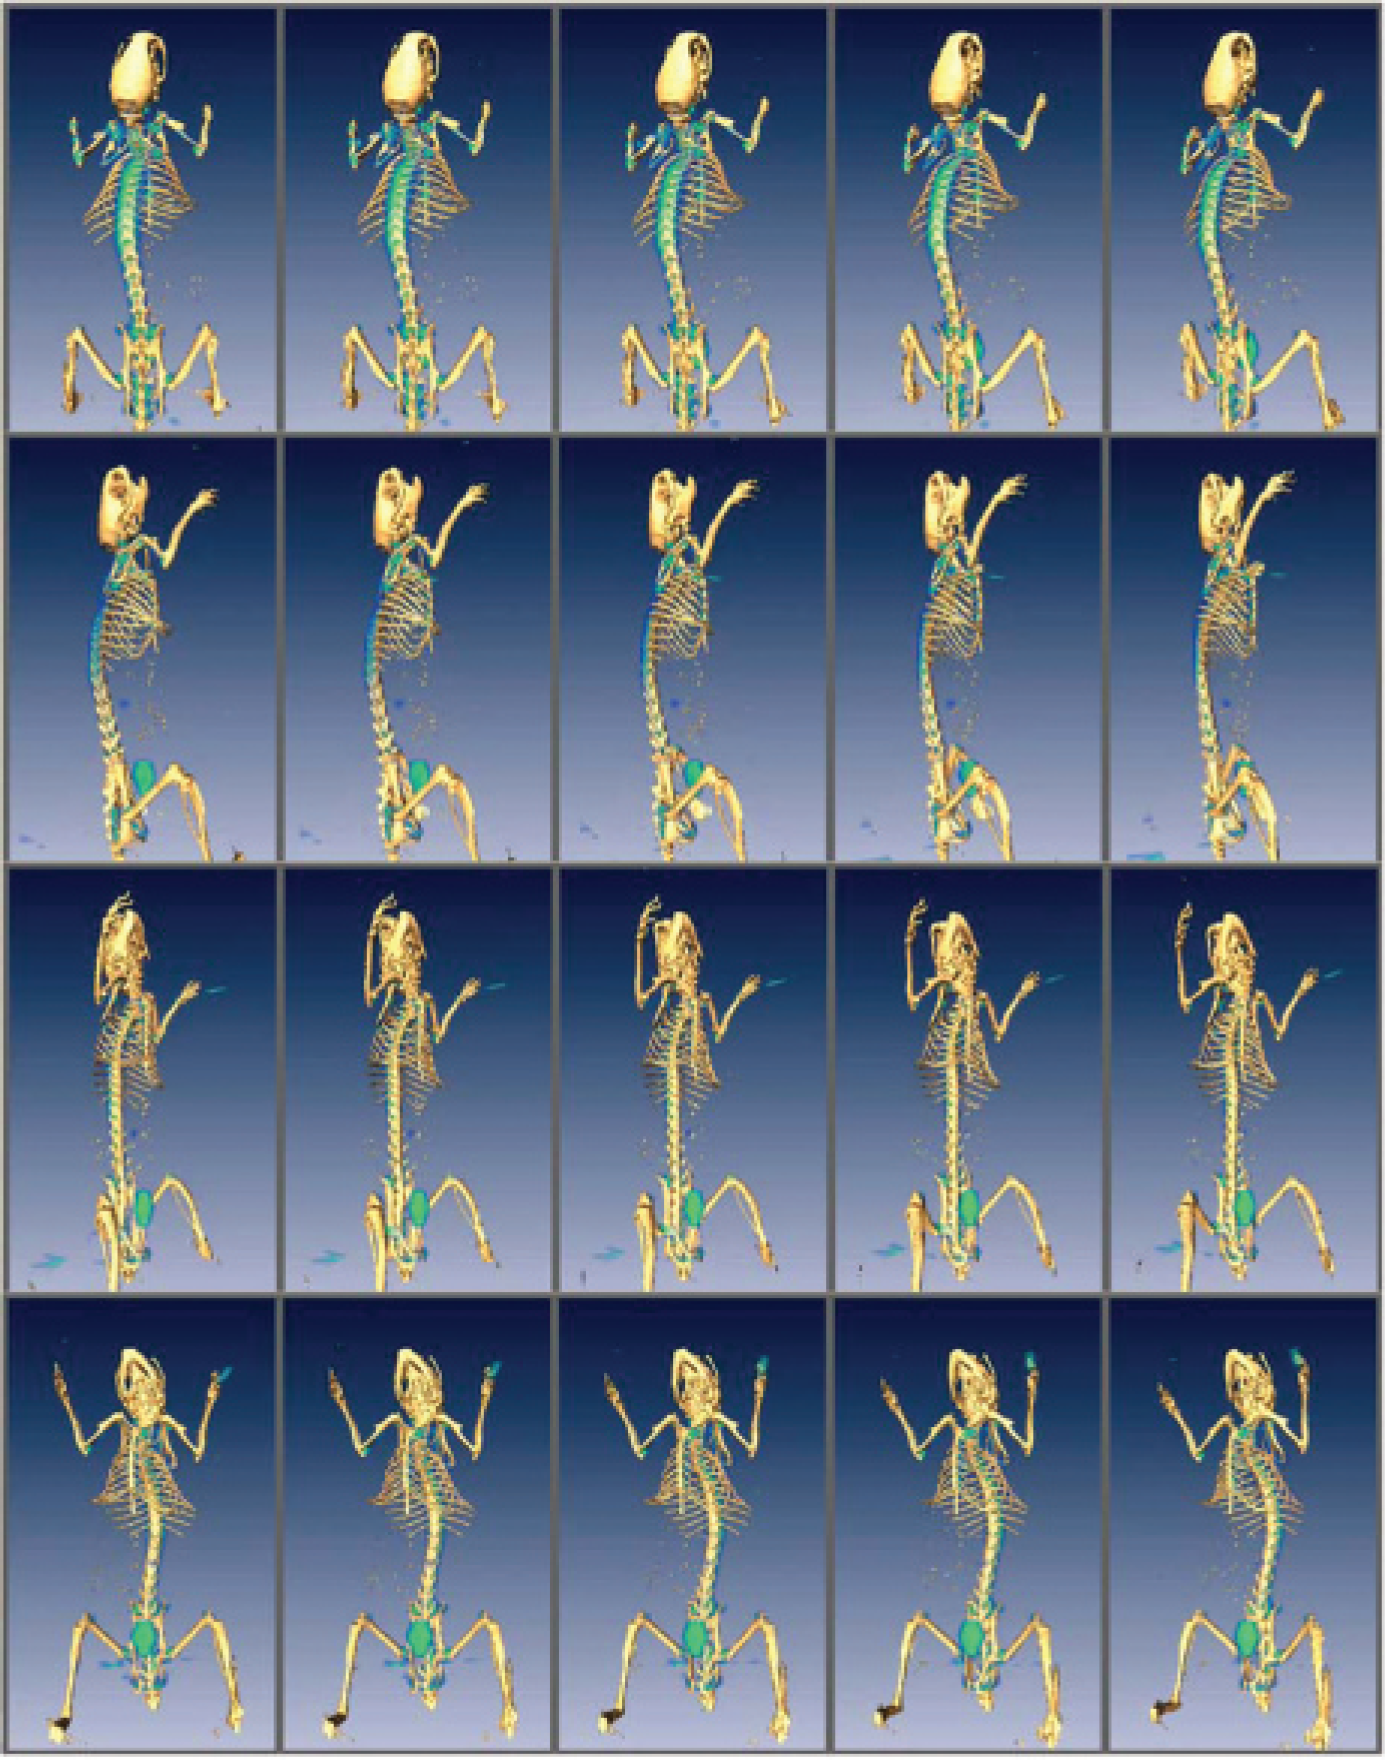
Renderings taken at various angles around a mouse. The mouse skeleton was derived from a computed tomographic data set, whereas the blue-green aura depicts 18F-fluoride activity, volume rendered from a registered positron emission tomographic (PET) bone-scan data set (in the PET data set, the head was excluded from the field of view). Adjacent pairs of these images constitute “cross-eyed” stereographic pairs. When viewed from approximately 12 inches away with eyes crossed just enough to produce a sixth image on each row, the resultant central set of four images (in each row) will appear to be three-dimensional.
The Bruker MR to microPET registrations are dependent on the accuracy of both the MR to microCAT and the microCAT to microPET registrations. However, as we have calculated, the errors should be well within the 2 mm spatial resolution of the PET images. Confirmation of this is provided in Figure 8, which shows a coronal slice through an 18F-FDG PET image set in a hot iron color scale, registered and alpha-blended onto an MR image set shown in grayscale.

Coronal magnetic resonance image of a mouse onto which is superimposed a registered 18F-fluorodeoxyglucose positron emission tomographic image showing heart and bladder uptake in a red to white-hot color scale. The transform defining this registration was the product of a fiducial marker-determined transform with the fixed microCAT to microPET transform.
The accuracy of the registrations between the X-SPECT and Bruker MR is dependent on the accuracy of the retrospective CT to MR registration and on the fixed SPECT to CT transform provided by Gamma Medica. Note that the bed does not move at all between the SPECT and CT scans, so this does not affect registration accuracy. The CT source and detector and the SPECT heads, however, do move and therefore potentially could influence the registration, although any error here is generally well below the SPECT resolution. Figure 9 consists of orthogonal slices through a registered pair of images showing renal cortex in a hot iron color scale as detected by 99mTc-DMSA pinhole SPECT alpha-blended with the MR image shown in grayscale.

Orthogonal magnetic resonance (MR) images of a mouse onto which are superimposed registered 99mTc-dimercaptosuccinic acid single-photon emisson computed tomographic (SPECT) images showing the renal cortex in a hot-iron color scale. Here both the MR and the SPECT scans were registered to the same Gamma Medica CT image set, the MR via a retrospective volume registration and the SPECT via the fixed transform provided by Gamma Medica.
Discussion
We have shown that a small animal can be maintained in a rigid position across multiple imaging sessions using a simple plastic wrap. This means of holding the animal can be generically applied to scanners from all manufacturers. We have also demonstrated how with simple hardware additions the wrapped animal can be reliably repositioned relative to a given scanner's frame of reference, yielding highly accurate whole-body inter- and intramodality registrations. Although the details of the design of the hardware adapters are specific to each scanner model, in principle, similar hardware can be constructed for virtually any scanner.
The described registration procedures avoid the complications inherent in the use of fiducial markers visible to PET and SPECT. Radionuclide-based fiducial markers can add noise and in other ways compromise image quality. They can also be cumbersome to use, especially if their intensity must be adjusted for each imaging session so as not to overwhelm or be overwhelmed by the object of interest.
Constraining the animal so that it does not move between imaging sessions also avoids the difficulties and complexity of nonrigid transforms. Even the most detailed nonrigid transforms may be too simplistic to accurately describe the complex ways in which the various organ tissues compress, stretch, and move relative to one another when the body takes different positions.
The main limitation of the procedures we have proposed is that they require that the animal be anesthetized across all imaging sessions. Thus, for example, registrations between functional images acquired serially over the course of several days cannot be conducted following these procedures alone. However, the existence of an accurately registered structural (MR or CT) image associated with each day's functional image in many cases will render such serial registrations unnecessary. Alternatively, the structural images, with their vastly greater information content, may serve as adequate proxies for the determination of a nonrigid transformation.
The greatest benefit the proposed procedures confer, we believe, is the confidence one can have in the registration result. Other methods that are based on the information content of the images can vary in accuracy with each new tracer or even with the shape of the tracer distribution, whereas the registrations here are robust and will be within a known error regardless of what tracer is used.
Beyond providing anatomic localization, accurately registered data sets can be used for PET/SPECT attenuation correction and in multispectral segmentation techniques.