
Abstract
Given that optical tomography is capable of quantitatively imaging the distribution of several important chromophores and fluorophores in vivo, there has been a great deal of interest in developing optical imaging systems with increased numbers of measurements under optimal experimental conditions. In this article, we present a novel system that enables three-dimensional imaging of fluorescent probes in whole animals using a noncontact setup, in parallel with a three-dimensional surface reconstruction algorithm. This approach is directed toward the in vivo imaging of fluorophore or fluorescent protein concentration in small animals. The system consists of a rotating sample holder and a lens-coupled charge-coupled device camera in combination with a fiber-coupled laser scanning device. By measuring multiple projections, large data sets can be obtained, thus improving the accuracy of the inversion models used for quantitative three-dimensional reconstruction of fluorochrome distribution, as well as facilitating a higher spatial resolution. In this study, the system was applied to determining the distribution of green fluorescent protein (GFP)-expressing T lymphocytes in a transgenic mouse model, thus demonstrating the potential of the system for studying immune system function. The technique was used to image and reconstruct fluorescence originating from 32 × 106 T cells in the thymus and 3 × 10⁵ T cells in the spleen.
OPTICAL IMAGING has emerged as a powerful tool for probing in deep tissues, where light propagates in a diffuse manner. Given that light interaction with different tissue components enables the visualization of tissue abnormalities or pathologic processes,1,2 the medical applications of optical imaging techniques cover a wide range, from probing hemodynamics3,4 to detecting tumors5–8 and providing functional imaging of the brain,9,10 among other applications. Although in most medical applications, the source of contrast is inherent (eg, tissue absorption or scattering), recently, a wide variety of fluorescent probes have been proposed as contrast agents for optical imaging studies. 11
Fluorescent contrast agents, first applied in cell biology12,13 and cell microscopy, 14 provide higher signal to noise ratios than intrinsic sources of contrast and high specificity, thus significantly improving the detection limit, resolution, and depth localization efficacy. Fluorochromes, fluorescent proteins (FPs), and bioluminescent proteins can be invaluable tools for probing molecular events and pathways inside living systems. 15 In parallel with probe development, significant interest in small animal imaging is being reported. 15 The number of genetically modified animal models carrying fluorescent tags in specific cells or organs is large and constantly growing.16–18
There are three major macroscopic techniques for imaging mice: bioluminescence imaging, planar fluorescence imaging, and optical tomography. In bioluminescence imaging, luciferase is administered into the body of the mouse and visible light is emitted from the luciferin substrate as it is oxidized. 19 The emitted photons are recorded in photographic images by sensitive cameras in a planar geometry. Luciferase imaging can provide images of surface events with high signal to noise ratios. However, quantification of signals seated deep in the body has not been yet realized using this technique. Some initial methods for producing tomographic images have recently been proposed; however, bioluminescence tomography is under ongoing investigation.20–22
In planar fluorescence imaging, fluorescent agents are administered to the animal and emit photons on planar light exposure.23–25 In terms of detection, planar imaging follows the same photographic principles as bioluminescence. Fluorescence imaging is a simple, high-throughput technique for monitoring surface events. However, owing to the lack of multiple projections and/or several source positions, depth resolution is not feasible. Moreover, the nonlinear dependence of light over depth is not taken into account, deteriorating the ability to quantify and volumetrically image the fluorescent signals, thus restraining the technique to depths of a few millimeters under the skin.
Alternatively, fluorescence molecular tomography (FMT) incorporates the principles of optical tomography with the use of fluorescent probes as a source of contrast.26,27 In FMT, the subject that carries the fluorescent probe is exposed to light from different source positions or patterns and the emitted light is captured by detectors arranged in a spatially defined order. The information is then mathematically processed, resulting in a reconstructed tomographic image. Reconstruction of near-infrared (NIR) probes was first explored owing to higher penetration in tissue of NIR light, but in recent studies, tomographic images of green fluorescent protein (GFP) expression from deep-seated locations in vivo have also been presented.28,29
On the other hand, transgenic mice models are invaluable tools for imaging biologic processes since they express FPs in specific cell or organ types. In many in vivo experiments, the administration or activation of the fluorescent probe was performed exogenously, with injection being the most common method. More specifically, administration of luciferase stimulates the emission of luciferin,30,31 and the labeling of the many targeted organs with NIR probes 32 or GFP cells23–25 is performed after implantation of the fluorescent probes. The use of FP-expressing transgenic animals as models comes with the significant advantage of keeping the animal intact while carrying FPs in specific cell types or organs, enabling more accurate measurements of time-dependent processes on the same animal.
Although most of the reported experimental setups are well suited for basic feasibility studies, they also come with significant limitations. Common to tissue measurements in several experimental or commercial setups has been the use of optical fiber guides for photon collection, which need to be in contact with the tissue,33,34 or the requirement of tissue to conform simple geometries, such as slabs35–38 or cylinders,26,39–42 often requiring compression or the use of matching fluids. Recently, theoretical developments in modeling arbitrary shapes and diffuse light propagation in free space 43 have led to the materialization of noncontact systems. Recently published studies describe systems that incorporate the noncontact recording of the outgoing radiation 44 and the noncontact irradiation of the subject. 28 Combining this noncontact approach with charge-coupled device (CCD)-based measurements can offer high spatial sampling, leading to large data sets (compared with the fiber-based systems), which are essential for high-quality tomographic images.45,46
In addition, the noncontact approach contributes to the simplification of the experimental procedure since the use of matching fluids is unnecessary. Noncontact optical tomography has been verified by means of fluorescence measurements with phantoms 47 and controlled experiments on mice ex vivo. 44 However, in these studies, the subject was either under compression while in contact with fiber-delivering systems or immersed in index-matching fluids to simplify boundary conditions, meaning that the full advantage of the noncontact approach had not yet been completely exhibited or exploited.
The work presented here is focused on two major areas. The first is the implementation of a noncontact, fluid/compression-free system incorporating a rotation stage for the angular movement of the subject. The second is the in vivo extraction of volumetric images of GFP concentration in intact transgenic mice expressing GFP in their T cells. We chose to image the thymus and the spleen because both contain large numbers of T cells and are organs of the immune system with great biologic importance.
Although the new noncontact tomographic system is based on known tomographic principles employing fluorescence normalized data, 48 it has many advantages in terms of experimental simplicity. It can operate in either reflection or transmission geometry setups depending on the targeted area or organ and can perform measurements over a full 360°. The angular movement of the subject leads to high angular sampling and thus to more complete data sets. Whole-body tomography is now more feasible since the CCD can focus on every part of the mouse by means of the rotation stage.
In this article, we first describe the components and the implementation of a whole-body tomographer employing a rotation stage and show the steps followed for acquiring images. Then the details of the reconstruction procedure are presented, followed by a description of the animal models used in the study. Transgenic mice with GFP-expressing T cells were used as targets and in vivo tomographic images of the spleen and the thymus were reconstructed, as shown in the Results section. The quantification accuracy and the sensitivity of the system are then evaluated with data from a biologically relevant study. We then discuss the impact of the in vivo imaging of lymphoid organs to the study of the function of the immune system. Finally, we propose how this noncontact whole-body setup can be further developed and its applications expanded.
Materials and Methods
Mice
Transgenic mice expressing GFP under the control of CD2 promoter in all T cells (CD2-GFP) were generated as described previously. 49 Transgenic mice were backcrossed for at least 10 generations in the C57Bl/10 (B10) genetic background. All mice were bred in the Institute of Molecular Biology and Biotechnology animal facility under barrier conditions in accordance with established guidelines. Experiments were carried out with 4- to 6- week-old male CD2-GFP transgenic and B10 control mice.
Owing to the black fur of B10 mice, the preparation of the subjects for the experiment included shaving to expose the skin at the region of interest. For the shaving procedure, the mouse was tranquilized using Avertin (16.1 μL/g body weight). During the measurements, the subject was tranquilized with a gaseous mixture of isoflurane and oxygen. To avoid any interaction with the Avertin, the measurements were performed at least 24 hours after the injection.
Flow Cytometry Analysis
Single-cell suspensions were prepared from the thymus and spleen. The total number of cells was counted, and the percentage of GFP-expressing cells was determined by flow cytometry on a FACSCalibur flow cytometer (BD Biosciences, San Jose, CA) and analyzed with CellQuest (BD Biosciences) software.
FMT Setup
The system used for performing noncontact FMT is shown in Figure 1 and is described in detail in Meyer and colleagues. 50 For the excitation of the fluorescent probes (GFP, yellow fluorescent protein, etc.), a cw Ar+-Laser (LaserPhysics, Reliant 1000m, West Jordan, UT) was used. Protection against ambient light sources was provided by a custom-made 5 mm-thick aluminum chamber (shown transparent in Figure 1). An x-y translation system (model 8MT167-100, Standa, Vilnius, Lithuania) provided the scanning of the illumination points on the surface of the target. The rotation stage (model 8MR180, Standa), where the subject was placed, was fixed in an upside-down position on a frame, which can be moved on a rail along the optical axis of the camera. The signal acquisition was provided by a thermoelectrically (TE)-cooled 16-bit CCD, cooled down to −70°C, chip size 1,024 × 1,024 pixels (Andor Corp., Belfast, Northern Ireland), equipped with a SIGMA 50 mm f/2.8 objective (Sigma Corporation, Tokyo, Japan), which was focused onto the subject's area closest to the camera. The CCD was mounted on one of the side plates of the chamber.

Schematic diagram showing the major components of the fluorescence molecular tomography imager. CCD = charge-coupled device; PC = personal computer.
The system can be operated in either reflection or transmission geometries depending on the positioning of the translation stages, with the beam collimating optics for the scan. The translation stages can be mounted either on the camera side (reflection) or in the optical axis of the camera (transmission), thus enabling a wide range of experimental setups and requirements for superficial or deep tissue probing, respectively. Data acquisition and processing were performed on a 3.0 GHz personal computer with 512 MB RAM, whereas the full operation of the system was controlled by custom-designed software in the LabView (National Instruments, Austin, TX) environment.
Antireflection-coated emission bandpass interference filters (55 mm diameter) were used for signal detection of the various probes (Chroma Technology Corp., Bellows Falls, VT). To use normalized data for each source position and projection, two measurements were taken: one corresponding to the fluorescence emission and one corresponding to the excitation wavelength. For recording the emission of GFP, a 10 nm bandwidth centered on a 510 nm filter was used. The excitation measurements were performed with a 55 mm narrow-band filter for 488 nm in front of the camera. The laser was coupled with a 600 μm Ultra-violet enhanced acrylate nylon (UVAN) multimode fiber, numerial apperture (NA) = 0.22, l = 1.5 m (FiberTech GmbH, Berlin, Germany) and mounted on a 25 mm x-y stage microbank rail system (Linos, Germany). The beam was then aligned with a beam collimator to produce a 2 mm-diameter beam at the target. The whole system was mounted with a custom-made holder to the x-y translation stage. For the reconstruction of the three-dimensional shape of the mouse, a custom-made homogeneously illuminating source was constructed using an array of white light-emitting diodes and two flat highly scattering white sheets of polymethylmethacrylate.
A Tec-3 isoflurane vaporizer (Lumic International, Baltimore, MD) was used for the tranquilization of the mice. The percentage of isoflurane was varied depending on the age and weight of the subject. The mixture was adjusted until normal breathing frequency was acquired to minimize movement owing to muscle contraction. The output of the vaporizer could be directed into the imaging chamber for maintaining anesthesia throughout the measurements or into a custom chamber necessary for pretranquilization when attaching a mouse to the holder.
Experimental Protocol
Initially, the subject was placed and fixed on the rotation stage and the system was properly aligned to the center of rotation. After that, the number and arrangement of sources were chosen and set using the LabView software, along with the number of projections (angle steps), according to the size and shape of the sample and the specific experimental requirements. We chose to point the sources directly to the area of the body where the targeted organ is expected to lie underneath since we wanted fast results for testing our technique. In the event that the place of the GFP cells is not known a priori, a full-body scan can be performed if the experiment's time does not exceed the time limit of keeping an animal under anesthesia.
Then the fluorescence and excitation signals were acquired with the corresponding filters. The laser power being delivered onto the mouse was 40 mW for the fluorescence measurements and in the order of tenths of microwatts for the excitation measurements. One image was recorded for each source position and rotation angle, resulting in a Nx × Ny × Ns × Nr array of images, where Nx and Ny are the number of pixels in × and y, respectively (512 × 512 in our measurements after a 2 × 2 binning), Ns is the number of sources, and Nr is the number of angle steps. The positions of the sources were also imaged on a white highly scattering Teflon sheet placed at the focal plane of the camera to accurately calculate the position of each source in the focal plane.
Finally, the mouse was back-illuminated with the custom-made white light source, projecting a shadow in the direction of the camera. A series of shadow images of the sample in each rotation angle was acquired to reconstruct the three-dimensional surface. The surface reconstruction was obtained by adding all projections (shadows) 51 of the objects using a back-projection algorithm and keeping those voxels in space that included all projections. 50 The details of this procedure can be found in Meyer and colleagues. 50 The number of angle steps for the fluorescence and excitation measurements depends on the organ being measured. For the three-dimensional surface measurement, 71 angle steps with an increment of 5° were required for a reliable three-dimensional map of the sample.
The measurements were performed in reflection mode with the ventral side of the mouse facing the camera. This geometry was found to be more suitable for detecting signals originating from shallow regions, as in the case of the targeted organs (thymus, spleen). The number of sources and angular projections were chosen during each experiment by estimating where the organ or organs under study were expected to be, taking into account the anatomy changes owing to the subject's positioning. The desirable resolution and the duration of the whole procedure while the subject is under anesthesia were also taken into account.
In this work, we performed four separate experiments. The different scanning grids that were used for the recording of the tomographic projections in each experiment are described below. The first experiment comprised a 4 × 4 source grid with the spacing between consecutive horizontal and vertical steps being 2.5 mm. The laser beam irradiated the subject at the upper anterior torso where the thymus is located a few millimeters below the surface. In the second experiment, the scanning was performed on a vertical line employing three sources, with the step size being 2.5 mm. In this case, the subject was measured at four angular positions in steps of 10°. The body area being covered was the region of the thymus. In both cases, the detection area used was a 14 × 14 detector grid covering an area of 14 × 8.5 mm2.
In the third experiment, the target was to image both the thymus and the spleen of the same mouse. The rotation stage was used to expose the two different areas of the mouse body to the camera. In this case, both the thymus and the spleen scans comprised 5 × 5 sources in steps of 2 mm. Twenty × 20 detectors were used for both organs, covering an area of 12 × 12 mm2.
The fourth experiment concerned measurements on the spleen using a 5 × 5 source grid in steps of 2 mm and only one projection, whereas the detection composed of 20 × 20 detectors, covering an area of 12 × 12 mm2. For the case of the quantification experiment, different numbers of GFP+ T cells were injected to a number of nontransgenic B10 mice. The GFP+ cells were previously extracted from transgenic mice expressing GFP in their T lymphocytes. The amounts of GFP cells varied between 0.5 and 10 million (0.5, 2.5, 5, and 10 million), and the cells were administered by tail vein injection. A control mouse was also measured for reference. The GFP cells migrated to the peripheral lymphoid organs, within 2 days of the initial injection. We then performed a FMT measurement focusing on the spleen of the mouse. After the end of the FMT measurement, the mouse was sacrificed and the exact number of T cells present in the spleen was measured with fluorescence-activated cell sorter (FACS) analysis and correlated with the FMT results. It should be emphasized that similar analysis for quantifying the reconstructed fluorescent signal originating from the thymus cannot be performed in a systematic way because there is no biologic protocol for administering different numbers of cells to the thymus. After being injected, the cells migrate to all of the peripheral lymphoid organs except the thymus.
The whole experimental procedure for each of the mice as described above took about 45 minutes, including the fluorescence, excitation, geometry, and beam position measurements.
Theory and Data Analysis
To account for the strong absorption of light in the visible spectrum, a modified solution of the diffusion equation was used.52,53 This solution applies a modified diffusion coefficient with a weighted dependence on the absorption coefficient,52,53 which has been shown to describe the propagation of light in highly absorbing media in in vivo studies. 28
For the tomographic measurements, both the fluorescence and the excitation measurements were used to calculate the normalized Born field, which was then used in the reconstruction algorithm. The normalized Born approximation was used by dividing the fluorescence measurements, according to the method presented in Ntziachristos and colleagues 26 and Ntziachristos and Weissleder, 48 which is the Born approximation of a linear approach to the inverse problem, 54 and assuming homogeneous optical properties. The accuracy of the Born approximation with homogeneous optical properties has been exhaustively studied in phantoms 55 and in vivo,26,28 yielding excellent results. To account for the geometry and the noncontact measurements, we have used the non-contact equations that model free space propagation of diffuse waves43,44 (for details, see Ripoll and Ntziachristos 56 ). The procedure followed for mapping the data onto the three-dimensional surface is described in detail in Meyer and colleagues 50 and Ripoll and Ntziachristos. 56 Finally, the contribution of the boundary is taken into account by rigorously applying the transformation formulas presented in Ripoll and Ntziachristos. 57 To that end, accurate boundary extraction is fundamental to calculate the correct Green's functions required in the tomographic problem.
The normalized measurements from multiple source positions are inverted with the algebraic reconstruction technique with positive restriction to retrieve the spatial distribution of the fluorescent concentration. 48 Typical inversion times for 10 iterations were in the order of 1 minute on a 3 GHz Pentium 4 processor with mesh values ranging from 2,600 to 4,000 voxels.
Results
The methodology described above was applied in detecting the fluorescence activity from GFP-expressing T lymphocytes in the thymus and spleen of CD2-GFP transgenic mice in an initial attempt to assess the system's ability to measure fluorescence activity from cells in the lymphatic system. Taking into account the strong absorption of light in the visible spectrum, the thymus of a 4- to 6-week-old mouse containing in the order of 108 T cells and located ≈4 mm deep beneath the skin was our primary target. We also chose to image the spleen, which contains a lower number of T cells but is relatively more superficial and has high blood content.
Typical normalized Born data obtained from the thymus of a transgenic mouse and a control mouse are shown in Figure 2, A and B, respectively. The figures show normalized Born data averaged over all sources overlaid on a white light image of the mouse. The dimensions of the overlaid frame match those of the selected detection area. As previously mentioned, the acquisition was performed using a 4 × 4 source grid to cover the whole area of the thymus.

Normalized Born data projected on the reconstructed three-dimensional surface of an (A) CD2–green fluorescent protein transgenic mouse and (B) a B10 control mouse obtained after averaging over all sources for an x-y source scan.
Similar data are also presented in Figure 3 for the case of the linear scan employing three sources and four angle steps. Data for the transgenic and control mice are shown in Figure 3, A and B, respectively. The implementation of the rotation can provide angular projections to the reconstruction algorithms, previously not being captured by the planar tomographic systems. In both cases shown in Figures 2 and 3, the signal at the thymus in the GFP-expressing mouse is very high, whereas the control mouse shows virtually no signal.
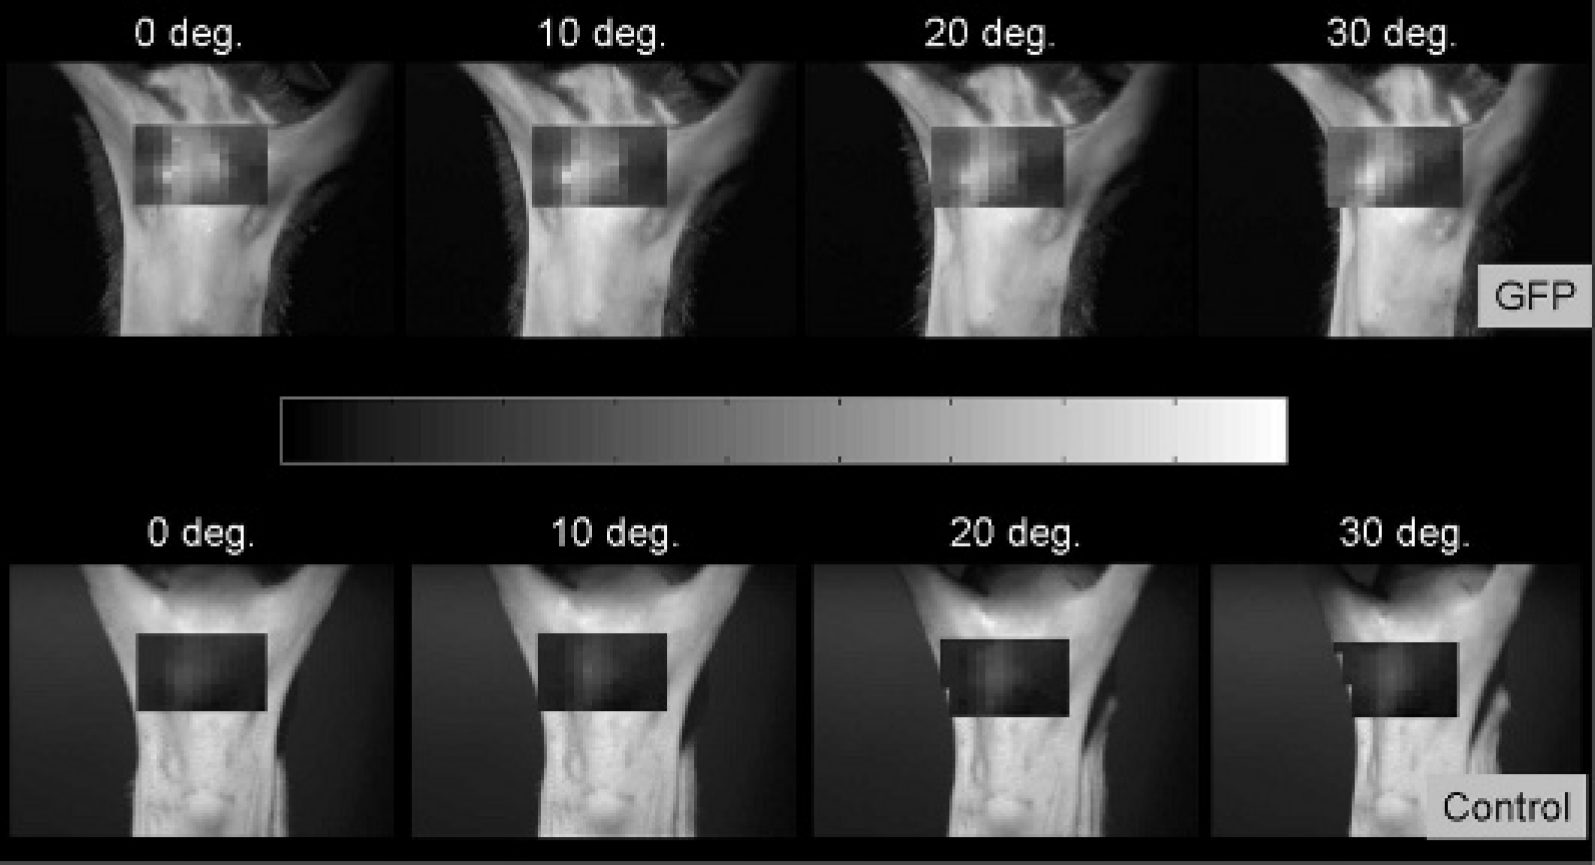
Normalized Born data of a CD2–green fluorescent protein (GFP)-expressing mouse versus a B10 control mouse for four different angle steps projected on the white light images of the mouse obtained with the inverse Radon transform procedure described in the text.
Typical data such as those presented in Figures 2 and 3 serve as forward data for the reconstruction of the three-dimensional maps of the fluorescence activity. 54 In Figure 4, a three-dimensional reconstruction of GFP concentration located in the thymus of a transgenic mouse is presented. Different views of the reconstructed concentration rendered together with the three-dimensional geometry of the mouse body are shown. The shape of the reconstructed fluorescence map and its location inside the body strongly match with the anatomic characteristics of the thymus. The reconstructed object located on the left side of the thymus is an artifact caused by the concave shape of the mouse's chest wall on that area, which we present to exemplify the type of artifacts expected in noncontact measurements. Artifacts do not always arise but are very common in all optical tomography approaches, also when using matching fluid. Similar results are obtained for the case of the spleen and are presented in Figure 5. In this case, the reconstruction has no artifacts because of the smoother surface of the body in this region and the more superficial position of the organ compared with the thymus. Running the reconstruction algorithms for the case of the control mouse and applying the same parameters as for the case of the GFP mouse, four times the magnitude of the lower signal, corresponding to the skin autofluorescence, was reconstructed for both cases of the thymus and the spleen (images not shown here). At the end of the measurements, the mice were sacrificed and the exact number of T cells present in the targeted organs was determined with flow cytometry analysis and correlated with the FMT results. The thymus and the spleen of the mouse were found to have 3.2 × 10⁷ and 1.1 × 10⁷ GFP T cells, respectively.
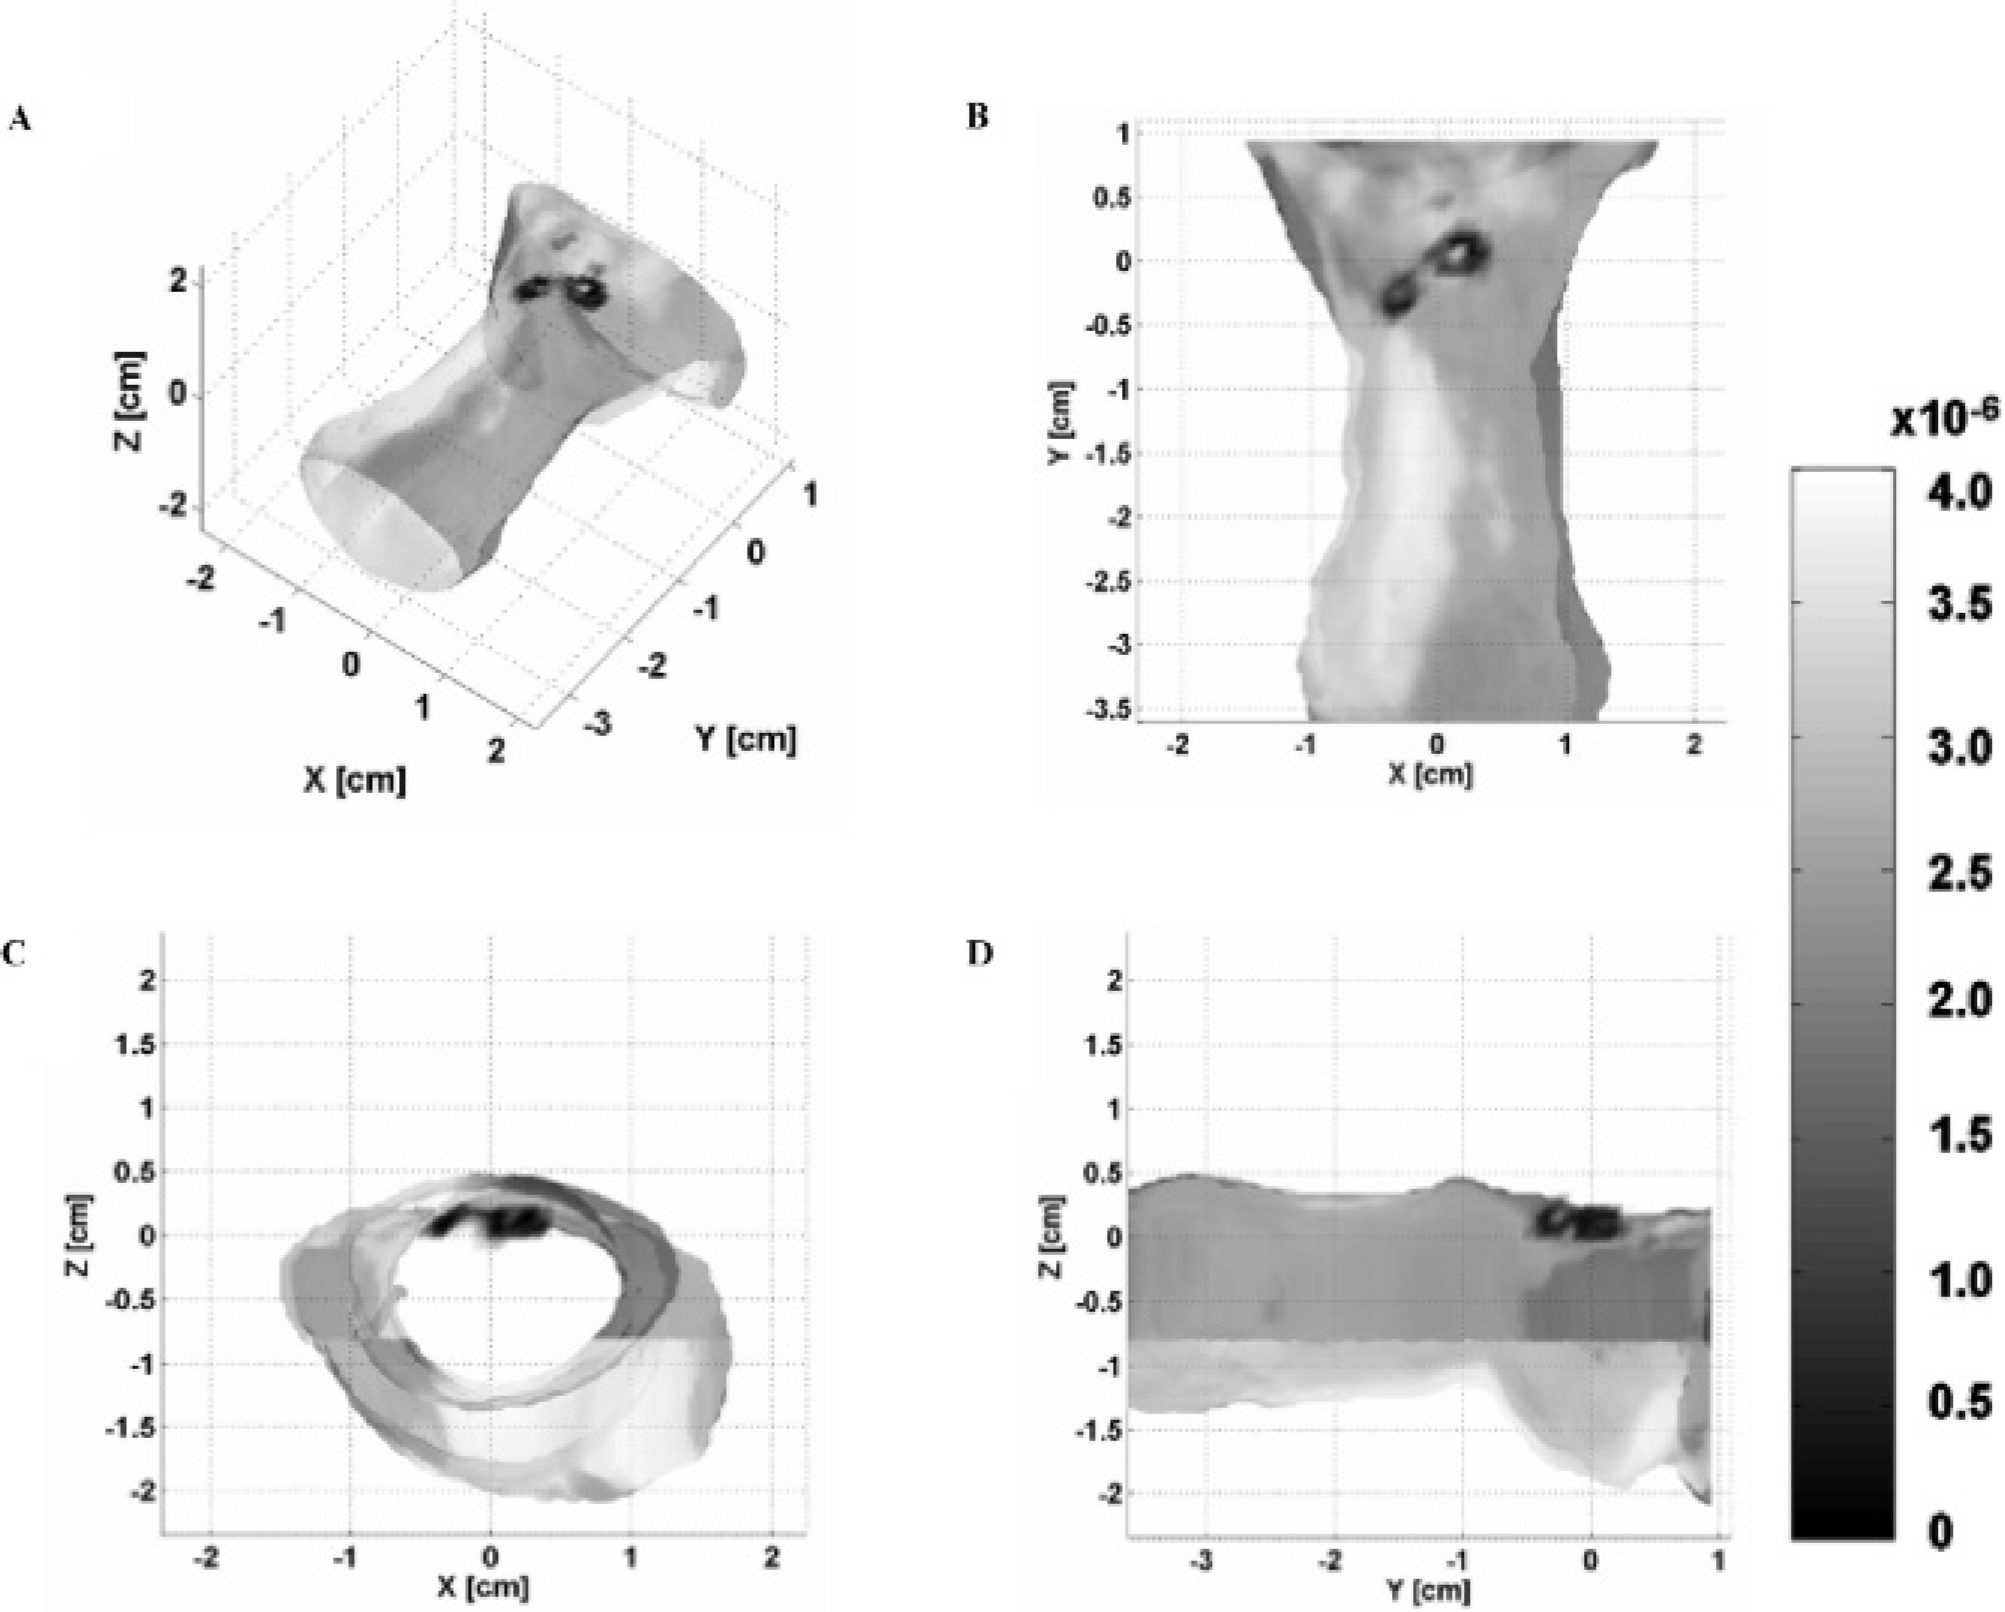
Different views of a three-dimensional reconstruction of green fluorescent protein (GFP) activity in the thymus of a CD2-GFP transgenic mouse in vivo. The reconstructed signal is rendered to the three-dimensional surface of the animal. An orthographic view of the tomographic image is shown in A. B to D show the coronal, axial, and sagittal views of the reconstructed thymus rendered to the three-dimensional surface.
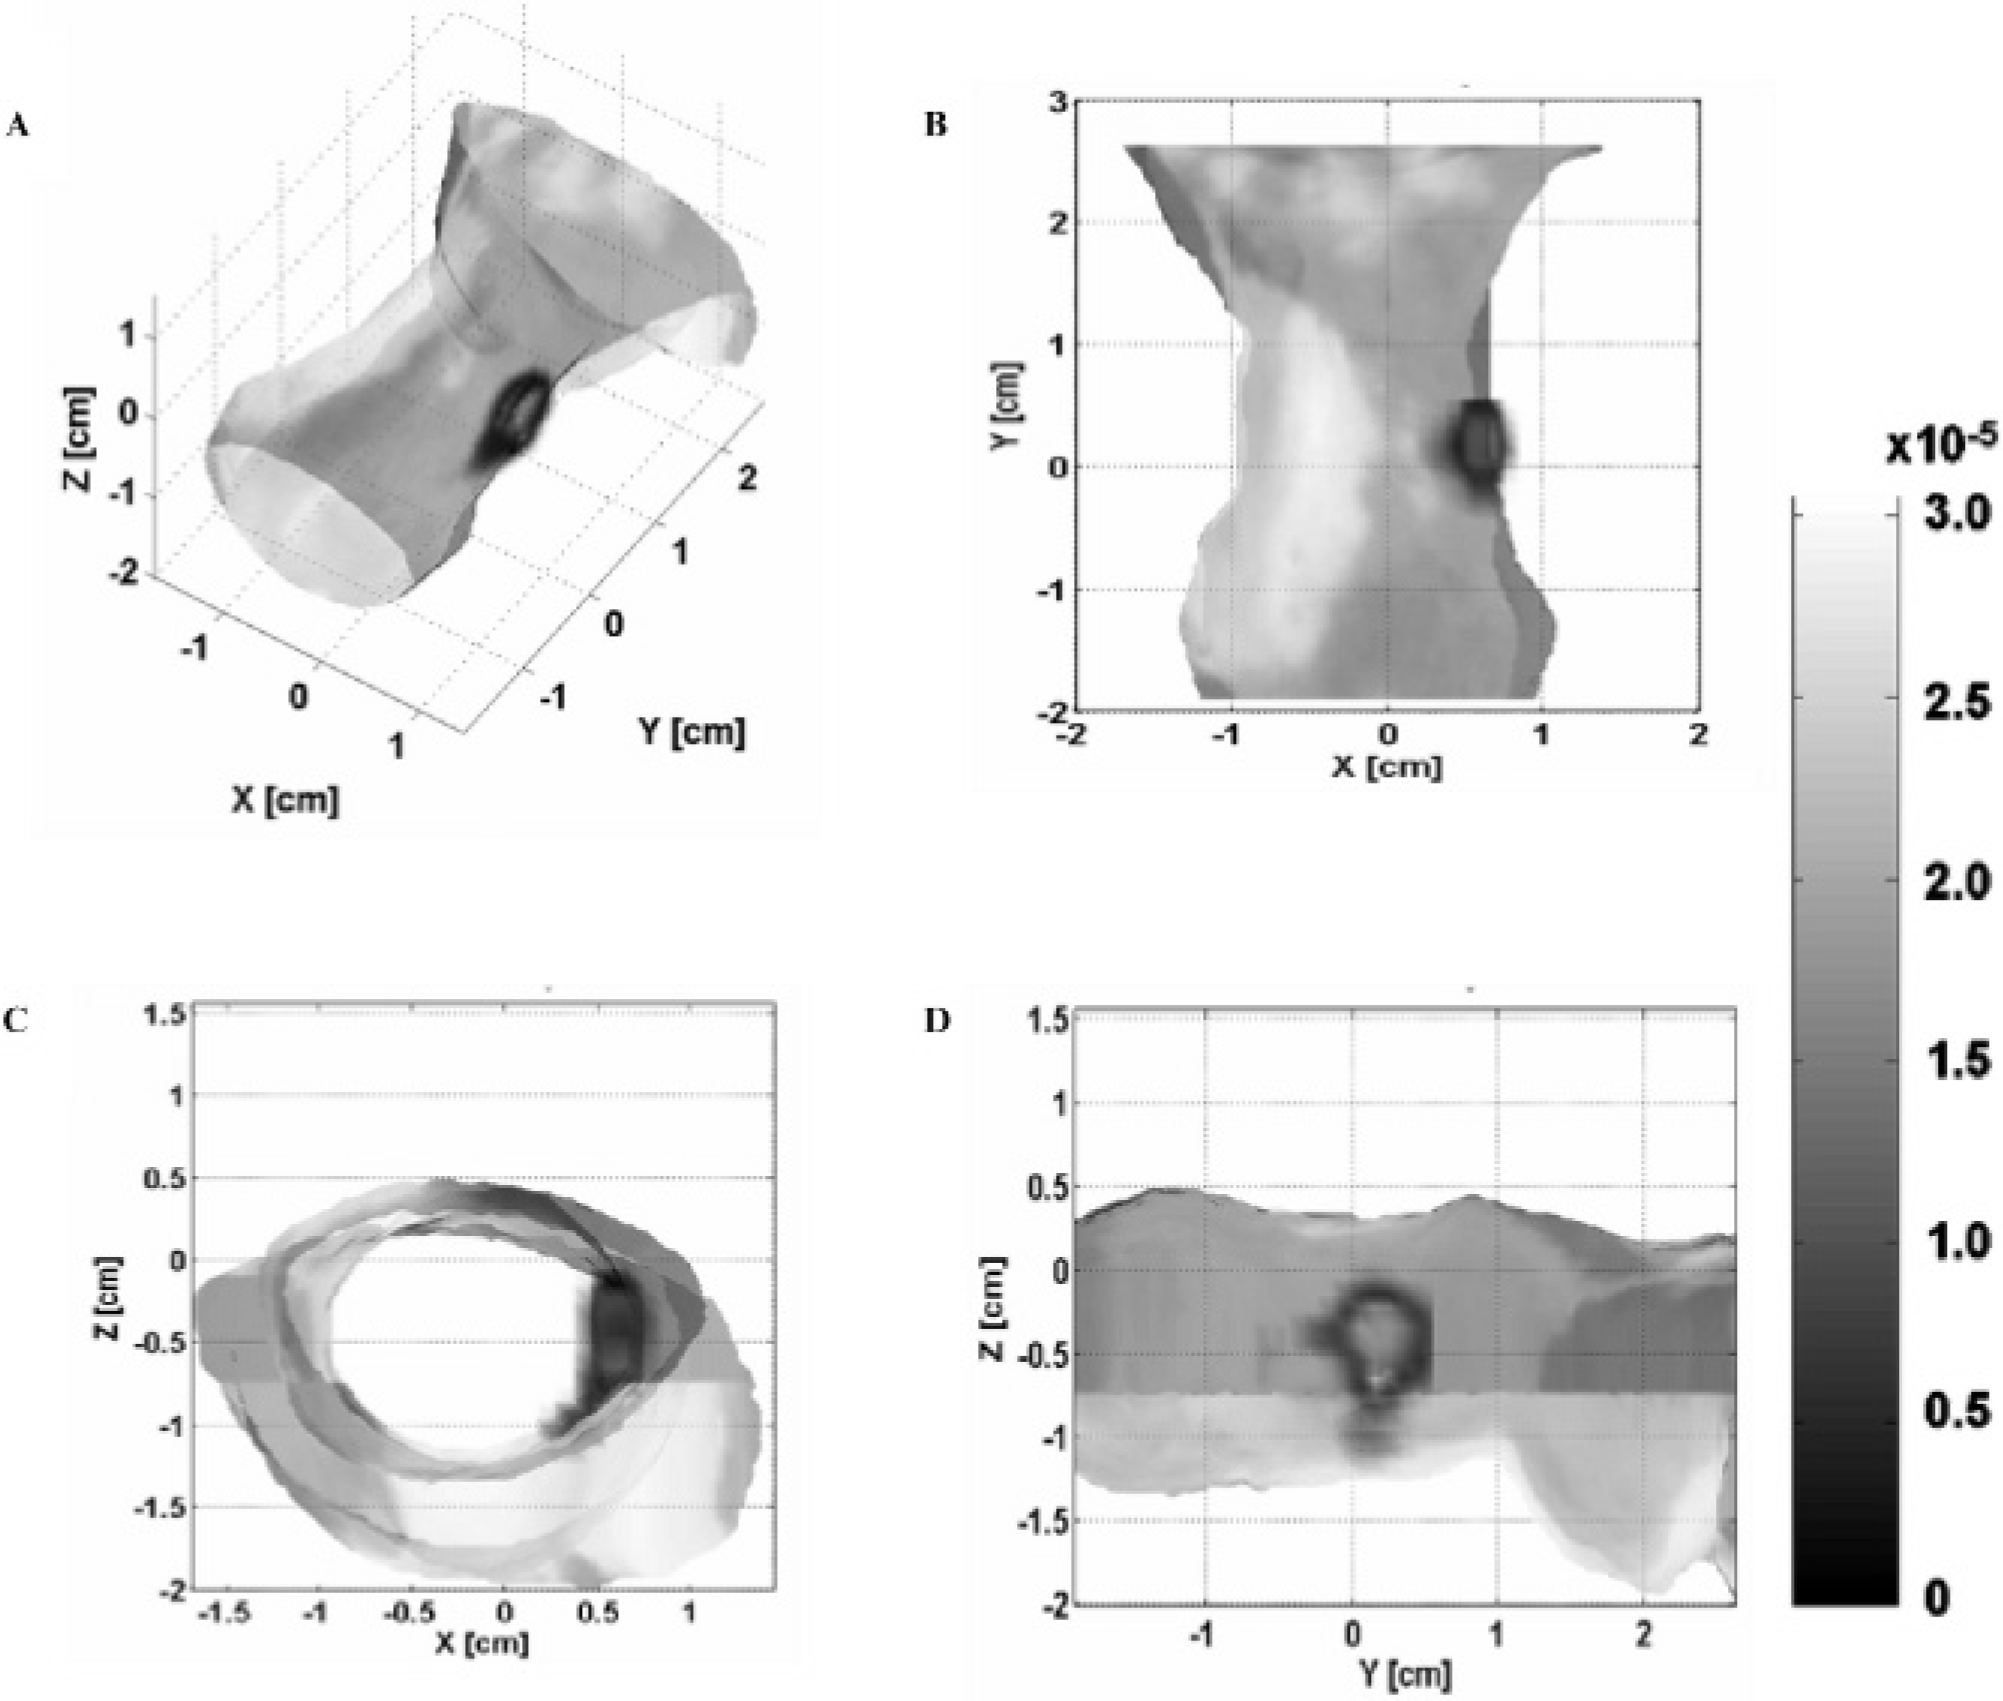
Different views of a three-dimensional reconstruction of green fluorescent protein (GFP) activity in the spleen of a CD2-GFP transgenic mouse in vivo. The reconstructed signal is rendered to the three-dimensional surface of the animal. An orthographic view of the tomographic image is shown in A. B to D show the coronal, axial, and sagittal views of the reconstructed spleen rendered to the three-dimensional surface.
Data obtained from both the FMT reconstruction and the FACS analysis were used to asses the quantification accuracy and the sensitivity of the system, as presented in Figure 6, where the FMT reconstructed values are plotted against the corresponding FACS values. The × axis presents the number of cells being injected into mice. The FMT results strongly match the FACS results, the latter being the actual number of cells present in the spleen. The realistic detection limit of the system was measured to be around 3 × 10⁵ T cells.

Quantification data demonstrating the accuracy and sensitivity of the system and method. The data were obtained from tomographic measurements in the spleen of B10 nontransgenic mice after the administration by injection of different amounts of green fluorescent protein (GFP)+ T cells taken from GFP transgenic mice. In the graph, the fluorescence molecular tomography (FMT) reconstructed values are plotted against the numbers obtained from fluorescence-activated cell sorter (FACS) analysis. The system was able to measure as low as 3 × 10⁵ cells in the initial studies and presented a linear response.
These experimental results show that the system is suitable for three-dimensional free space in vivo imaging of organs of the immune system and can be used to monitor processes that will reveal hidden aspects of the function of several important diseases.
Discussion
In this article, we have presented the design, implementation, and initial testing of a novel three-dimensional imaging system suitable for in vivo noncontact FMT. The system makes use of a rotation stage for the whole-body imaging of the animal. Its unique versatility lies in the fact that it operates in a noncontact geometry with no use of matching fluids. In the transmission geometry, matching fluids can be useful since they strongly reduce nonscattered light when laser scanning is performed on areas close to the edges of the main body (off-bulk body areas), on the leg, for example. Also, the use of matching fluids can simplify the geometry of the tomographic problem. However, the application of novel theoretical tools can provide simpler experimental setups for imaging arbitrary geometries. Also, the fluid-free noncontact system can be further modified with the use of crossed polarizers for blocking the unscattered light. The noncontact approach is a significant step forward in terms of experimental simplicity and comfort of the animal.
The system is able to record large angular and spatial data sets for probing of fluorescence activity. Furthermore, the rotation of the subject and the adaptive source scanning widens the field of view of the tomographic system to cover many body regions and image many organs by simply rotating the subject, thus expanding the capability to perform whole-body animal scanning. In combination with the advanced algorithm developed for modeling light propagation, extracting the three-dimensional surface and inverting the data, and a user-friendly interface, the system offers the noncontact experimental simplicity of common clinical tomographic approaches, such as x-ray computed tomography.
We have described the capacity of the system to detect fluorescence signals in vivo from GFP-expressing T cells deep in the body. Experiments were performed on live transgenic mice that express GFP on their T cells. It should be emphasized that no exogenous fluorescent probe was administered. The thymus was the first target imaged since it contains the largest number of T cells, typically in the order of 108. The spleen, which is also one of the primary targets for immunologic studies, was also imaged successfully. The system was able to detect as low as 3 × 10⁵ GFP+ cells in the spleen, as shown by in vivo quantification data correlated with values obtained from FACS analysis. This number could be significantly decreased when skin autofluorescence is removed from the signal. Future studies may include real-time imaging of cell interactions, preferential migration or distribution of cells within the immune system, and the behavior of lymphocyte cells during the immune response. It is expected that this will provide an invaluable experimental tool for biomedical research in several areas, such as autoimmunity and cancer transplantation.
One of the main problems of reflection imaging in the visible spectrum, besides strong absorption, is tissue autofluorescence. Tissue autofluorescence appears as a uniform background signal on the recorded images, especially in the reflection geometry, and compromises the resolution and the detection limit of the tomographic method. However, it should be stated that in the in vivo experimental results, even though autofluorescence was present, the fluorescent signal emitted from the targeted organs was strong enough that the tomographic images were not significantly affected, reconstructing the GFP concentration without severe artifacts. On the other hand, for experiments in which resolution and detection limit are critical, the autofluorescence of tissue should be taken into account, and several methods have been proposed for eliminating this effect.58,59 These include capturing images at different spectral windows using a multispectral approach and applying unmixing algorithms for the extraction of the targeted fluorescent signal.59,60
When operating in reflection mode, high throughput for imaging superficial targets can be achieved since signals are intense and exposure times can be short. On the other hand, when high sensitivity is required for probing, the whole volume of the subject transillumination is preferred. The ability of the system to operate in both geometries allows for measurements that cover a wide range of experimental requirements and models.
Imaging in the visible spectrum is limited in large cell populations or in superficial or subcutaneously seated organs. This fact can be altered by the expansion of the fluorescent palette to the NIR by the development of new fluorescent probes. Great efforts are being made in the area of biotechnology for the engineering of red-shifted proteins.61–63 The development of red-shifted FPs can expand the capability of imaging in terms of resolution and detection limit. This would also allow the use of transillumination as the standard illumination geometry, further minimizing the excitation of the skin autofluorescence compared with the reflection mode.
The system and method described are capable of operating at different excitation and emission wavelengths using the appropriate filters, making the detection of multiple fluorophores and fluorescing proteins feasible, thus increasing the number of biologic processes that can be targeted. Currently, we are implementing algorithms for unmixing the fluorescence obtained from multiple fluorophores and reconstructing the florescence data.
The setup could be improved by minimizing the time required for one full experiment by designing and automating a system for filter swapping and autofocus zoom objectives and an x-y-positioning system for the sample to enable the observation of various areas of interest (such as in vivo imaging of FP emission in single organs). Furthermore, an improved system would incorporate a second imaging modality, with computed tomography being the strongest candidate, for providing anatomic maps of the subject.
In conclusion, the system presented could be used in vast numbers of different experimental models targeting different important biologic processes and functions, as well as different types of diseases.