
Abstract
Real-time visualization of calcium (Ca2+) dynamics in the whole animal will enable important advances in understanding the complexities of cellular function. The genetically encoded bioluminescent Ca2+ reporter green fluorescent protein–aequorin (GA) allows noninvasive detection of intracellular Ca2+ signaling in freely moving mice. However, the emission spectrum of GA is not optimal for detection of activity from deep tissues in the whole animal. To overcome this limitation, two new reporter genes were constructed by fusing the yellow fluorescent protein (Venus) and the monomeric red fluorescent protein (mRFP1) to aequorin. Transfer of aequorin chemiluminescence energy to Venus (VA) is highly efficient and produces a 58 nm red shift in the peak emission spectrum of aequorin. This substantially improves photon transmission through tissue, such as the skin and thoracic cage. Although the Ca2+-induced bioluminescence spectrum of mRFP1-aequorin (RA) is similar to that of aequorin, there is also a small peak above 600 nm corresponding to the peak emission of mRFP1. Small amounts of energy transfer between aequorin and mRFP1 yield an emission spectrum with the highest percentage of total light above 600 nm compared with GA and VA. Accordingly, RA is also detected with higher sensitivity from brain areas. VA and RA will therefore improve optical access to Ca2+ signaling events in deeper tissues, such as the heart and brain, and offer insight for engineering new hybrid molecules.
Ca2+ IS A UNIVERSAL SECOND MESSENGER regulating many cell signaling pathways.1,2 Optical imaging of Ca2+ signaling therefore contributes enormously to our understanding of many biologic processes, such as fertilization, neurotransmission, gene expression, and muscle contraction. Advances in genomics and proteomics have been followed closely with a shift toward the use of genetically encoded probes for virus-mediated transfection or for expression in transgenic animals. Among them are a new class of fluorescent Ca2+-sensitive probes, which can be targeted to subcellular regions of the cell and to specific cell types during development and in adult transgenic animals.3–6 Despite important progress in this field, fluorescent Ca2+-sensitive proteins, such as the “cameleons,”7,8 “pericams,” 9 and G-CaMP, 6 can be used only in applications that are invasive and restricted to local tissue sites because they require the input of external radiation for excitation of the fluorophore. Alternatively, a major challenge is to develop whole-animal imaging for real-time analysis of signaling pathways at the molecular level in freely moving animals.
Bioluminescence is light produced from enzymemediated oxidation of a substrate. Given that mammalian tissues have very low levels of intrinsic bioluminescence, the light from bioluminescent reporters can be detected from within intact organisms with a very high signal to noise ratio. 10 Accordingly, whole-animal bioluminescence imaging (BLI), using bacterial, firefly, or Renilla luciferases, provides a highly sensitive technique for detecting gene expression in small animals.11–13 Another well-known luciferase is the Ca2+-sensitive photoprotein aequorin, which was cloned from the jellyfish Aequorea victoria.14,15 In contrast to firefly or Renilla luciferases, the light reaction is dependent on Ca2+. When Ca2+ binds to aequorin, the enzyme undergoes a conformational change that allows oxygen to react with its substrate coelenterazine, and this is followed by an intermolecular chemiluminescence resonance energy transfer (CRET) to green fluorescent protein (GFP), which red-shifts the blue-light of aequorin into the green (λmax = 509 nm). 16
The genetically encoded, Ca2+-sensitive bioluminescent hybrid protein green fluorescent protein–aequorin (GA) is based on the light-emitting system that evolved in the jellyfish. 17 In contrast to aequorin alone, GA can be localized by the fluorescence of GFP, has higher stability, produces higher levels of Ca2+-induced bioluminescence, and has peak emission at green wavelengths. We recently found that GA gives a high degree of sensitivity for noninvasive detection of mitochondrial Ca2+ signaling events with high temporal resolution in freely moving transgenic animals. However, these studies indicated limited sensitivity to detect GA in deep tissues such as the heart and brain because light in the blue-green spectrum is strongly absorbed by tissues, such as hemoglobin and bone.10,18,19 This drawback could be overcome by engineering new hybrid molecules, such as fusing aequorin to other red-shifted fluorophores, which can act as acceptors for CRET and produce light emission at longer wavelengths.
The mechanism for energy transfer between donor and acceptor chromophores is likely to be radiationless (resonance energy transfer), involving dipole–dipole interactions similar to fluorescence resonance energy transfer; however, it could also occur by emission absorption and light reemission. Nonradiative transfer owing to dipole–dipole interactions is dependent on several factors, as described by the Förster rate equation, including the degree of spectral overlap, relative orientation, and distance between donor and acceptor dipoles. 20 New red-shifted bioluminescent Ca2+ reporters were therefore constructed by fusing aequorin with the yellow fluorescent protein Venus (VA) 21 and the monomeric red fluorescent protein 1 (mRFP1) (RA). 22 Here we characterized the spectral properties of these new hybrid proteins and found that the luminescence energy resulting from aequorin-catalyzed oxidation of coelenterazine is transferred to each fluorophore with very different levels of efficiency. After evaluating the attenuation of light emission by these probes through different tissues, we find that these new reporters should improve the detection of Ca2+ activities in deeper tissues such as the heart and brain.
Materials and Methods
Hybrid Gene Constructions
As described previously, aequorin has been codon optimized for expression in mammalian cells. 17 VA was constructed by creating a fusion between the GFP variant, yellow fluorescent protein known as Venus, which was kindly provided by Dr. A. Miyawaki, 21 and the aequorin gene. Venus and aequorin are separated by a flexible linker (45 amino acids, as described for gfp-5-aequorin (G5A) previously). 17 The gene sequence of Venus was amplified by polymerase chain reaction (PCR) using oligonucleotides that allowed (1) insertion of a site for NheI before the start of the initiation codon and (2) removal of the stop codon and insertion of a site for EcoRI. The nucleotide sequence of the forward primer was 5′ACACTATAGAATGCTAGCTACTTGTT3′, which contains a NheI site, and the reverse primer was 5′AGAGGCCTTGAATTCGGACTTGTA3′, which contains a site for EcoRI. The PCR fragment containing the gene of Venus was then inserted NheI/EcoRI in place of post-synaptic-density 95 (PSD95) in pPSDGA 23 to give the plasmid Venus-GFP-aequorin (VGA).
The flexible linker (at the end of GFP) plus aequorin were together amplified by PCR from the G5A plasmid 17 using the forward primer 5′GACGAGCTGTACGAATTCGGCG3′, which included a site for EcoRI, and the reverse primer 5′CTGGAACAACACTCAACCCTATCT3′. The resulting PCR fragment linker-aequorin was then digested EcoRI/XhoI and inserted in place of GA in the plasmid VGA, to obtain plasmid Venus-aequorin (pVA). RA was constructed by creating a fusion between the mRFP1 gene from the reef coral Discosoma sp (the pRSET1 vector was kindly provided by Dr. R. Tsien) 22 and the aequorin gene. Similarly to VA, mRFP1 and aequorin are separated by a flexible linker. A phosphorylated linker with the oligonucleotides 5′pCGCGCCGAGGGCCGCCACTCCACCGGCGCCAAAGAATTCACGCGTG and 5′p-CGCGCACGCGTGAATTCTTTGGCGCCGGTGGAGTGGCGGCCCTCGG3′ was introduced at the BssHII single site in RSET1 vector, and mRFP1 was then removed by NheI/EcoRI digestion and inserted in place of the Venus sequence in the NheI/EcoRI sites of the VA plasmid. Both reporter genes were placed under the control of the ubiquitous cytomegalovirus (CMV) promoter, and all sequences were verified by DNA sequencing.
Preparation of Cell Lysates Containing the Hybrid Protein
COS7 (kidney cells, monkey) and neuroblastoma (Neuro2A, mouse) cells were grown in Dulbecco's Modified Eagle's Medium supplemented with 10% (vol/vol) heat-treated fetal calf serum (FCS), 2 mM glutamine, and 50 U/mL of penicillin-streptomycin (Invitrogen, Life Technologies, Cergy-Pontoise, France) at 37°C in a humidified atmosphere containing 5% CO2. Cells were transiently transfected for 24 to 48 hours using the FuGENE 6 transfection reagent (Roche Diagnostics, Meylan, France) at a DNA to FuGENE ratio of 1:2. Following transfection, cells were washed (three times) with phosphate-buffered saline (PBS) and harvested using a cell scraper. The cell suspension was transferred into a reconstitution buffer containing 10 mM mercaptoethanol, 5 mM ethylene glycol-bis(2-aminoethylether)-N,N,N′,N′-tetraacetic acid (EGTA), and 5 μM wild-type coelenterazine (Interchim, Clichy-sur-Seine, France) in PBS at 4°C for 2 hours in the dark. After that, cells were washed and resuspended in a hypo-osmotic buffer containing 20 mM Tris/HCl, 10 mM EGTA, and 5 mM mercaptoethanol in dH20 and a protease inhibitor, ethylenediaminetetraacetic acid (EDTA)-free (Roche Diagnostics). Cell membranes were lysed by three freeze-thaw cycles, followed by passage through a 26-gauge needle. After centrifugation at 13,000g for 1 minute, supernatant containing the activated bioluminescent proteins was collected and stored as aliquots at −20°C until use.
Spectroscopic Characterization of Fusion Proteins
Fluorescence excitation and emission measurements were made using a spectrophotometer (Xenius, SAFAS, Monaco) by mixing cell extracts containing one of the following proteins, GA, VA, and RA, in the presence of 5 mM EDTA with 10 mM CaCl2 into a standard cuvette holder of the “Safas” (Safas S.A. Monaco) spectro-fluorometer. Fluorescence spectra were normalized, and all computations and graphs were made using Excel Microsoft software, except when stated otherwise.
Chemiluminescent measurements were performed using the Shamrock 163i Spectrograph combined with a photon-counting charge-coupled device (CCD) camera (ANDOR Technology, Belfast, Ireland) placed in a dark box. This apparatus is based on a Czerny-Turner optical layout and features a 163 mm focal length, an entrance aperture of f/3.6, and a wavelength resolution of 0.17 nm. Before capture of signals, light passed through a monochromator, allowing the spectral analysis of emitted photons. The acquisition began 5 seconds before injection of 100 mM CaCl2 solution and continued for 30 seconds after injection. The spectra signals observed were analyzed between 300 and 700 nm by using iStar software (ANDOR Technology). From the CRET curves, total photons emitted at wavelengths ≥ 470, ≥ 590, ≥ 600, and ≥ 650 nm were counted for each bioluminescent protein. The important feature of this instrument is that the whole spectrum is acquired simultaneously (without scanning), thus ensuring that there is no change during acquisition.
Characterization of the Fusion Proteins
Kinetic Response Curves
Aliquots of the cell lysate containing the bioluminescent protein were dispensed into wells containing different free Ca2+ concentrations (between 37.5 and 13,500 nM), and the variation of light emission (relative light units) was plotted as a function of time during 20 seconds.
Ca2+ Binding Affinity Curves
One hundred microliters of EGTA-buffered solutions (Molecular Probes, Invitrogen, SARL, Cergy-Pontoise, France) with varying concentrations of free Ca2+ as calculated by the WEBMAXC program (<http://www.stanford.edu/~cpatton/webmaxcE.htm>) 24 were placed in the wells of white opaque 96-well plates. Background luminescence activity was measured for 5 seconds, and then a 10 μL aliquot of cell lysate (containing the active photoprotein) was injected into wells and the light intensity was continuously recorded for 30 seconds (L, rate of light emission, counts/s). At this point, a saturating CaCl2 solution (100 mM) was injected and recording of the light intensity was continued until all of the photoprotein had been consumed and light levels had returned to baseline (Lmax). Light emission obtained for each reporter (VA, RA, and GA) was then expressed as the fractional rate of photoprotein consumption (L/Lmax) as described previously. 25 For concentrations below 1,100 nM, the value for L was taken at 5 seconds after injection, at the point where the mixed sample is equilibrated. For samples above 1,100 nM, L was taken at the peak of the light intensity. In all cases, Lmax was calculated as the total amount of aequorin light that can be emitted by the sample after discharging all of the available aequorin from and including the time point where L was taken.
Stability
To assay the stability of the different probes over time, 10 μL of cell lysate containing one of the different probes was placed into 60 wells of a white opaque 96-well plate. Then the light emission from the different wells was triggered every 15 minutes by the addition of 100 μL of 100 mM CaCl2. Luminescence was recorded over 15 hours.
pH Sensitivity
The pH stability of VA, RA, GA, and aequorin was analyzed with prepared Good's buffers, including 2-(N-morpholino)ethanesulfonic acid (MES) (pH 5.5–6.8) and 3-N-(morpholino)propanesulfonic acid (MOPS) (6.5–8.0). Five-microliter aliquots of cell lysate containing the bioluminescent protein were placed into the wells of white opaque 96-well plates, and 245 μL of different pH buffers was added. Ten microliters of 260 mM CaCl2 (10 mM final Ca2+ concentration) was then injected into each well, and luminescence was recorded for 120 seconds. All experiments were carried out using the luminometer Multilabel Reader Mithras LB940 (Berthold Technologies, Pforzheim, Germany) at room temperature (25°C). Each experiment was repeated at least four times, and the results are given as a mean ± standard error of measurement (SEM).
Ca2+-Induced Bioluminescence
The spectral properties of light emitted by each hybrid bioluminescent protein were evaluated with different filters in a whole-animal imaging system (IVIS 100, Xenogen Corp., Hopkinton, MA, USA). Ca2+-induced light emission of GA, VA, and RA was measured as follows: an EGTA-buffered solution containing 866 nM free Ca2+ concentration (a [Ca2+] ensuring a constant light intensity) and the hybrid protein reconstituted with coelenterazine was prepared and aliquoted in equal amounts into five different wells of a 96-well plate. Different filters selecting for varying light emission wavelengths (bandpass [BP] 470–490 nm, BP 500–520 nm, BP 520–540 nm, and long-pass [LP] 590 nm) were each placed over a well containing the Ca2+-activated photoprotein mixture. For calibration of the total light emission, one of the wells was quantified in the absence of a filter. The light emission detected from each well was integrated for 120 seconds. At the end of acquisition, a large region of interest was drawn over the area of light emission and the relative total photon transmission was calculated as follows: % total photon transmission = [total photon flux (with filter)/total photon flux (without filter) × 100], where light was quantified as photons/s using the Living Image software (Xenogen) as an overlay on Igor image analysis software (Wavemetrics Incorporation, Portland, OR). Each experiment was repeated at least four times.
The level of Ca2+-induced bioluminescence from each probe, which could be detected through different tissues, was evaluated. To evaluate the tissue transmission properties of the light emitted by the three probes, solutions containing the bioluminescent proteins and free Ca2+ concentration (as described above) were placed at different tissue sites within 10-week-old Swiss mice (Charles River Laboratories, France) that had been killed by CO2 inhalation. Equal aliquots of the photoprotein solutions were placed into two 50 μL transparent plastic tubes. One tube was placed into one of the following regions of the body: (1) subcutaneous, underneath the skin on the ventral side of the animal; (2) subthoracic, underneath the thoracic cage in the area of the heart; or (3) subcranial, directly underneath the skull in the area of the brain; the second tube was placed directly outside the animal's body. Total light emission (photons/sec/cm2/sr) was integrated during 300 seconds using the whole-animal BLI system from Xenogen (IVIS 100 with Spectral CCD camera, Xenogen). Light emission detected from negative controls containing cell lysates but no hybrid protein was also determined. In all experiments, the total amount of photoprotein activity emitted by cell lysates containing the different fusion proteins was adjusted to equal amounts to directly compare the three hybrid proteins. These values were further normalized by calculating the ratio of the light emitted from within the intact animal over the total light emitted from the tube placed externally to the body after subtraction of the background light (negative controls). For experiments investigating subcutaneous and subthoracic activities, the amount of photoprotein activity present in each tube was the same but ranged from 2.5 × 10⁶ and 1.5 × 10⁸ photons/s/cm2/sr on different experimental days. For the final experiments undertaken in the brain, the amounts of photoprotein activity in each tube were always adjusted to 2.5 × 10⁶ photons/s/cm2/sr.
Results
At the beginning of these studies, we examined the excitation and emission spectra for several existing fluorophores and decided to introduce yellow fluorescent protein and mRFP1 in place of GFP for the development of new constructs with different spectral properties (Figure 1).
Fluorescence and Luminescence Properties of the Hybrid Proteins
Analysis by spectrofluorometry of the hybrid proteins indicates that the excitation and emission spectra of GA, VA, and RA (Figure 2) correspond to GFP, Venus, and mRFP1, respectively.21,22 The excitation/emission maxima for each of the hybrid proteins was 488/509 nm (Figure 2A), 516/528 nm (Figure 2B), and 578/607 nm (Figure 2C), for GA, VA, and RA, respectively. Thus, the spectral properties of each fluorescent protein are not modified when they are expressed as N-terminal fusion proteins to aequorin.21,22 As expected for a nontargeted reporter, expression of the hybrid proteins GA, VA, and RA in COS7 cells, Neuro2A cells, and hippocampal neurons was found to be relatively diffuse in the cell cytoplasm and nucleus, without evidence of protein aggregation or cellular toxicity (data not shown).

Schematic representation of the different hybrid genes corresponding to the different photoproteins. Each construct was under the control of the cytomegalovirus (CMV) promoter. Color coding in this figure also applies to the other figures. GFP = green fluorescent protein; mRFP1 = monomeric red fluorescent protein 1; RFP = red fluorescent protein.
When aequorin (apoaequorin + coelenterazine) binds Ca2+, it becomes “consumed” in the course of its light-emitting reaction and decomposes into apoaequorin, coelenteramide, and CO2. Apoaequorin can be converted into its original aequorin in the absence of Ca2+ providing that there is available coelenterazine and O2, but the reaction is very slow. The rate of the bioluminescence reaction is a function of the calcium concentration.26,27 In saturating conditions, the rate constant for aequorin consumption is 1 s−1. Accordingly, the rate of the light reaction (and its consumption) of each photoprotein increases with the [Ca2+] (37.5–13,500 nM) (Figure 3A). However, at [Ca2+] from 37.5 to 866 nM, the reaction rate is extremely slow and light emission remains relatively constant. Solutions of activated photoprotein were therefore prepared with a free [Ca2+] of 866 nM, where the intensity of the light emission is highest but relatively constant, to assess the level of light transmission through different filters and animal tissues, without decay of the light intensity. The Ca2+-binding affinities of VA and RA were also determined (Figure 3B) and are similar to GA 23 and those reported for aequorin (Kd = 10 μM).25,27,28 These fusion proteins can therefore be applied in studies for measuring Ca2+ concentrations over a wide physiologic range (from 0.3 to 10 μM), and this range can be further extended using a mutant version of aequorin or different analogues of coelenterazine. 23 This also suggests that fusing aequorin to the C-terminus of different fluorescent proteins, such as GFP, Venus, and mRFP1, does not interfere with the Ca2+-induced intramolecular reaction of aequorin, which oxidizes the bound coelenterazine.
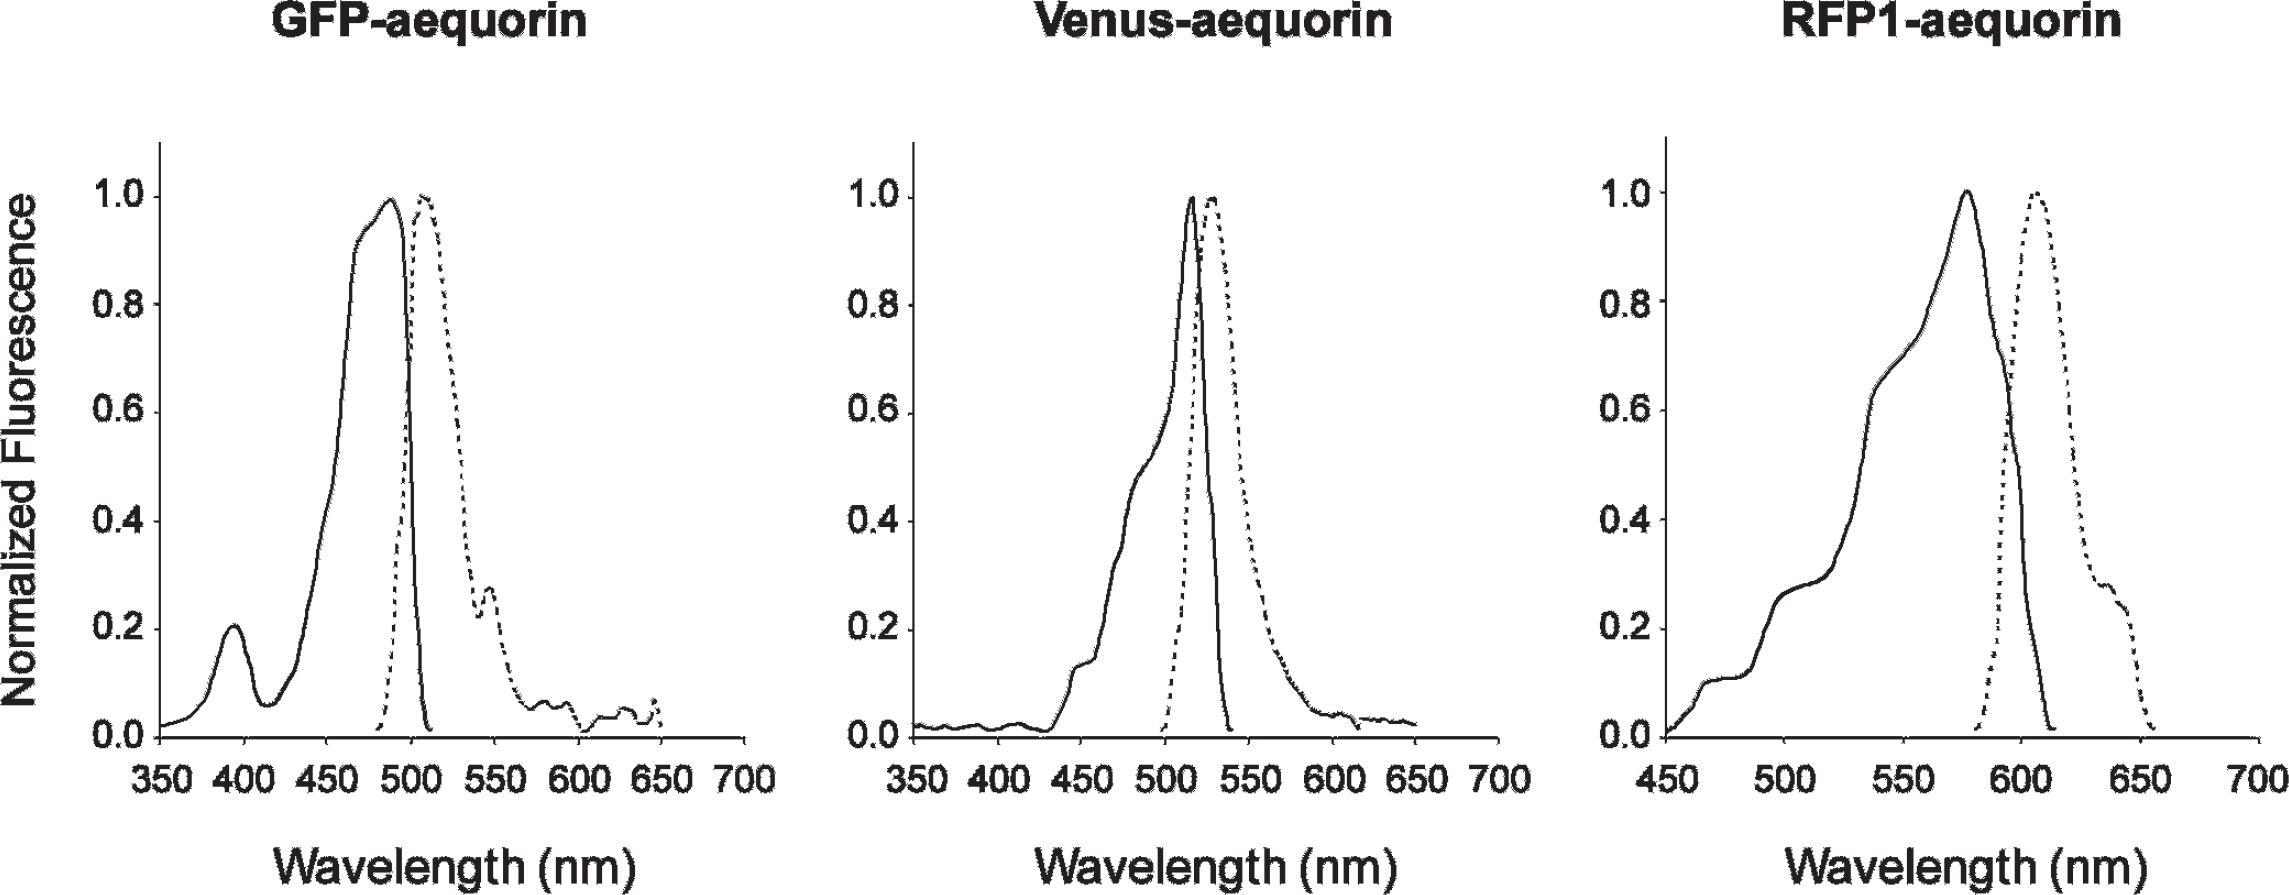
Fluorescence excitation and emission spectra of the different fluorescent hybrid proteins when expressed in Cos7 cells. The excitation spectrum is shown with a solid line, and the emission spectrum is shown with a dotted line.
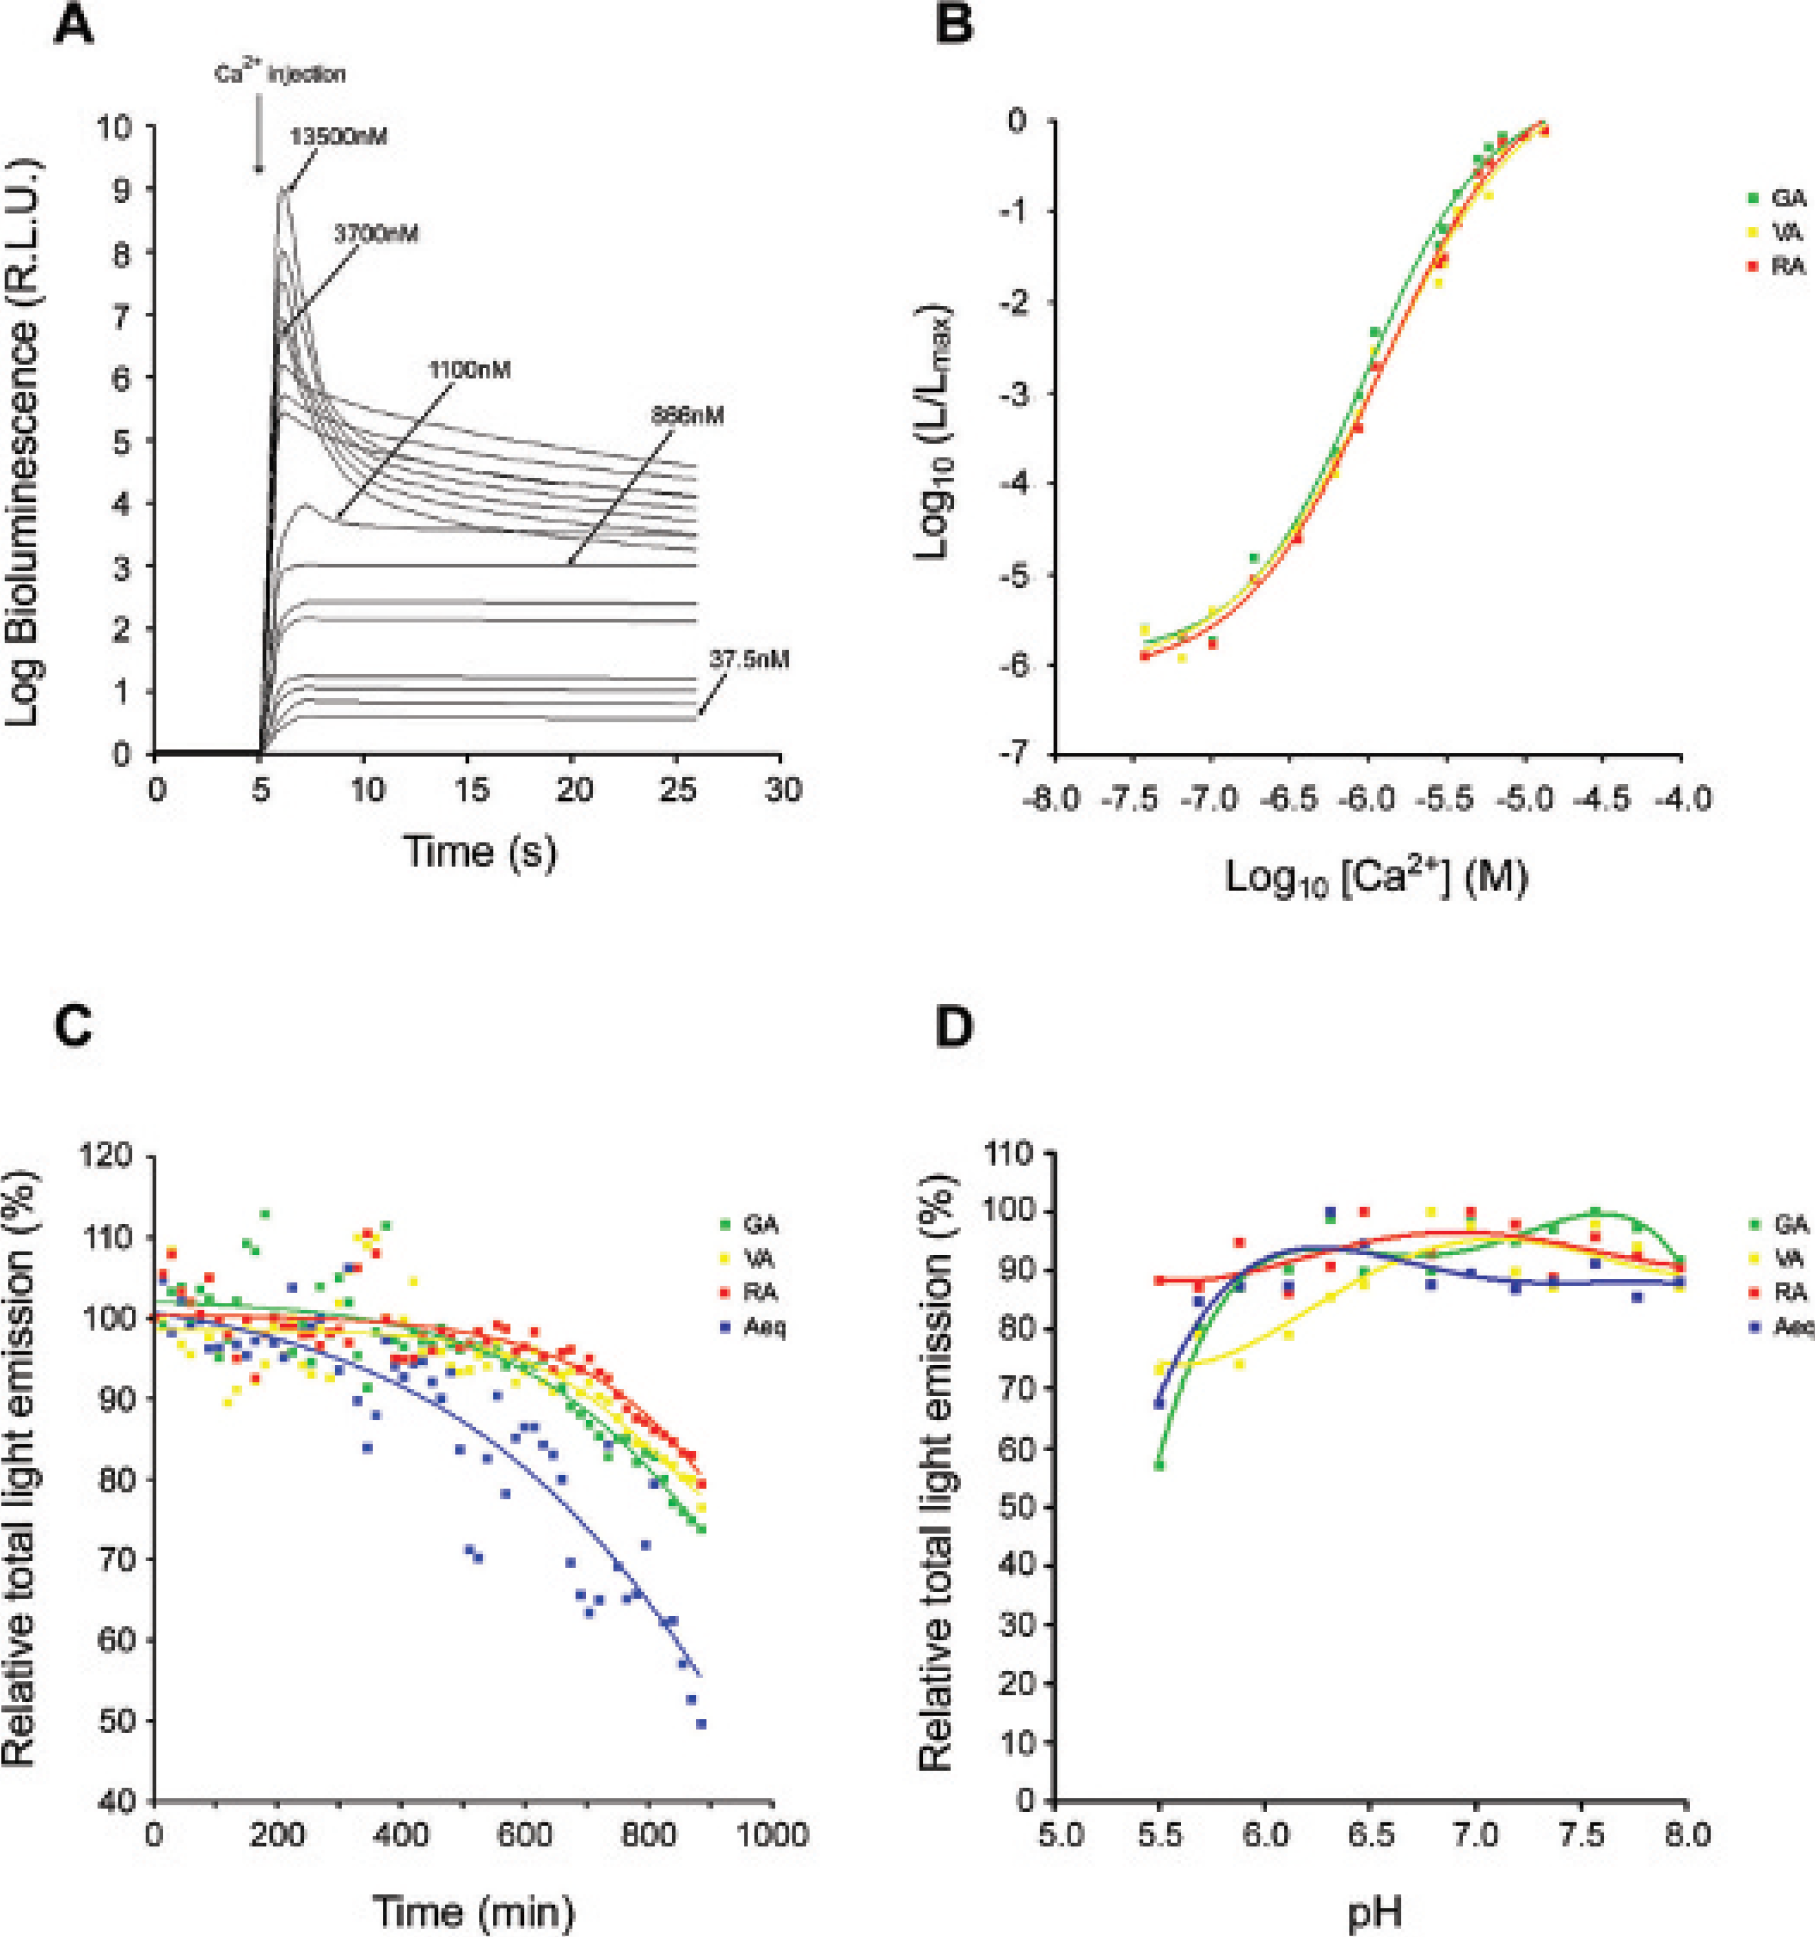
Characteristics of the chimeric photoproteins. A, Kinetic response of monomeric red fluorescent protein 1 (mRFP1)-aequorin hybrid reconstituted photoprotein in the presence of different free [Ca2+]. Values are given as a logarithmic of the total photons recorded. B, [Ca2+] response curve for each hybrid protein reconstituted with the wild-type version of coelenterazine, determined at pH 7.2 and 25°C (r2 = .99, n = 3). C, Stability of reconstituted cytosolic hybrid photoproteins over time, at room temperature. Each point represents the total light produced by the different proteins on the addition of 100 mM CaCl2 solution as a function of time. The results were fitted by a Boltzman's distribution using GraphPad Prism4 software (San Diego, CA). Values are given as the percentage of total photons remaining compared with time zero and are the mean ± standard error of measurement (SEM) (n = 4 for each photoprotein). D, pH titration of the light intensity in the presence of 10 mM CaCl2. The values are relative to the total amount of light emitted for each photoprotein and have been fitted to a fourth-order polynomial curve. B–D, Green line = green fluorescent protein–aequorin (GA); yellow line = Venus-aequorin (VA); red line = mRFP1-aequorin (RA); and blue line = aequorin (Aeq).
Recombinant apoaequorin is reported to be unstable in the cytosol and has a half-life of approximately 20 minutes. 29 In line with previous data, 17 our results show that cells expressing the fusion proteins have a better Ca2+-triggered bioluminescent activity than those expressing aequorin alone (Table 1). In accordance with results from other studies, this may be related in part to an increased stability of apoaequorin when it is expressed as a fusion protein rather than alone.17,29 We therefore investigated the stability of light emission from GA, VA, RA, and aequorin in cellular extracts over time (Figure 3C). Indeed, after 15 hours of incubation at room temperature, stability was found to be higher for the hybrid proteins, which had reduced luminescence activities of 20 to 25% compared with 50% for aequorin. Our studies were undertaken in the presence of protease inhibitors, which would explain the greater stability of aequorin in our conditions compared with those reported previously. 29 Finally, the Ca2+-induced bioluminescent reaction of aequorin is not influenced by pH in the physiologic range. Similarly, GA, VA, and RA are also relatively insensitive to pH in the physiologic range (6.5–7.5) (Figure 3D).
Spectral Characterization and Protein–Protein Energy Transfer
In the presence of Ca2+ ions and coelenterazine, a nonradiative energy transfer between the excited oxyluciferin and a chromophore will depend on the donor lifetime, the distance between the donor and acceptor dipoles, the relative orientation of dipoles, and the degree of emission/excitation spectral overlap. 20 Emission spectra of the different chimeras were analyzed using a highly sensitive spectroscopic detector, which provides high wavelength accuracy, with a resolution of 0.17 nm (Figure 4). The new fusion proteins were compared with aequorin and GA (formerly G5A). 17 The emission spectrum of aequorin shows a broad peak with a λ max of 469 nm. At 50% of that maximum light emission of aequorin, the peak has a bandwidth of approximately 115 nm. In contrast, the peak emission wavelength of GA occurs in the green, which corresponds to the fluorescence emission for GFP (λmax= 509 nm), with a small shoulder corresponding to the peak emission of aequorin. At 50% of the maximum light emission of GA, the peak has a narrow bandwidth of approximately 40 nm, similar to previously reported values. 17
Ca2+-Induced Chemiluminescence Activities

RLU = relative light unit.
Results indicate the mean ± standard error of measurement.
The bioluminescent spectra for VA has an emission maximum that is shifted to yellow, indicating that the Ca2+-induced chemiluminescent reaction produces light emission coming from the “fluorescent” protein Venus (λ = 528 nm). Similarly to GA, at 50% of the maximum light emission, the peak has a narrow bandwidth of 43 nm. In contrast, the spectrum of the Ca2+-induced bioluminescence of RA largely corresponded to that of aequorin, with a slightly narrower bandwidth (95 nm). However, the luminescence emission curve of RA appeared to be asymmetric and higher in intensity compared with aequorin, with a small peak in the red corresponding to the emission maximum of mRFP1 (λmax = 607 nm). According to the CRET spectra, RA emits 10% of its light at wavelengths greater than 600 nm, which is twofold higher in comparison with VA. At higher wavelengths, the difference of emission between RA and VA is even greater, demonstrating that RA emits light in the far-red spectrum (≥ 650 nm). In the case of the RA hybrid, one can speculate that most of the light intensity is emitted directly by aequorin. However, a small amount of energy transfer does occur (, 10%) by a radiative or nonradiative process, resulting in emission above 600 nm, corresponding to emission by red fluorescent protein.

[Ca2+] chemiluminiscence resonance energy transfer (CRET) activities on cellular extracts corresponding to green fluorescent protein–aequorin (green line), Venus-aequorin (yellow line), monomeric red fluorescent protein 1–aequorin (RA) (red line), and aequorin (blue line). CRET emission spectra of aequorin and the hybrid photoproteins were analyzed from 350 to 750 nm over 20 seconds at an acquisition rate of 2 Hz and calibrated as a percentage of total light. Notice that RA also emits signals at wavelengths around 600 nm.
Distribution of Light Emitted by Each Photoprotein in Broad Regions of the Light Spectrum

CRET = chemiluminescence resonance energy transfer; GFP = green fluorescent protein; mRFP1 = monomeric red fluorescent protein 1; NA = not assayed.
The efficiency of energy transfer between the aequorin donor and acceptor fluorophore was determined for each reporter by calculating the ratio of light intensities at the λ max of the acceptor emission (IA) to that of the donor, aequorin moiety (ID) (Table 2). 30 The calculated ratio for GA was found to be 5.5, as previously reported.17,30 The ratios calculated for VA and RA were 5 and 0.25, respectively. The high CRET efficiency observed for GA and VA may be relevant to the high degree of spectral overlap between aequorin light emission and the fluorescence excitation curves for the two fluorophores (see Figure 2). However, it may also be important that aequorin and GFP are from the same organism and Venus is a mutant form of GFP. In contrast, mRFP1 is derived from the Discosoma coral, which may be important if a structural mechanism plays a role in facilitating optimal energy transfer. Energy transfer also involves dynamic parameters and overall stability of hybrid protein.
Further studies were undertaken using a whole-animal BLI system to determine the transmission of light through different short bandpass (BP) and long-pass (LP) filters. Again, for these experiments, the [Ca2+] was maintained at 866 nM because at this concentration, the decay of bioluminescent protein activity is minimal and the light signal stays relatively constant over time. The results showed that maximum photon emission for GA, VA, and RA was detected through 500/20 nm, 520/30 nm, and 470/20 nm filters, respectively (Figure 5 and Table 3), confirming the spectroscopy data discussed above. Importantly, these studies confirmed our calculations from the CRET spectra that 14% of RA light emission occurs in the red spectrum (≥ 590 nm), which suggests that a small degree of energy transfer does take place.

Light intensity emitted from each photoprotein in the presence of 866 nM free Ca2+ as recorded through selected bandpass or long-pass filters using the Xenogen IVIS system. The grayscale video image is superimposed with the color-coded bioluminescent images showing the transmission of light from each photoprotein through different bandpass (BP) and long-pass (LP) filters. GA = green fluorescent protein–aequorin; RA = monomeric red fluorescent protein 1–aequorin; VA = Venus-aequorin.
Bandpass Distribution of Light Emitted by Each Photoprotein

BP = bandpass filter; GFP = green fluorescent protein; LP = long-pass filter; mRFP1 = monomeric red fluorescent protein 1.
Efficiency of Light Transmission through Animal Tissues
Previous studies showed that transmission of light emitted in the blue-green spectrum (475–515 nm) is significantly attenuated in tissue because it is largely absorbed by components such as hemoglobin. Alternatively, light above 600 nm provides a higher level of transmission efficiency through mammalian tissues. 19 We therefore evaluated the capacity to detect light emission from GA, VA, and RA through different tissues, either underneath (1) the skin (subcutaneous), (2) the thoracic cage (subthoracic), or (3) the skull (subcranial). In these experiments, two tubes were prepared containing equal amounts of photoprotein activity (see Materials and Methods). One of these tubes was placed inside the animal at one of the three locations, and the second tube was placed next to the animal so that the total light output from the tube placed externally to the body could be quantified and normalized against the levels detected from within the whole animal. This allowed the absorption owing to different tissues to be assessed. Before each experiment, the amount of cell lysate added to each tube containing the different fusion proteins was also adjusted so that tubes had close to equal quantities of photoprotein activity.
Light emission from the three reporters was readily detected externally with high efficiency when tubes were placed subcutaneously (see Table 3 and Figure 6). However, GA light emission was mostly attenuated by the skin (59.87%) compared with RA (29.47%) and VA (19.71%) (see Figure 6 and Table 4). Among the three chimeric proteins, the spectral characteristics of VA light emission therefore provided the greatest efficiency to cross tissue over the subcutaneous region. In contrast, light emission from all three reporters was largely attenuated when emitted from deeper tissue sites such as underneath the thoracic cage. From the subthoracic region, a large amount of GA light emission was again attenuated (> 98%), whereas light emission from RA and VA was three- to fourfold higher than GA. These studies showed that VA and RA could be detected with relatively similar capacity.

Superimposed visible light and color-coded bioluminescent images of mice in which a “small” tube containing 50 μL of photoprotein in 866 nM Ca2+-buffered solution has been placed subcutaneously (top row) or subthoracically (bottom row). Bioluminescent signals have been acquired over 5 minutes. All photoproteins have been calibrated to the same signal intensity before whole-animal imaging and to a reference tube located laterally. Bioluminescence color coding as in Figure 5.
Relative Transmission of Photoprotein Emitted Light across Mouse Tissues

GFP = green fluorescent protein; mRFP1 = monomeric red fluorescent protein 1.
Most of the light emission from GA and VA was attenuated by tissues when tubes containing the activated photoproteins were placed subcranially (see Table 4 and Figure 7). Whereas VA and RA had similar capacities to cross tissue from the subthoracic region (5.72 compared with 4.86%), the level of VA light emission was significantly attenuated compared with RA from the subcranial regions (99.98 compared with 95.4%) (see Figure 7 and Table 4). Interestingly, the efficiency for RA light emission to pass through tissues covering the subthoracic and subcranial regions was relatively the same (4.9 compared with 4.6%). Importantly, RA light emission could be readily detected through the mouse skull. Furthermore, when the light emission was detected through a filter, it was found to be predominantly from wavelengths greater than 600 nm (Figure 7). These studies confirm the importance of selecting reporters with optimal spectral characteristics and light intensities, relevant to different tissues, when preparing new applications for in vivo imaging.
Discussion
The bioluminescent Ca2+ reporter GA has improved light emission properties and greater stability compared with aequorin alone.17,23,30 The reporter is also bifunctional, whereby expression patterns can be visualized by GFP fluorescence and Ca2+ activities can be monitored by changes in bioluminescence. We recently accomplished a major objective by showing for the first time that GA can be used to monitor, noninvasively, Ca2+ signaling in real time, within the intact animal during motion. However, the transmission of blue/green light through tissues is known to be strongly attenuated owing to light scattering and absorption, largely by hemoglobin.10,18,19 As a consequence, the bioluminescence of GA when expressed in transgenic animals is mostly detected from superficial tissue sites and there is a general lack of sensitivity in deeper tissues, such as the heart and brain.

Superimposed video and color-coded bioluminescent images of mice in which a “small” tube containing 50 mL of photoprotein in 866 nM Ca2+-buffered solution has been placed subcranially. Bioluminescent signals have been acquired over 5 minutes. All photoproteins have been calibrated for the same signal intensity before whole-animal imaging. Monomeric red fluorescent protein 1–aequorin (RA) + filter has a bandpass = 610–630 nm wavelength. Bioluminescence color coding as in Figure 5. GA = green fluorescent protein–aequorin; VA = Venus-aequorin.
Similar to GA,17,23 the newly constructed VA and RA hybrid proteins are bifunctional reporters, whereby expression patterns can be monitored by the fluorescent partner, whereas Ca2+ activities can be measured by Ca2+-induced bioluminescence. Our studies show that the individual fluorescent excitation and emission spectra of GA, VA, and RA are corresponding to their individual fluorescent counterparts, showing that such C-terminal fusions do not affect their fluorescent properties. Similarly, fusion of the fluorescent protein to the N-terminus of aequorin does not affect the Ca2+-induced light emission of the enzymatic reaction or its Ca2+-binding affinity, which enables measurements over a broad Ca2+ concentration range (0.3 to > 10 μM). In applications in which larger Ca2+ concentrations are expected to be monitored, it will be necessary to use fusion proteins containing a mutant version of aequorin, which has a lowered Ca2+-binding affinity for measurements of [Ca2+]. 23 This is particularly important for measurements of Ca2+ in subcompartments such as the endoplasmic reticulum, in which [Ca2+] can be very high. It should also be noted that engineering was made only at the N-terminus of aequorin because previous studies indicate that fusions to the C-terminus of aequorin can dramatically reduce the luminescence activities of the photoprotein. 31 In previous studies, Gorokhovatsky and colleagues also reported a Ca2+-induced change in the absorption and fluorescence excitation spectrum of the GFP-19-aequorin fusion. 30 We did not observe similar spectral changes; however, this may be because they used the wild-type version of GFP (our studies incorporate a mutant version of enhanced green fluorescent protein (EGFP)), 17 or it could be relevant to the length of the linker peptide (45 amino acids versus 19). The three hybrid proteins are also relatively insensitive to pH in the physiologic range (between 6.5 and 7.8), allowing their use in many in vitro, ex vivo, and in vivo contexts.
These studies show that like for GA, the Ca2+-induced chemiluminescence of VA is the result of a highly efficient intramolecular energy transfer from the donor moiety of aequorin to the fluorescent acceptor Venus. In contrast, RA emits most of its light in the blue spectrum, which probably comes from aequorin light emission, whereas only a small degree of nonradiative or radiative energy transfer is likely to contribute to the far-red emission. Moreover, RA was the only bioluminescent reporter able to emit light in the far-red spectrum (≥ 650 nm). The low efficiency of energy transfer detected between aequorin and mRFP1 is probably related to the small spectral overlap between the emission spectra of aequorin and the excitation spectra of mRFP1. In addition, the structural conformation and dynamics of the RA molecule may shorten the interchromophore distance for energy transfer and/or be modulated by internal vibrational motion that allows CRET in small amounts to be produced in the red and far-red range.32,33
Our results showed that the luminescence emitted from the three hybrid proteins was able to be efficiently detected when emitted from subcutaneous regions. Corresponding to what is known for the spectral properties of tissues, GA emission is highly attenuated from subthoracic regions, whereas VA and RA had spectral properties that significantly improved the transmission of Ca2+-induced light emission through animal tissues, particularly from deeper regions, such as underneath the thoracic cage. Given the spectral characteristics of VA, this reporter should be most suitable for use in applications requiring the detection of light from subcutaneous areas or from the thoracic cavity. Although more extensive studies on other tissue regions were not undertaken, the highly efficient energy transfer and spectral properties of VA infer that this reporter would also be appropriate for studies on liver function. In contrast, VA light emission is highly attenuated when passing through the skull, whereas the transmission of RA is more efficient. Other studies have reported that photons transmitted through hard bone tissue are far-red-shifted, and we found that most of the light detected from RA when placed underneath the skull is from the far-red spectrum (≥ 610 nm).19,34 Our recent studies showed that it is possible to detect Ca2+ concentration increases in the brain of young transgenic mice (< 10 days postnatal) expressing GA when the skull is still relatively thin. However, activity in the brain was difficult with this probe. Noninvasive procedures, such as imaging of the intact brain of mice in living animals, including adults, could therefore be more easily investigated with transgenic mice expressing RA.
Other studies have produced red-shifted versions of the luciferase reporters (ie, Renilla and firefly) and evaluated their transmission properties through animal tissue by the injection of transfected cells expressing these bioluminescent probes in the mouse liver and lungs.11,19 These studies are feasible because there is always a sufficient level of O2 or adenosine triphosphate present in cells to facilitate light emission. Similar experimental paradigms with the aequorin system would be difficult because the light reaction occurs only when there is a transient increase in the Ca2+ concentration over and above basal levels of Ca2+ (> 300 nm). More physiologic studies will therefore require the generation of transgenic mice expressing such reporters, characterized in this current study.
This technology can be improved by a systematic analysis of the chemical physics of transfer in such hybrid molecules. For example, fusions between aequorin and some of the newly reported red fluorescent proteins, such as mStrawberry and mCherry molecules, are likely to give even better results than RA because of the larger overlap between aequorin emission/fluorescent excitation and their higher quantum yields and extinction coefficients.35,36 The efficiency of light emission can also vary according to the type of coelenterazine analogue used. In our studies here, we have used only the native version of coelenterazine. However, other coelenterazine analogues reconstituted in combination with RA may improve CRET, such as v-coelenterazine, which has an emission maximum at 512 nm. 37 In this case, other properties would need to be considered, such as stability and pharmacokinetic studies described for different substrates in whole animals. 38 An interesting alternative would be to construct a three-way fusion protein, consisting of mRFP1-Venus and aequorin, for maximum CRET efficiency, to improve the efficiency of energy transfer and amount of light produced in the far-red spectrum. 39 An additional application with these different colored reporters could be to simultaneously monitor Ca2+ dynamics in different subcellular compartments or cell types.
Finally, the new VA and RA reporters can potentially provide an opportunity to undertake noninvasive whole-animal imaging of heart and brain activity, respectively. We find VA to be a more appropriate probe for studies of Ca2+ activity in superficial tissues such as the skin, muscles, or heart. Alternatively, RA should be the best probe for imaging of cerebral activity, which will open the field of optical imaging during a learning paradigm. Since light emission in the blue-green spectrum has a reduced capacity for tissue penetration, GA is not well adapted for whole-animal deep tissue imaging. These new hybrid bioluminescent reporters can be used as genetically targeted Ca2+ sensors to specific cellular and/or subcellular domains to simultaneously study Ca2+ dynamics in a noninvasive manner in medical, pharmaceutical, and environmental applications.
Footnotes
Acknowledgments
We are very grateful to Jacques Stinnakre for his helpful advice regarding experiments and for critical reading of the manuscript. We thank ANDOR Technology, in particular Ciaran McCanan and Severine Dubroecq, for providing the Shamrock spectroscopic instrumentation and for assisting with spectral measurements. We also thank Spencer Shorte, Pascal Roux, and Marie-Anne Nicola from the Plateforme d'imagerie dynamique of the Pasteur Institute for helpful advice and assistance with confocal microscopy and whole-animal bioluminescence studies.