
Abstract
Imaging apoptotic cells or tissues after cancer therapy in situ would be a very useful tool for assessing proper treatment conditions and therapeutic outcome. By combining therapeutic and imaging functions, we have designed a multifunctional, membrane-permeable, and cancer-specific agent that triggers and images apoptosis in targeted cells. We chose photodynamic therapy (PDT) as an appropriate cancer treatment modality and caspase 3 as an apoptosis-specific imaging target. This targeted photodynamic therapy agent with a built-in apoptosis sensor (TaBIAS) induces photodamage only to target cells and simultaneously identifies those that are apoptotic by its near-infrared fluorescence. It contains a fluorescent photosensitizer used as an anticancer drug and a cancer-associated folate receptor homing molecule connected to a caspase 3 cleavable peptide linker that has a fluorescence quencher on the opposing site. We demonstrated that PDT-triggered cleavage of the peptide linker by caspase 3, one of the key executioner caspases, results in a detectable increase in fluorescence in folate receptor–overexpressing cancer cells and tumors. The presence of apoptosis was confirmed in vitro by flow cytometry and ex vivo by Apoptag assay, supporting the ability of TaBIAS to specifically induce and image apoptosis in situ.
APOPTOSIS is a natural process for eliminating unwanted cells in a healthy organism, but failure to induce apoptosis in abnormal cells leads to severe diseases, including cancer. 1 Naturally, many drugs target this malfunction by restoring programmed cell death. 2 Imaging apoptosis in situ 3 would, therefore, be crucial for understanding both physiologic or pathologic cases of excessive apoptosis and would also help to locate the affected site and assess the therapeutic outcome of apoptosis-inducing drugs in vivo.
One of the promising cancer treatment modalities is photodynamic therapy (PDT). 4 It uses a light-activated photosensitizer for the production of reactive singlet oxygen species 5 that damage the cellular targets within a short range from the photosensitizer's site of accumulation. The therapeutic outcome of PDT depends not only on all three actors involved—light, the photosensitizer, and molecular oxygen availability—but also on the tumor and tissue type. 6 Given that PDT-induced cell death via apoptosis is a desirable end point, developing a bifunctional PDT agent that triggers and images apoptosis in situ would be an important advance.
Here we introduce a targeted photodynamic therapy agent with a built-in apoptosis sensor (TaBIAS) that is designed to detect PDT-induced apoptosis triggered only in targeted cancer cells using real-time near-infrared (NIR) fluorescence imaging and thus to serve as the earliest self-evaluation of its therapeutic outcome in vivo. Our prototype construct, folate receptor targeted TaBIAS, consists of four components (Figure 1): (1) a photosensitizer that was shown to localize near mitochondria (pyropheophorbide a), 7 (2) a fluorescence quencher that effectively quenches the photosensitizer's fluorescence Black Hole Quencher-3 (BHQ-3), (3) a caspase 3 cleavable sequence (KGDEVDGSGK)8,9 with a photosensitizer and a quencher attached at opposing ends, and (4) a tumor-homing molecule folate (F) for in vivo specificity, targeting cells that overexpress folate receptor (FR). 10 This construct enters cells via a folate delivery pathway, and when activated by light, the photosensitizer produces singlet oxygen that damages mitochondria, 11 causing apoptosis. 12 This consequently leads to activation of caspase 3, 13 indicating the irreversible point in apoptotic death. Activated caspase 3 promptly cleaves the peptide linker between the photosensitizer and the quencher, restoring the photosensitizer's intrinsic fluorescence and indicating those cells dying by apoptosis. Therefore, TaBIAS induces apoptosis and visualizes it using its own NIR fluorescence.

Structure and function of a targeted photodynamic therapy agent with a built-in apoptosis sensor (TaBIAS). TaBIAS consists of four parts: the fluorescent photosensitizer (pyro [PS]), caspase 3 cleavable sequence (KGDEVDGSGK), fluorescence quencher (BHQ-3 [Q]), and delivery vehicle (folate [F]) (1). This molecule accumulates preferentially in cells overexpressing folate receptor, and once activated by light, the photosensitizer produces reactive singlet oxygen that destroys the mitochondrial membrane and triggers apoptosis (2). This leads to activation of caspase 3, which cleaves the peptide linker between the PS and the Q, thus restoring the PS's fluorescence and identifying those cells dying by apoptosis by NIR fluorescence imaging (3).
In a previous study, we designed a nontargeted photodynamic therapy agent with a built-in apoptosis sensor (PDT-BIAS) and demonstrated that this construct is indeed an effective PDT agent and that cleavage of the peptide linker by caspase 3 results in a detectable increase in fluorescence in solution and in cancer cells after PDT treatment (data to be published elsewhere). We therefore confirmed at the cellular level that imaging of tumor cell apoptosis that is triggered by its photosensitization in situ is indeed feasible. However, since PDT-BIAS is nontargeted, it would be a significant challenge to prove this new concept in vivo using intravenous injection and thus enable practical use. Here we report the first targeted PDT-BIAS (TaBIAS) with the ultimate goal of providing a clinically useful strategy for enhancing the specificity and efficacy of PDT in cancer treatment.
We have synthesized TaBIAS and shown that it is cleaved by caspase 3 in solution, in cells, and in animals. We have confirmed that TaBIAS selectively discriminates between KB cells (overexpressing folate receptor) and HT 1080 cells (lacking folate receptor expression) both in vitro and in vivo. We have also shown that TaBIAS is specifically cleaved by caspase 3 in solution and as a consequence of PDT-triggered apoptosis in cells and animals. The folate receptor–overexpressing KB cells treated with TaBIAS and light display (1) a greater increase in fluorescence from TaBIAS cleavage compared with both the HT 1080 cells under the same conditions (owing to lower accumulation of TaBIAS in HT 1080 cells) and the KB cells treated only with TaBIAS (apoptosis was not triggered without light treatment), (2) shrunken or hypergranular apoptotic morphology monitored by flow cytometry, and (3) decreasing viability with increasing light and drug dose monitored by 3-(4,5-dimethylthiazol-2-YL)_2,5-diphenyltetrazolium bromide (MTT) assay.
Using a double-tumor mouse bearing both a folate receptor–positive (KB; FR+) and a folate receptor–negative (HT 1080; FR–) tumor, we have shown that TaBIAS discriminates between these two tumors, induces apoptosis, and images activated caspase 3 as a marker of this cell death in situ. We proved that the folate receptor–overexpressing KB tumor that was treated with both TaBIAS and PDT is highly apoptotic by ex vivo staining of the dissected tumors with Apoptag assay, an accepted apoptosis-detecting method. Therefore, by detecting both fluorescence from cleaved TaBIAS and apoptosis in vitro, in vivo, and ex vivo, we have demonstrated that the photodamage induced by TaBIAS-based PDT causes apoptosis and can be consequently visualized using the same molecule by tracking the NIR fluorescence signal by in situ imaging.
Materials and Methods
The final compound 6 (and intermediates 3, 4, and 5 for obtaining matrix-assisted laser desorption–ionization time of flight mass spectrometry [MALDI-ToF]) was purified by high-performance liquid chromatography (HPLC) (Waters 600 controller with a 2996 photodiode array detector, Waters Corporation, Milford, CT). The eluents were A = 0.1 M TEAA (triethyl amine + acetic acid) (pH 7) and B = acetonitrile, and the method used for all injections was 90% of A and 10% of B to 100% of B in 45 minutes with flow 1.5 mL/min on column Zorbax 300SB-C3 (Agilent, West Chester, PA). The coupling reagents 1-hydroxybenzotriazole (HOBt) and O-(benzotriazol-1-yl)-N,N,N′,N″-tetramethyluronium hexafluorophosphate (HBTU) were purchased from ACROS and Fluka, respectively. MALDI-ToF was obtained from an Applied Biosystems (Foster City, CA) Voyager DE Mass Spectrometer, and fluorescence was measured on a Perkin Elmer (Fremont, CA) LS50B Luminescence Spectrometer. We acquired confocal images using a Leica (Exton, PA) TCS SP2 Confocal Microscope and Xenogen images at the Bioluminescence Molecular Imaging Core facility at the University of Pennsylvania on an IVIS Xenogen Imager. KB cells (human epidermal cancer cells; folate receptor positive) and HT 1080 cells (human fibrosarcoma cells; folate receptor negative) were both purchased from the American Type Culture Collection. “Complete MEM” consists of 85% Minimum Essential Medium (MEM), 10% fetal bovine serum, 2% 1.5 g/L sodium bicarbonate, 1% of 200 mM
Pyro-K(Folate)GDEVDGSGK(BHQ-3) (PFPB) Synthesis
Fmoc-K(Boc)GD(O-2-PhiPr)E(O-2-PhiPr)VD(O-2-PhiPr)GS(Trt)GK(Mtt)-Sieber Resin
The peptide was synthesized by manual solid-phase peptide synthesis (SPPS) using commercially available Fmoc amine protected amino acids as building blocks and Sieber resin (cleavable by 1% trifluoroacetic acid [TFA]) as a solid phase, all purchased from Novabiochem.
Pyro-K(Boc)GD(O-2-PhiPr)E(O-2-PhiPr)VD(O-2-PhiPr)GS(Trt)GK(Mtt)-Sieber Resin
After the last Fmoc group cleavage, the resin was washed with 1-methyl-2-pyrrolidinone (NMP) and pyro-acid was coupled to the α-NH2 group of the N-terminal lysine. The molar ratio of pyro/HOBt/HBTU to the peptide on resin was 3/3/3:1, and the reaction was done in a shake flask with a 12-hour coupling time using dry NMP as a solvent. The resin was then washed with NMP, capped by 0.3 M acetylimidazole in NMP for 15 minutes, and washed again by an excess of NMP, dichloromethane (DCM), and dry methanol, transferred from the shake flask and dried.
Pyro-K(Boc)GDEVDGSGK(NH2)
Compound 2 (37.7 mg, 11.5 μmol) was cleaved from the resin and carefully deprotected (from Trt, Mtt, and O-2-PhiPr protecting groups with retaining Boc on N-terminal Lys) in one step by 3% TFA, 5% triisopropylsilane, and DCM for 1 hour to yield pyro-K(Boc)-GDEVDGSGK(NH2) (3, PK(Boc)P) with the ɛP-NH2 group of the C-terminal lysine exposed. The compound was precipitated from the cleavage solution by dry ether and prepurified by a few cycles of ether precipitation-DMSO dissolving. Compound 3 (10.9 mg, 6.8 μmol) was dried under a high vacuum and, without further purification, used in the next reaction. Only a small sample was purified by HPLC, and the structure was confirmed by MALDI-ToF (mass calculated 1,605.78; found 1,605.61).
Pyro-K(Boc)GDEVDGSGK(BHQ-3)
Crude pyro-K(Boc)GDEVDGSGK(NH2) (3) (9.3 mg, 5.8 μmol) was dissolved in 100 μL of dry 1% N,N-diisopropylethylamine (DIPEA) and DMSO and reacted for 2 hours with BHQ-3-NHS (4.7 mg, 6 μmol; BHQ-3, purchased from Biosearch Technologies) dissolved in 100 μL of dry DMSO to give pyro-K(Boc)GDEVDGSGK (BHQ-3) (4, PK(Boc)PB). The reaction was quenched by precipitation with ether that separates it partially from the redundant BHQ-3-NHS. Compound 4 (11.7 mg, 5.5 μmol) was dried under a high vacuum and, without further purification, used in the next reaction. Just a small sample was purified by HPLC, and the structure was confirmed by MALDI-ToF (mass calculated 2,135.05; found: 2,134.64).
Pyro-K(NH2)GDEVDGSGK(BHQ-3)
The Boc protecting group was cleaved from pyro-K(Boc)GDEVDGSGK(BHQ-3) (3) (11.5 mg, 5.4 μmol) by treating it with 50% TFA, 5% TIS, and DCM for 2 hours to give pyro-K(NH2)GDEVDGSGK(BHQ-3) (5, PK(NH2)PB). The DCM and TFA were evaporated. Compound 5 (10.6 mg, 5.2 μmol) was dried on a high vacuum and used in the final reaction without further purification. A small sample was purified by HPLC, and the structure was confirmed by MALDI-ToF (mass calculated 2,035.00; found 2,034.83).
Pyro-K(Folate)GDEVDGSGK(BHQ-3)
Pyro-K(NH2)GDEVDGSGK(BHQ-3) (5) (10.4 mg, 5.1 μmol) was dissolved in 100 μL of dry 0.5% DIPEA-DMSO and reacted for 3 hours with folate-NHS (4.3 mg, 8 μmol) dissolved in 100 μL of dry DMSO to give pyro-K(folate)GDEVDGSGK(BHQ-3) (6, PFPB). The reaction was concentrated by precipitation with ether and directly separated by HPLC. Purified compound 6 (7.4 mg, 3 μmol) was dried under a high vacuum and stored at −20°C. The purity was checked by HPLC and MALDI-ToF (mass calculated 2,458.13; found 2,457.10).
PFPB Activation by Caspase 3 in Solution
The caspase 3 kit (containing the active form of caspase 3 enzyme [molecular weight (MW) = 32,000], caspase 3 inhibitor Ac-DEVD-CHO 14 [MW = 502], and caspase 3 fluorogenic substrate Z-DEVD-AMC) was purchased from BD Pharmagen. The buffer used for cleavage contains 20 mM PIPES, 100 mM NaCl, 10 mM DTT, 1 mM ethylenediaminetetraacetic acid (EDTA), 0.1% (w/v) CHAPS, 10% sucrose, and 0.3% Tween 80 and has a pH of 7.2. The molar ratio of caspase 3 to PFPB to inhibitor is 1:80:2,000, and the incubation time is 2.5 hours. The activity of caspase 3 was checked before every measurement by its ability to cleave the fluorogenic substrate Z-DEVD-AMC. The PFPB sample was prepared as a stock solution of 15.5 μM in 0.1% DMSO-buffer, and 1 mg of inhibitor was diluted by 1 mL of DMSO to generate a 1 mg/mL stock solution. The composition of each sample (each 12.5 μM PFPB) is as follows: (1) PFPB alone: 100 μL of PFPB stock solution with 20 μL of DMSO and 3 μL of buffer; (2) PFPB with caspase 3: 100 μL of PFPB stock solution with 20 μL of DMSO and 3 μL caspase 3 solution (0.2 μg/μL); and (3) PFPB with caspase 3 and inhibitor: 100 μL of PFPB stock solution with 20 μL of inhibitor (1 mg/mL) and 3 μL of caspase 3 solution (0.2 μg/μL). All three solutions were incubated for 2.5 hours at 37°C, and fluorescence was measured using an excitation wavelength of 650 nm and emission at 674 nm after diluting the samples 60-fold by DMSO. Formation of two fragments was confirmed by HPLC.
Accumulation and Cleavage of PFPB in KB and HT 1080 Cells
KB and HT 1080 cells were grown in four-well Lab-Tek chamber slides (Naperville, IL) at a density of 50,000 cells/well, grown for 24 hours in complete MEM, and then rinsed with Hank's Balanced Salt Solution (HBSS) and incubated with 40 and 20 μM drug in 300 μL of folate-free medium at 37°C for 4.5 hours. Cells were repeatedly rinsed with HBSS after the incubation, and 300 μL of complete MEM was added. PDT-treated cells were illuminated by a laser tuned to 670 nm with a 1.5 J/cm2 light dose and a 20 mW/cm2 fluence rate. All cells were fixed 4 hours after PDT or drug aspiration by 1% formaldehyde in PBS for 20 minutes prior to scanning with confocal microscopy. The settings for confocal microscopy are as follows: 640 to 800 nm detector slit for detection of pyro fluorescence, with zoom = 2, expander = 3, resolution 512 × 512, 633 nm excitation wavelength, 40 × objective, 100% power, 851.1 gain, and −28.5 offset.
Flow Cytometry Experiment
KB cells (1 × 10⁶) were seeded in T25 flasks and grown for 1 day in complete MEM. The cells were incubated for 12 hours with 3 μM PFPB in MEM containing 0.8% BSA (1.3 mL/flask), and at the end of incubation, the medium was aspirated, cells were washed three times with 2 mL of PBS, and a 1.5 mL/flask of complete MEM was added. Cells intended for PDT were immediately treated with 10 J/cm2. All cells were carefully harvested 4.5 hours after PDT (5 hours after drug aspiration) by repeated washing first with PBS and then with 0.5 mM EDTA-PBS and in the end with 0.01% trypsin-0.5 mM EDTA-PBS. The cells were resuspended in 1 mL of PBS and immediately analyzed on a BD LSRII machine at the Flow Cytometry Laboratory, Abramson Cancer Center at the University of Pennsylvania, focusing on forward scatter, side scatter (FSC-SSC) parameters and pyro fluorescence (excitation 633 nm, emission 695 nm). To assess the fraction of necrotic cells, the cells were either stained with trypan blue and counted or labeled with 4′,6-diamidino-2-phenylindole (DAPI) (3 μM, 500,000 cells) and analyzed by flow cytometry immediately after harvesting. For antibody staining, the cells were permeabilized by methanol and stained with cleaved caspase 3 (Alexa Fluor488 Conjugate) antibody for 1 hour as described in the Cell Signaling Technology protocol.
Cell (MTT) Viability Assay
KB cells were seeded in clear 96-well plates at a density of 50,000 cells/well in 250 μL of complete MEM and grown for 24 hours at 37°C. Cells were subsequently rinsed with HBSS and incubated with no or 1, 5, or 10 μM PFPB in MEM containing 0.8% BSA for 24 hours. Cells were then rinsed with HBSS, 100 μL of complete MEM was added, and the cells were treated with three different light doses (by 670 nm laser with 20 mW/cm2 fluence rate). After incubation for 24 hours at 37°C, the cells were incubated for 2 hours with a 0.5 mg/mL solution of MTT (3-(4,5-dimethylthiazol-2-yl)-2,5-diphenyltetrazolium bromide) in complete MEM that was disposed afterward and replaced with 100 μL of 1:1 DMSO to 70% isopropanol in 0.1 M HCl. Absorbance at 570 nm was measured. The data are based on three different experiments. The results are expressed as mean ± standard error, and statistically significant differences between neighboring light doses within each drug concentration are indicated as p > .05.
In Vivo Imaging
To obtain an appropriate mouse model, nude mice were inoculated subcutaneously with 107 KB cells above the right leg and 107 HT 1080 cells above the left leg, and the tumors were grown for about 7 days. In the first case, 100 μL of 80 nmol of PFPB was injected intravenously into the tail vein of each of the two mice. Both KB and HT 1080 tumors of one mouse were treated by PDT with a light dose of 90 J/cm2 per tumor 18 hours after injection and monitored by a Xenogen IVIS imager with a Cy 5.5 filter (λexc = 615–665 nm, λem = 695–770 nm) until 23 hours after PDT (41 hours after injection), when the mouse was sacrificed. The control mouse was sacrificed 25 hours after injection. In the second case, one double-tumor bearing mouse was intravenously injected with 25 nmol of PFPB, and both tumors were treated with a 90 J/cm2 light dose per tumor 3 hours after injection and monitored by Xenogen. This mouse was sacrificed 24 hours after injection.
Histology
Histology slides were obtained from three mice in total: (1) KB and HT 1080 tumor tissue dissected from the first mouse injected with 80 nmol of PFPB and treated with light (41 hours after injection); (2) KB and HT 1080 tumor tissue dissected from the control mouse injected with 80 nmol of the drug and kept in the dark (25 hours after injection); and (3) KB tumor and HT 1080 tissue dissected from the mouse injected with 25 nmol of PFPB and treated with light (24 hours after the injection). Both HT 1080 and KB tumors from the first two mice were fixed with 1% formaldehyde in PBS immediately after dissection, whereas both tumors of the third mouse were frozen in liquid nitrogen immediately after dissection. Cryosections were made from all of these samples and an Apoptag assay was performed according to the manufacturer's procedure for all histology tissue samples using the same protocol except for the sections from the mouse injected with 25 nmol of PFPB, which were fixed with 1% formaldehyde prior to processing. Slides were scanned 24 hours after fixation by confocal microscopy with the following setting: 40 × objective, fluorescein channel: excitation 488 nm, 84% gain, gain 714.8; offset-4.2.
Results
Synthesis of PFPB
The synthesis started with an SPPS, giving Fmoc-K-(Boc)GD(O-2-PhiPr)E(O-2-PhiPr)VD(O-2-PhiPr)GS(Trt)-GK(Mtt) on Sieber resin (1). After the last Fmoc group was cleaved to expose the α-NH2 of N-terminal lysine, pyro-acid, activated by HOBt/HBTU, was coupled to the N-terminus of this immobilized peptide (Figure 2). In one step, immobilized pyro-K(Boc)GD(O-2-PhiPr)E(O-2-PhiPr)VD(O-2-PhiPr)GS(Trt)GK(Mtt) (2) was cleaved from the solid phase and partially deprotected (retaining the Boc protecting group) with 3% TFA, giving a pyro-K(Boc)GDEVDGSGK(NH2) (3, PK(Boc)P) with an unprotected ɛP-NH2 group on the C-terminal lysine. This compound was precipitated from TFA by dry ether, and the quencher BHQ-3-NHS was coupled in a solution reaction to the C-terminal lysine under mild basic and anhydrous conditions. The product was then precipitated with ether and dried to give pyro-K(Boc)GDEVDGSGK (BHQ-3) (4, PK(Boc)PB). Compound 4 was immediately deprotected using 50% TFA, exposing the ɛP-NH2 group on the N-terminal lysine in pyro-K(NH2)GDEVDGSGK(BHQ-3) (5, PK(NH2)PB). This compound was dried under a high vacuum, and the folate-NHS was coupled to the N-terminal lysine using very mild basic and anhydrous conditions. The final product pyro-K(folate)GDEVDGSGK(BHQ-3) (PFPB, 6) and a small sample of compounds 3, 4, and 5 were purified by HPLC and characterized by ultraviolet-visible spectroscopy (UV-Vis) and MALDI-ToF (see Figure 2).

Synthesis of pyro-K(folate) GDEVDGSGK (BHQ-3) (PFPB, 6) (right) and MALDI-ToF combined with UV-Vis of intermediates 3, 4, and 5 and of the final product 6 after high-performance liquid chromatographic purification (left).
PFPB Activation by Caspase 3 in Solution
To confirm that PFPB is cleavable by caspase 3 and that pyro's fluorescence (quenched in the intact molecule by BHQ-3) is restored after cleavage, we monitored the fluorescence increase upon the cleavage of PFPB by purified active caspase 3 in solution using fluorescence spectroscopy. An immediate increase in fluorescence that plateaus at 40 minutes was monitored by fluorescence spectroscopy (Figure 3) for PFPB incubated with caspase 3 (▲). This increase was not observed for PFPB alone in buffer (●) or PFPB incubated with caspase 3 enzyme and caspase 3–specific inhibitor (■) (with the ratio 1:80:2,000 for caspase 3 to PFPB to inhibitor). This, together with HPLC monitoring that shows the generation of two fragments on caspase 3 cleavage (data not shown), demonstrated that PFPB is specifically cleaved by caspase 3 in solution, and as a result, there is a ninefold increase in fluorescence.

Cleavage of pyro-K(folate)GDEVDGSGK(BHQ-3) (PFPB, 6) by caspase 3 in solution results in a fluorescence increase monitored by fluorescence spectroscopy. Fluorescence intensity (monitored for 2.5 hours) increases when PFPB is incubated with caspase 3 (▲) compared with the stable background fluorescence of PFPB alone (●) and PFPB incubated with caspase 3 in the presence of caspase 3 inhibitor (■), which completely prevents the cleavage.
Accumulation and Cleavage of PFPB in KB and HT 1080 Cells
The ability of PFPB to preferentially enter folate receptor–overexpressing cells and be cleaved as a consequence of PDT-induced apoptosis was monitored using confocal microscopy. We have used two cancer cell lines: KB cells (human epidermoid carcinoma cells; folate receptor positive) and HT 1080 cells (human fibrosarcoma cells; folate receptor negative). KB cells (Figure 4, A-D) and HT 1080 (Figure 4, E-H) cells were incubated with two different PFPB concentrations: 40 μM (Figure 4, B, C, F, and G) and 20 μM (Figure 4, D and H) for 4.5 hours and subsequently treated with a 1.5 J/cm2 light dose using a 670 nm laser (Figure 4, C, D, G, and H). There is a strong fluorescence signal increase in the cytoplasm of the KB cells incubated with 40 μM PFPB and treated by light (Figure 4C) when compared with the untreated cell alone control (Figure 4A) or cells incubated with 40 μM PFPB and kept in the dark (Figure 4B). The fluorescence signal is somewhat lower in the case of PDT-treated KB cells incubated with a lower drug dose (20 μM PFPB; Figure 4D). HT 1080 cells treated with light, on the other hand, show a comparably lower fluorescence increase than KB cells for both 40 and 20 μM concentrations (Figure 4, G and H). This confirmed that PFPB accumulates less in folate receptor–deficient cells (HT 1080) than in folate-overexpressing cells (KB), thus suggesting that folate receptor–mediated uptake is the primary delivery pathway for PFPB. In contrast, the control cells (both KB and HT 1080) incubated with 40 μM PFPB but not exposed to light showed a minimal fluorescence increase (Figure 4, B and F), excluding apoptosis-independent decomposition of PFPB. In summary, these results confirmed that (1) PFPB preferentially accumulates in KB cells, (2) the peptide linker in TaBIAS can be cleaved inside PDT-treated cells, (3) the significant increase in pyro's fluorescence is caused by apoptosis-specific cleavage and is not simply due to PFPB decomposition, and (4) based on our control experiments (data not shown), we assume that PFPB is taken into the HT 1080 cells by pyro itself, serving as a nonspecific cell delivery vehicle.

Different increase in fluorescence on light-triggered cleavage of pyro-K(folate)GDEVDGSGK(BHQ-3) (PFPB) in KB (A–D) and HT 1080 (E–H) cells monitored by confocal microscopy. Confocal images of (A) KB cells alone; (B) KB cells incubated for 4.5 hours with 40 μM PFPB and kept in the dark; (C) KB cells incubated for 4.5 hours with 40 μM PFPB and treated with 1.5 J/cm2; (D) KB cells incubated for 4.5 hours with 20 μM PFPB and treated with 1.5 J/cm2; (E) HT 1080 cells alone; (F) HT 1080 cells incubated for 4.5 hours with 40 μM PFPB and kept in the dark; (G) HT 1080 cells incubated for 4.5 hours with 40 μM PFPB and treated with 1.5 J/cm2; (H) HT 1080 cells incubated for 4.5 hours with 20 μM PFPB and treated with 1.5 J/cm2. Both KB (B) and HT 1080 (F) cells incubated with 40 μM PFPB but not treated with light show a minimal fluorescence increase, excluding apoptosis-independent PFPB decomposition. The cells treated with drug and light show a concentration-dependent fluorescence increase that is significantly higher in KB cells (C and D) than in HT 1080 cells (G and H) owing to a lower PFPB accumulation in HT 1080 cells than in KB cells. In each case, the upper image is differential interference contrast (DIC) and the lower image is pyro fluorescence.
Apoptosis Monitored by Flow Cytometry
Additional evidence for apoptosis triggering was obtained from flow cytometry analysis15,16 of living KB cells incubated with 3 μM PFPB and treated with a 10 J/cm2 light dose using FSC-SSC fluorescence-activated cell sorter (FACS) parameters defining shrunken or hypergranular cells. The fraction of cells with higher SSC and lower FSC (upper left) increased from ≈4% for KB cells either treated with 10 J/cm2 (Figure 5A) or with 3 μM PFPB and kept in the dark (Figure 5B) to 58% for KB cells incubated with 3 μM PFPB and treated with 10 J/cm2 (Figure 5C). We have identified, using DAPI for flow cytometry and trypan blue for microscopy, less than 2% of these cells as necrotic. The shrunken or hypergranular cells (green, 58%) also have approximately three times higher pyro fluorescence coming from the PDT-induced apoptosis-triggered cleavage of PFPB inside the living cells (Figure 5E compared with Figure 5D). This fluorescence increase is not detected in cells 2 hours after heat-induced necrosis. Also, the whole population of PFPB- and PDT-treated cells (see Figure 5C) has a 1.7 times higher signal from staining with the antibody against activated caspase 3. The correlation of apoptotic shape defined by FSC-SSC and increased fluorescence from cleaved PFPB in more than half of the cells after light treatment supports the function of TaBIAS as an apoptotic trigger and reporter in vitro.
PDT-Induced Cell Death Quantified by Cell Viability (MTT) Assay
We have shown that apoptosis induction correlates with PFPB cleavage using flow cytometry, but for quantitation of overall cell death in the whole population for variable drug and light doses, we used a cell viability (MTT) assay. This assay determines the PDT efficacy of a drug by correlating the viability of cells before and after PDT treatment, in which cells not treated with light and drug serve as a relative reference (100% viable). Despite the decreased potency that is a by-product of the fluorescence quenching (the presence of BHQ-3 reduces singlet oxygen production three to four times by quenching pyro's singlet excited state), we have confirmed (as shown in Figure 6) that PFPB is an effective PDT agent.
In Vivo Data
Given that PFPB preferentially accumulates in KB cells overexpressing folate receptor compared with HT 1080 cells lacking folate receptor expression, the post-PDT increase in fluorescence was expected to be much higher in a KB tumor than in an HT 1080 tumor. Two double-tumor mice bearing an HT 1080 tumor on the left side and a KB tumor on the right side were injected intravenously with 80 nmol of PFPB. One mouse received a 90 J/cm2 whole-tumor PDT treatment with a 670 nm laser for both HT 1080 and KB tumors 18 hours after intravenous injection and was scanned by a Xenogen IVIS imager (see Figure 6A, prescan; Figure 6B, 23 hours after PDT and 41 hours after intravenous injection of PFPB); the other mouse served as a control and was kept in the dark. The Xenogen image of the mouse treated by PDT shows a distinctly higher post-PDT increase in pyro fluorescence in the KB tumor compared with the HT 1080 tumor (see Figure 6B), thus confirming the targeted apoptosis-reporting function of PFPB. This function was independently evaluated using an Apoptag assay that labels the cells that have reached the point of DNA laddering during apoptosis (critically dependent on caspase 3 activation), specifically labeling this DNA cleavage by fluorescein conjugates.
Therefore, after the mice were sacrificed, cryosections from both the KB and HT 1080 tumors of the PDT-treated and control mouse were stained with the Apoptag assay and examined by confocal microscopy (see Figure 6, C-F). As expected, only the KB tumor of the mouse treated by PDT shows a significant increase in both pyro fluorescence (Xenogen images; see Figure 6B) and apoptosis (histology slides; see Figure 6E) when compared with the HT 1080 tumor from the same mouse (see Figure 6F) or with both tumors from the control mouse that was not subjected to PDT (see Figure 6, C and D).
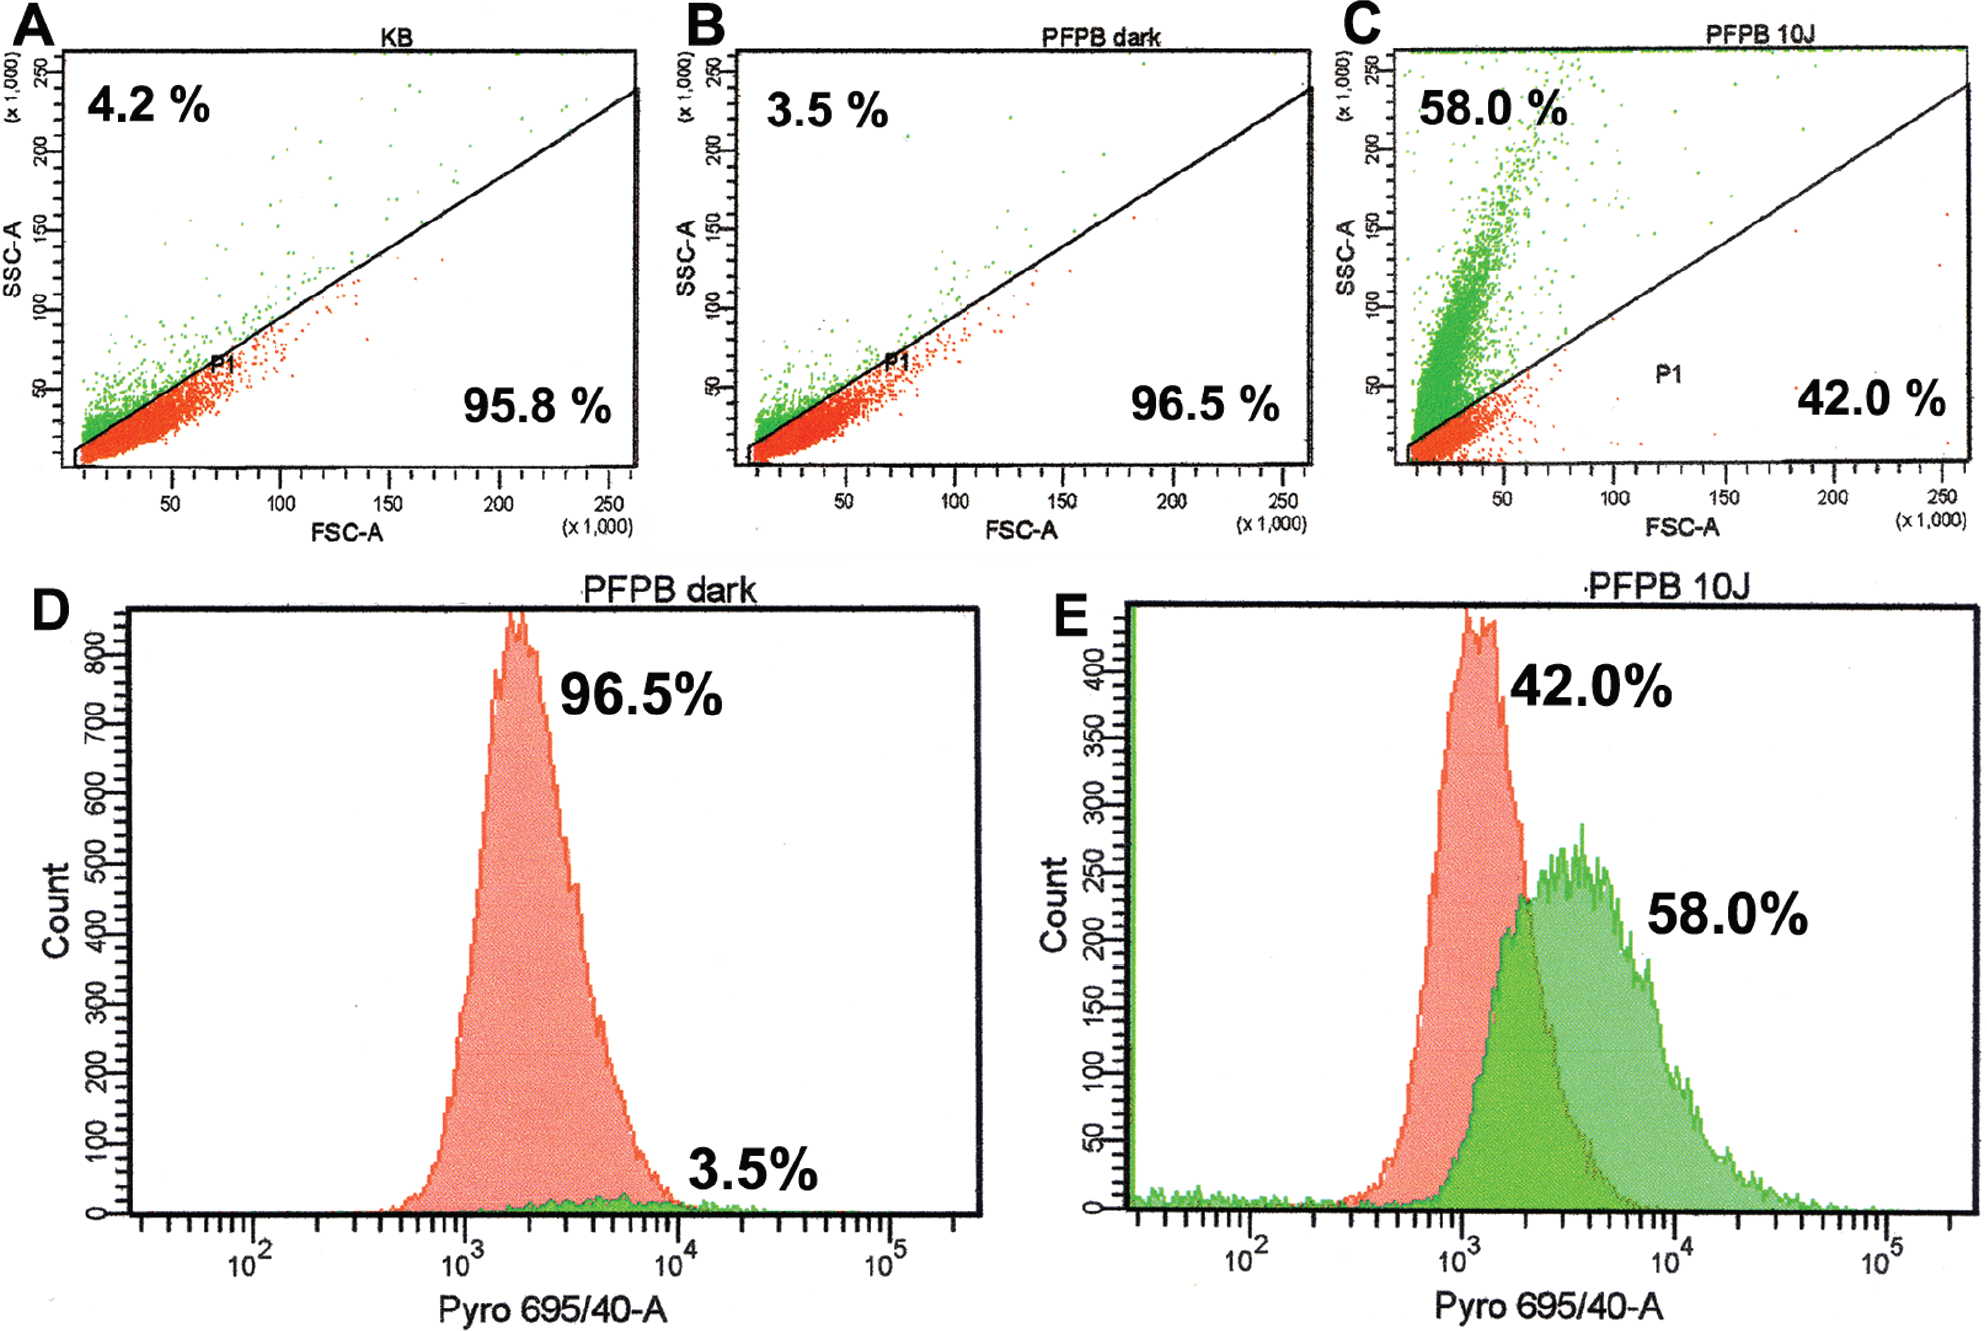
Fluorescence-activated cell sorter (FACS) analysis of shrunken or hypergranular cells using forward scatter, side scatter (FSC-SSC) parameters and pyro fluorescence on living KB cells alone or incubated with 3 μM pyro-K(folate)GDEVDGSGK(BHQ-3) (PFPB) and/or treated with light harvested 5 hours after drug aspiration or photodynamic therapy treatment. The same gate (P1) was set between apoptotic and live cells, and the proportion of apoptotic and living cells is shown in the upper left and lower right corners, respectively. It is clear that cells treated with 10 J/cm2 (A) or incubated with 3 μM PFPB in the dark (B) are significantly less apoptotic (≈4%) than cells incubated with 3 μM PFPB and treated with a 10 J/cm2 light dose (58%; C). These apoptotic cells (outside P1 gate) have approximately three times higher pyro fluorescence than those within the P1 gate (comparing D and E), correlating apoptosis with PFPB cleavage in living cells. The profile of log pyro fluorescence versus cell count for P1 (red) and non-P1 (green) populations from Figure 5, B and C, is shown in Figure 5, D and E, respectively.
To further confirm the results from the previous animal experiment and improve the signal to noise ratio, we intravenously injected another double-tumor-bearing mouse with a lower drug dose (25 nmol of PFPB, 100 μL) and treated both KB and HT 1080 tumors with the same light dose (90 J/cm2) only 3 hours after the injection. The Xenogen images show an increase in fluorescence in the KB tumor compared with the prescan (Figure 7A: prescan) and a decreasing background with increasing time interval after PDT (Figure 7B: 30 minutes, 7C: 2 hours, Figure 7D: 3 hours after PDT). The organ adjacent to the tumor sites exhibiting high signal from peptide degradation is probably the kidney, based on the biodistribution of the unquenched folate receptor–targeted probe (data not shown). Histology slides (Figure 7, E and F) of both tumors from this mouse sacrificed 24 hours after injection again show higher Apoptag staining in the KB tumor (see Figure 7F) than in the HT 1080 tumor (see Figure 7E), with an overall better signal to background ratio.
The results from these animal experiments suggest that (1) PFPB accumulates preferentially in folate-overexpressing KB tumors in vivo, (2) there is an increase in pyro fluorescence in the area of PFPB accumulation and PDT treatment as a consequence of in vivo cleavage of the caspase 3–specific peptide linker, and (3) this area is highly apoptotic, as shown in ex vivo analysis.
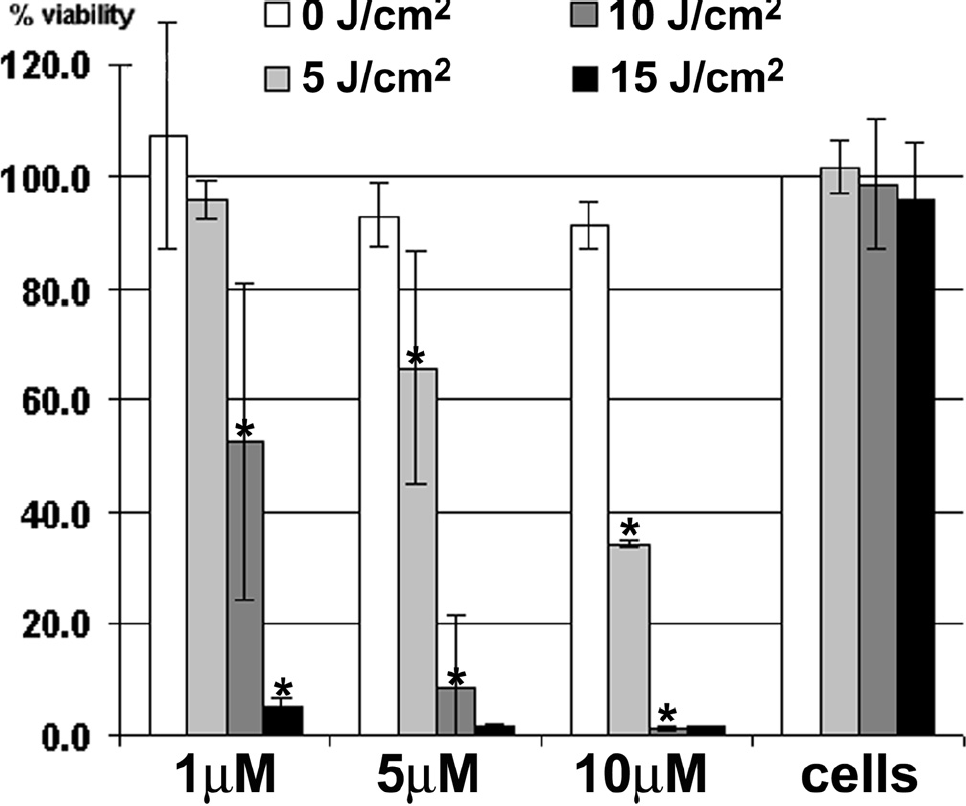
Photodynamic therapy (PDT) efficacy of pyro-K(folate)GDEVDGSGK(BHQ-3) (PFPB) determined by cell viability (MTT) assay. Viability of KB cells after treatment with PFPB at three different concentrations (1, 5, and 10 μM) and with three different PDT light doses (5, 10, and 15 J/cm2) compared with cells alone that serve as 100% viable reference. PFPB has minimal dark toxicity and good PDT efficacy. Comparisons for increasing light doses within each concentration were made by t-test (*p < .05); for example, cells incubated with 5 μM PFPB and treated with 5 J/cm2 have significantly different viability than those incubated with the same concentration and kept in the dark (0 J/cm2).
Discussion
We have designed a molecule with various features: it is multifunctional but small and soluble, specific but versatile, and, most importantly, it is both a therapeutic and an imaging agent. This feature allows TaBIAS to evaluate its own therapeutic outcome by imaging the extent of apoptosis in situ after PDT treatment.
Multifunctional but Small and Soluble
TaBIAS comprises four principal components. First, the therapeutic component of TaBIAS is a pyropheophorbide a (pyro)—a photosensitizer that was shown to trigger apoptosis 7 by light-dependent production of singlet oxygen 17 that disrupts the mitochondrial membrane.18–20 Second, the imaging component is the fluorescence of pyro21,22 together with a caspase 3 cleavable sequence. 23 The fluorescence allows tracking of the signal by real-time in vivo NIR imaging, and the caspase 3 cleavable sequence serves as an apoptosis-sensitive switch 24 of the photosensitizer fluorescence. The third component, a background-eliminating fluorescence quencher BHQ-3, is responsible for turning this switch off in living cells. Caspase 3 was chosen as the target enzyme because it is a crucial executioner protease involved in the progression of controlled cell death,25,26 which is indicative of apoptosis induction 27 and is frequently used as a target enzyme for apoptosis imaging.23,28,29 The fourth component introduces the cancer specificity into our concept by attaching a folate delivery component targeting folate receptor–overexpressing cancer cells. Unlike many multifunctional agents, this molecule has an MW below 2,500 Da, is soluble in water, and has minimal dark toxicity.
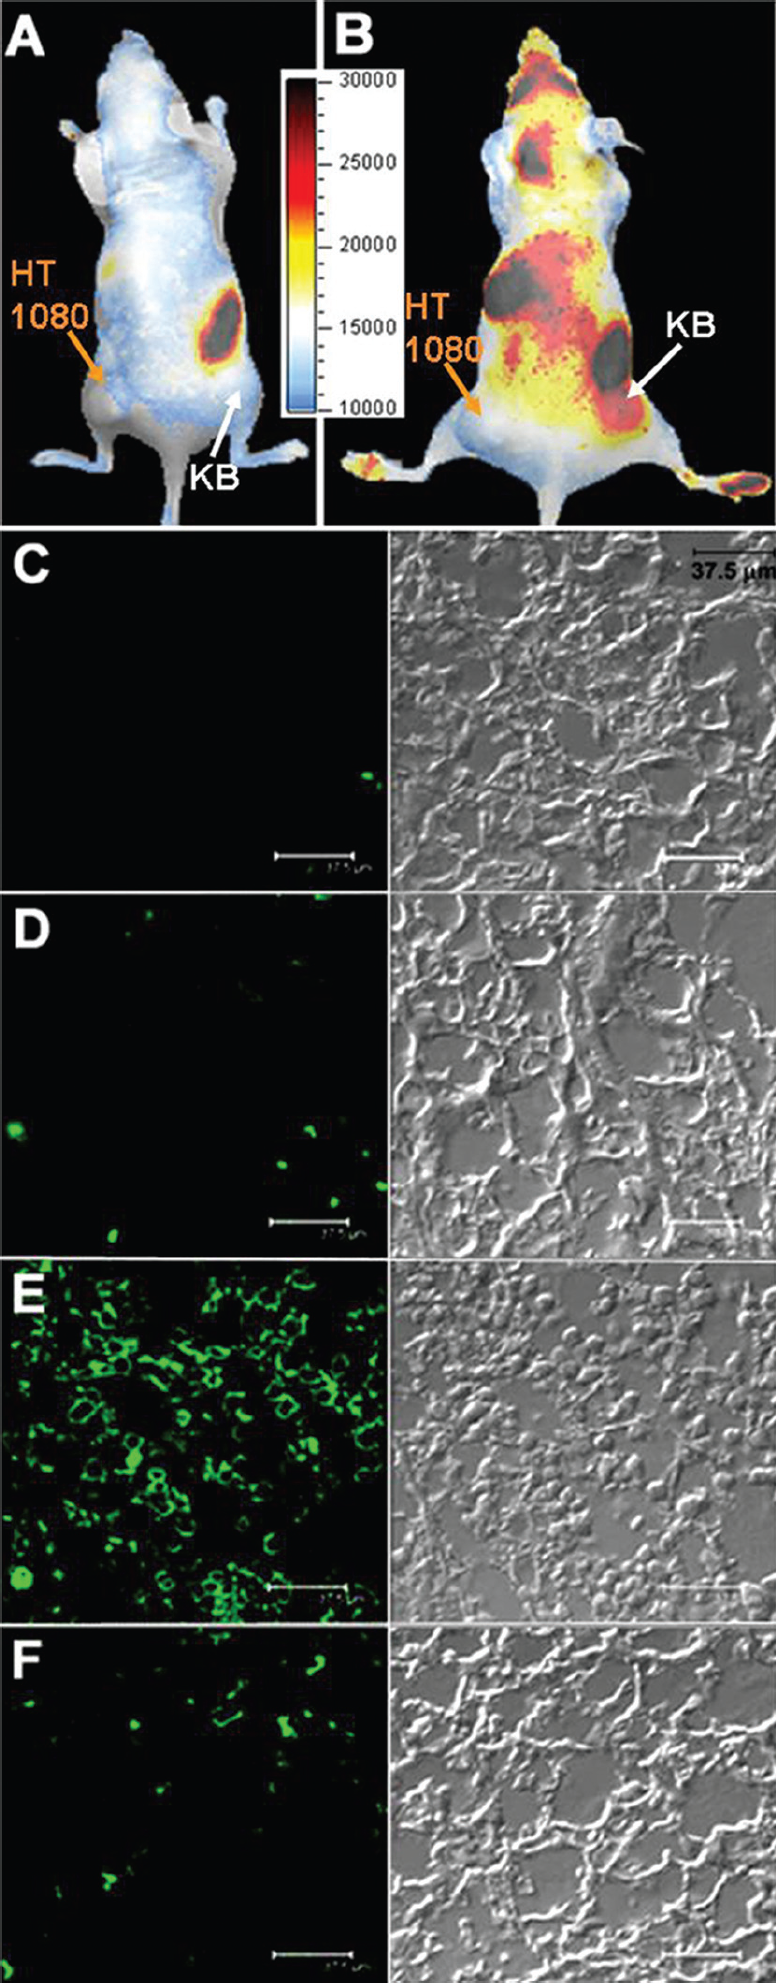
In vivo induction and detection of apoptosis in a mouse bearing KB and HT 1080 tumors after photodynamic therapy (PDT) (90 J/cm2) by intravenously injected pyro-K(folate)GDEVDGSGK(BHQ-3) (PFPB, 80 nmol). (A + B): Xenogen images of a mouse bearing an HT 1080 tumor (folate receptor negative) on the left side and a KB tumor (folate receptor positive) on the right side: (A) before injection of PFPB and (B)after PDT (23 hours after PDT and 41 hours after intravenous injection of PFPB). (C–F): Histology tissue slides stained with Apoptag and scanned by confocal microscopy: left, fluorescence of Apoptag (488 nm); right, differential interference contrast (DIC) image; (C) KB tumor from the control mouse; (D) HT 1080 tumor from the control mouse; (E) KB tumor from the PDT-treated mouse; (F) HT 1080 tumor from the PDT-treated mouse. The scale bar is 37.5 μm. Increased apoptosis in the folate-overexpressing tumor (KB) of the PDT-treated mouse was confirmed by ex vivo Apoptag staining.

In vivo induction and detection of apoptosis in a mouse bearing KB and HT 1080 tumors after photodynamic therapy (PDT) (90 J/cm2) using a lower dose of intravenously administered pyro-K(folate)GDEVDGSGK (BHQ-3) (PFPB,25nmol) andashorter postinjection delay before PDT. (A–D): Xenogen images of a mouse bearing an HT 1080 tumor (folate receptor negative) on the left side and a KB tumor (folate receptor positive) on the right side: A, before injection of PFPB; B, 30 minutes after PDT (4 hours after intravenous injection of PFPB); C, 2 hours after PDT (5.5 hours after intravenous injection); and D, 3 hours after PDT (6.5 hours after intravenous injection), showing a gradual increase in fluorescence in the KB tumor and a reduced background. (E + F): Histology tissue slides stained with Apoptag and scanned by confocal microscopy; the scale bar is 37.5 μm: left, fluorescence signal of Apoptag (488 nm, fluorescein); right, differential interference contrast (DIC) image; (E) HT 1080 tumor; and (F) KB tumor. This ex vivo Apoptag staining confirmed increased PDT-induced apoptosis in the folate-overexpressing tumor (KB).
Specific but Versatile
Introduction of a folate delivery vehicle allowed us to distinguish between cells (see Figure 4) and tumors (Figures 7 and 8) with different levels of folate receptor. This specificity was needed to prove the TaBIAS concept in vivo, but the delivery vehicle can be exchanged for alternative vehicles or another apoptosis-inducing drug. Our basic construct (containing only the first three components) attached to another drug would be useful for intracellular delivery and for in vitro evaluation of a drug's apoptosis-inducing properties since pyropheophorbide a can serve as both a very efficient (but not specific) delivery vehicle and a fluorescence marker.17,21
Therapeutic and Imaging Agent
TaBIAS enters the cell via a folate delivery pathway, and upon the light treatment, it produces cytotoxic singlet oxygen near mitochondria, triggering apoptosis with caspase 3 activation.13,24 As a consequence, the caspase 3–specific sequence that connects the fluorescent photosensitizer with the quencher is cleaved. We have demonstrated this cleavage in solution, in vitro, and in vivo.
The apoptosis involvement in this cleavage was confirmed: (1) in vitro by flow cytometry correlating FSC-SSC parameters 16 with pyro's fluorescence and anticaspase 3 staining and (2) ex vivo by staining the TaBIAS-treated tumors with Apoptag assay that labels apoptosis-specific DNA cleavage. Flow cytometry of living cells showed that more than half (58%) of the cells treated with 3 μM PFPB and light display shrunken or hypergranular morphology together with triple the pyro fluorescence signal compared with the minimal amount of these cells (4%) in the sample treated with PFPB but kept in the dark. Using an Apoptag assay performed on tumor tissues treated with drug and/or PDT for both types of tumors, we observed increased apoptosis (signal from Apoptag assay) for PDT- and TaBIAS-treated specimens of folate-overexpressing KB tumors. Monitoring apoptosis using TaBIAS, morphologic assesment, and a commercially available apoptosis sensor confirmed that the significant increase in the photosensitizer's fluorescence detected in the light-treated area is indicative of PDT-triggered apoptosis. We can therefore conclude that TaBIAS triggers apoptosis and can be used, unlike most current commercial sensors, as a tool for monitoring a self-triggered apoptosis in situ.
Future Prospects
Most of the in vivo apoptosis imaging methods, using either annexin V30 or Fluorescence Resonance Energy Transfer (FRET) probes, 23 are used strictly for detection of already existing apoptosis. Also, many of the in vitro methods currently used for apoptosis detection struggle with poor intracellular delivery, low specificity toward apoptosis,31,32 or a lack of feasibility for in situ apoptosis assessment. Our TaBIAS can be used as both a built-in evaluation of already existing fluorescent PDT agents or a membrane permeable, a soluble carrier, and an apoptosis sensor for evaluating the properties and efficacy of many small apoptosis-inducing drugs.
Although this study supported all discussed features of TaBIAS, obstacles remain regarding partial (three to four times) singlet oxygen quenching, photobleaching, and in vivo peptide degradation. Until these issues are resolved, the current TaBIAS design will be qualitative rather than quantitative in terms of reporting apoptosis response. We anticipate improving our TaBIAS design by changing the core components of the TaBIAS scaffold (eg, shorten the caspase 3 cleavable sequence, use a more suitable quencher and photosensitizer) to fine-tune its properties.
In conclusion, we have shown that TaBIAS can effectively trigger and image apoptosis upon the light exposure in situ and can potentially be used as a new in situ cancer treatment evaluation for a variety of drugs and cancers. This will be possible by simply substituting the delivery vehicle with an anticancer drug and using pyro as a fluorescent reporter and cell-internalizing molecule.
Footnotes
Acknowledgments
We thank André E. X. Brown for critical comments and suggestions on the manuscript. We also thank Dr. Wafik El-Deiry for access to the Xenogen imager.