
Abstract
ML-05 is a non-hemolytic form of streptolysin O, the membrane-damaging extracellular toxin produced by certain streptococci. ML-05 stimulates keratinocyte migration and proliferation in wound-healing scratch assays and promotes wound healing in a human skin organ culture wound model. Pathway-focused DNA microarrays were used to elucidate ML-05's mechanism of action in wound healing processes. Normal human epidermal keratinocytes (NHEK) were treated with varying concentrations of ML-05 for 24 hours, followed by RNA extraction and cRNA production. Gene expression profiling utilized microarrays containing nucleic acid probes for 113 extracellular matrix (ECM) genes. Microarrays yielded 6 upregulated and 4 downregulated genes with ≥2-fold changes and p<0.05 in t-tests. Quantitative real-time polymerase chain reactions (qPCR) were used to verify gene regulation. Upregulated genes of interest were VCAN (formerly CSPG2, encoding versican), CD44 (encoding hyaluronan receptor), ICAM1 (encoding intercellular adhesion molecule-1) and CTGF (encoding connective tissue growth factor). All four upregulated genes encode proteins involved in promoting keratinocyte migration and proliferation. Downregulated genes of interest were MMP9 (encoding matrix metalloproteinase 9) and SPP1 (encoding osteopontin). ML-05 may enhance wound healing through the expression of specific genes encoding proteins capable of promoting keratinocyte migration, proliferation, and other activities related to maintaining ECM structure and function.
INTRODUCTION
Streptolysin O (SLO), a hemolytic exotoxin, is produced by Streptococcus species of groups A, C & G. Structurally, the SLO primary gene product is made up of 571 amino acids with several structural and functional domains. This 60–70 kDa single chain protein can act as a thiol-activated, cholesterol-binding agent, forming pores in cell membranes in its reduced state. Red blood cells, being particularly susceptible to cytolysis, are used to determine the cytolytic properties of SLO. Similar cytolytic toxins are produced by other species of Gram-positive bacteria (Johnson et al. 1980; Alouf et al. 1984; Bhakdi et al. 1985; Palmer et al. 1996; Harris et al. 1998; Palmer 2001).
ML-05 is a non-hemolytic form of SLO that is produced by oxidation of the parent molecule. Previous research established that ML-05 markedly enhanced keratinocyte migration and proliferation in in vitro wound healing scratch assays and promoted wound reepithelialization in an ex vivo human skin organ culture wound model (Tomic-Canic et al. 2007). Interestingly, ML-05 did not affect either migration or proliferation of human dermal fibroblasts, suggesting that ML-05's effects on cell migration/proliferation may have been keratinocyte-specific. ML-05 has also been shown to modulate the excessive production of collagen in two murine models of scleroderma, the genetically based tight skin (Tsk) model and the bleomycin-induced scleroderma model (Mamber et al. 2004).
Based on a survey of the scientific literature, it has been hypothesized that ML-05 may facilitate the restoration of normal extracellular matrices within tissues by indirectly or directly altering collagen production. The beneficial effects of ML-05 on wound healing and/or antifibrotic processes may be achieved via several possible mechanisms. First, SLO and related compounds may increase or maintain the expression of cell surface receptors that are involved in extracellular matrix (ECM) organization, such as hyaluronan receptor CD44 (Mamber et al. 2004; Aruffo et al. 1990; Lesley et al. 1993; Cichy and Puré, 2003). The pharmacological effects of low levels of ML-05 on the upregulation of CD44 were characterized in a previous in vitro study (Mamber et al. 2004). Appropriate changes in the expression of ECM receptors such as CD44 and subsequent downstream events within the ECM may promote wound healing (Johnson et al. 2000; Rilla et al. 2002; Boraldi et al. 2003; Karvinen et al. 2003; Tammi et al. 2005). Second, ML-05 may have beneficial immunomodulatory properties related to both collagen production and wound healing. SLO and related substances can induce the production of a variety of cytokines and chemokines (Houldsworth et al. 1994; Kraakman et al. 1995; Baba et al. 2002; Cockeran et al. 2002; Mitsui et al. 2002; Walev et al. 2002; Stassen et al. 2003; Kadioglu et al. 2004). As an example of the favorable effects of cytokines on wound healing processes, interferon-gamma (IFN-γ) and interleukin-12 (IL-12) have been shown to decrease abnormal collagen production associated with fibrogenesis (Azouz et al. 2004; Granstein et al. 1987; Granstein et al. 1990; Shi et al. 1997; Ishida et al. 2004). Third, pneumolysin, a bacterial protein chemically related to SLO, induced collagenase production in fibroblasts at sublytic concentrations (Johnson et al. 1988). Increased collagenase levels may have local effects on abnormal collagen production and deposition (Arakawa et al. 1996.).
Given the possibility that ML-05 might exert its wound healing and collagen-modulating effects through ECM-related physiological, immunological and/or enzymatic mechanisms, it was thought that genomics-based technologies could be employed to identify differentially expressed genes involved in mechanisms of action of ML-05. Accordingly, the objective of this research was to evaluate the effects of ML-05 on ECM gene expression in normal human epidermal keratinocytes (NHEK cells) using pathway-focused DNA microarrays and related gene expression profiling technologies.
MATERIALS AND METHODS
Streptolysin O and ML-05
Native SLO, purified from Streptococcus pyogenes, was purchased commercially from Sigma Chemicals (St. Louis, MO). A stock solution containing 2,000 U/ml (unit value based on the hemolytic activity of the starting material) was prepared in sterile deionized water. Oxidation was achieved by bubbling oxygen into the stock solution, and the final formulation (ML-05) was filtered through a 0.22 μm filter and stored at 4°C or −20°C. Subsequent dilutions of the stock solution for all experiments were made in sterile deionized water. Evidence of oxidation was demonstrated by the lack of activity in hemolysis assays. Standard hemolysis assay methods were provided by Sigma Chemicals (product literature), except that sheep red blood cells were employed instead of human red blood cells. Briefly, microdilution tray wells contained reaction mixtures of 10 mM sodium phosphate, 103 mM sodium chloride, 0.4% (v/v) red blood cells, 0.4 mg/ml bovine serum albumin, 40 mM dithioerythritol and varying dilutions of ML-05 (or fresh SLO as the comparator/positive control). Hemolysis, or lack thereof, was determined visually after incubation at 37°C for 30 minutes.
Cell Culture and Treatment of Cells with ML-05
Normal human epidermal keratinocytes (NHEK cells) were purchased from Invitrogen (Carlsbad, CA). NHEK cells were expanded to passage 4 in individual T-25 cell culture flasks using serum-free keratinocyte medium (Invitrogen) supplemented with Epidermal Growth Factor (5 ng/ml) and Bovine Pituitary Extract (0.05 mg/ml), and maintained at 37°C in a 5% CO2 incubator. For the ML-05 treatment experiment, NHEK cells were grown as monolayers in T-25 flasks to about 80% confluence. At 24 hours prior to ML-05 treatment, the existing cell culture medium was removed from each flask and replaced with 10 ml of fresh cell culture media. Cells then were exposed to ML-05 at final concentrations ranging from 2 × 10⁻⁶ to 2 × 10² units/ml (10-fold dilutions) for 24 hours. Sterile deionized water was used as a vehicle control and all exposures were done in triplicate.
RNA Extraction and cRNA Production for Gene Expression Profiling
RNA extraction procedures involved the use of ArrayGrade™ total isolation RNA analysis kits (SABiosciences [formerly SuperArray Biosciences], Frederick, MD). For each T-25 flask containing treated NHEK cells, the medium was removed and cells were lysed directly in the T-25 flasks with 400 μl of alkaline lysis buffer. The flasks were rocked gently to permit the alkaline lysis buffer to coat the monolayer and lyse the cells. For each sample, an aliquot of 350 μl of lysed cells in alkaline lysis buffer was added to a spin column and total RNA was isolated using the appropriate reagents and supplies in accordance with procedures recommended by the manufacturer (SABiosciences). The concentration of RNA in each sample was determined using a Qubit™ fluorimeter (Invitrogen), and representative RNA samples were checked for purity using a Nanodrop™ spectrophotometer (Thermo Scientific, Wilmington, DE).
An aliquot of each total RNA sample was added to a separate micro-centrifuge tube to achieve an RNA amount of 250 ng/tube. Tubes containing RNA were centrifuged briefly, frozen at −80°C, and then evaporated to dryness using a SpeedVac™ concentrator (Thermo Scientific). RNA was amplified and converted to cRNA using the TargetAmp™ 1-Round Biotin-aRNA (cRNA) Amplification Kit (TA-104; Epicentre Biotechnologies, Madison, WI) in accordance with the manufacturer's instructions. SuperScript™ III reverse transcriptase used with the TargetAmp kit was purchased from Invitrogen. Briefly, each total RNA sample (250 ng) was used for first strand cDNA synthesis in the presence of 50 units of reverse transcriptase. This in turn was used for second strand cDNA synthesis and each resulting reaction mixture was stored overnight at −20°C. Next, a combination of biotin labeling and amplification during in vitro transcription of the cDNA achieved the production of sufficient quantities of biotinylated cRNA for microarray hybridizations. The resulting biotinylated cRNA samples were purified using an ArrayGrade™ cRNA Cleanup Kit (SABiosciences). The concentration of each purified cRNA sample was determined with the Qubit ™ fluorimeter.
DNA Microarrays
Pathway-focused DNA microarrays, specifically Oligo GEArrays® (SABiosciences), were employed as a means of investigating the effects of ML-05 on extracellular matrix gene expression (ECM DNA microarrays). Each ECM DNA microarray consisted of a small nylon membrane containing DNA encoding 113 target DNA sequences for genes known to be associated with the biological structure and function of the extracellular matrix. Each membrane was contained within an individual disposable polypropylene hybridization tube (HybTube). Briefly, for each NHEK cRNA sample, RNA:DNA hybridizations using the ECM microarrays were conducted in accordance with the manufacturer's instructions (2–2.5 μg of biotin-labeled cRNA were added per individual HybTube). HybTubes were incubated at 60°C overnight in a standard rotisserie-type hybridization oven with three-dimensional rotation. This was followed by several washing steps as well as incubation of each membrane with alkaline phosphatase-streptavidin at room temperature for 10 minutes. The last step of the procedure involved the addition of a chemiluminescence detection reagent (CDP-Star®) to each membrane-containing tube (room temperature incubation for 5 minutes). Results were obtained by photographing an image of each microarray membrane using a chemiluminescence CCD camera system (either a Kodak Image Station [Carestream Health, Rochester, NY] or a ChemiDoc-It® Imaging System [UVP, Upland, CA]). All resulting microarray images were processed using online gene expression and analysis software provided by SABiosciences (GEASuite).
Quantitative Real-time Polymerase Chain Reaction (qPCR)
Verification of selected genes of interest that were differentially regulated by DNA microarrays was accomplished by quantitative real-time polymerase chain reaction (qPCR) techniques employing RT2 qPCR Primer Assays (SABiosciences). Total RNA from the biological replicate samples of interest served as the starting material for these assays. RNA concentrations (OD260) and purities (OD260/OD280) were determined using a Nanodrop 1000. RNA integrity was established by agarose gel electrophoresis. Reverse transcription PCR (RT-PCR) protocols utilized reagents obtained from SABiosciences. For each sample, cDNA was generated using the RT2 First Strand Kit (SABiosciences) according to the manufacturer's instructions. Briefly, 500 ng of total RNA was incubated with the Genomic DNA Elimination Mixture in a 10 μl reaction and incubated for 5 min at 42°C. To generate cDNA, 10 μl of RT Cocktail (containing reverse transcriptase, random hexamers and oligo-dT) was added and samples were incubated at 42°C for an additional 15 min. Reactions were stopped by heating at 95°C for 5 minutes. qPCR reactions (25 μl volumes) were carried out using 1 μl of cDNA with the RT2 qPCR Primers and RT2 SYBR Green/ROX qPCR Master Mix (SABiosciences) according to the manufacturer's instructions. Primer catalog numbers (SABiosciences) were as follows: CD44, PPH00114A; CTGF, PPH00550E; GAPDH (internal control gene), PPH00150E; ICAM1, PPH00640F; ITGA4, PPH00659E; MMP9, PPH00152E; SPP1, PPH00582E; and VCAN, PPH06098B. Reactions were run under the following conditions in an Mx3005 Quantitative PCR System (Stratagene, La Jolla, CA): One cycle of 95°C for 10 minutes, followed by 40 cycles of 95°C for 15 seconds and 60°C for 1 minute. Fluorescence intensity was measured at the end of each 60°C cycle, and all experiments included both no-RT and no-template controls. Samples were run in triplicate.
Data Analysis and Statistical Evaluations
The software used with the pathway-focused DNA microarrays yielded data reflecting levels of the expression of the various genes of interest. GEASuite data were exported to Microsoft Excel for further data analysis and evaluation. Genes were classified as upregulated or downregulated based on fold changes in gene expression relative to control values. Statistical methods used were based on those described by Cui and Churchill (2003). First, fold changes in gene expression were calculated for each gene by dividing the mean treatment value by its corresponding control value (treatment:control gene expression ratio). Upregulation was based on treatment:control gene expression ratios of 1.5 (50% increase) or higher. Whereas, genes were considered downregulated based on treatment:control gene expression ratios of 0.67 (50% decrease) or lower. Subsequently, two-tailed t-tests (assuming unequal variances to compensate for small sample sizes) were performed on each set of gene expression data (treatment vs. controls) to determine the statistical significance of the treatment vs. control gene expression values (p<0.05). These analyses also relied on volcano plots, a graphical means of combining both fold changes and t-test results into scatter plots of transformed p-values vs. a transformation of the fold change. Further data evaluations and selection of genes of interest for verification by qPCR was accomplished using both standard reviews of the scientific literature (PubMed; http://www.ncbi.nlm.nih.gov/pubmed/), and through the use of pathway analysis software (Pathway Studio®; Ariadne Genomics, Rockville, MD).
For qPCR assays, fold changes in genes of interest for the treatment samples relative to untreated controls were calculated by the delta-delta Ct method as recommended by SABiosciences, along with two-tailed t-tests to determine the statistical significance (p<0.05) of the fold-change results. Genes of interest were regarded as upregulated (or downregulated) in cases where fold change was >1.33 (<0.75) coupled with statistical significance in an accompanying two-tailed t-test (p<0.05).
RESULTS
Extracellular Matrix Gene Expression in NHEK Cells
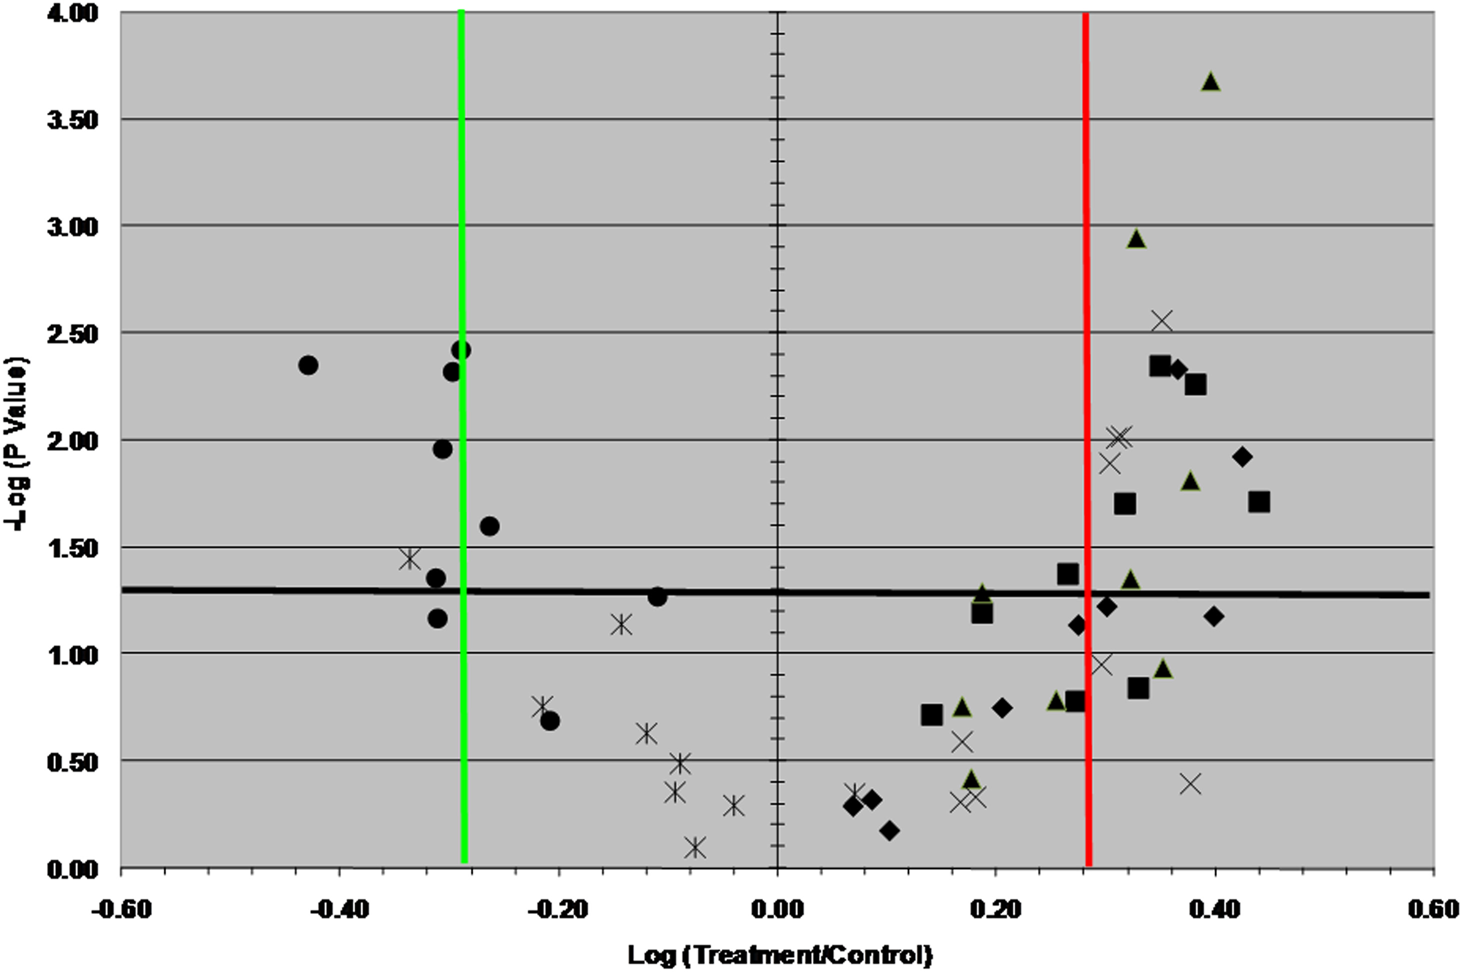
Previous research with ML-05 treatment of keratinocytes indicated that effects on migration and proliferation and on CD44 expression occurred at concentrations ranging from 0.02–20 U/ml (Tomic-Canic et al. 2007; Mamber et al. 2004.). However, different effects were optimal at different concentrations. For example, migration was optimal at 2 U/ml, while proliferation was optimal at the lowest treatment concentration of 0.02 U/ml and decreased with increasing concentration (Tomic-Canic et al. 2007). Knowing that a) gene expression profiling provides only a snapshot of cellular functions (i.e., mRNA levels) at a given time, b) different ML-05 concentrations could result in different physiological effects, and c) optimal effects on cellular functions such as proliferation could occur at concentrations lower than 0.02 U/ml, it was decided that these initial gene expression profiling experiments should be concentration-based rather than temporal in nature. Accordingly, NHEK cells were treated with one of nine ML-05 concentrations ranging from 2 × 10⁻⁶ – 2 × 10² U/ml for a single 24-hour time period. Figure 1 is a volcano plot of the gene expression results (statistical significance on the y-axis, fold change on the x-axis) for the 113 ECM microarray genes at all 9 treatment concentrations.

Volcano plot of the effects of ML-05 on ECM microarray gene expression at all 9 treatment concentrations. This plot incorporates both fold-change (log of the treatment/control ratio on the x-axis) and statistical significance (−log of the t-test p-value on the y-axis). The vertical red and green lines show where fold change = 2, and the horizontal black line shows where p = 0.05. Accordingly, upregulated and downregulated genes of interest occupy the upper right and upper left quadrants, respectively.
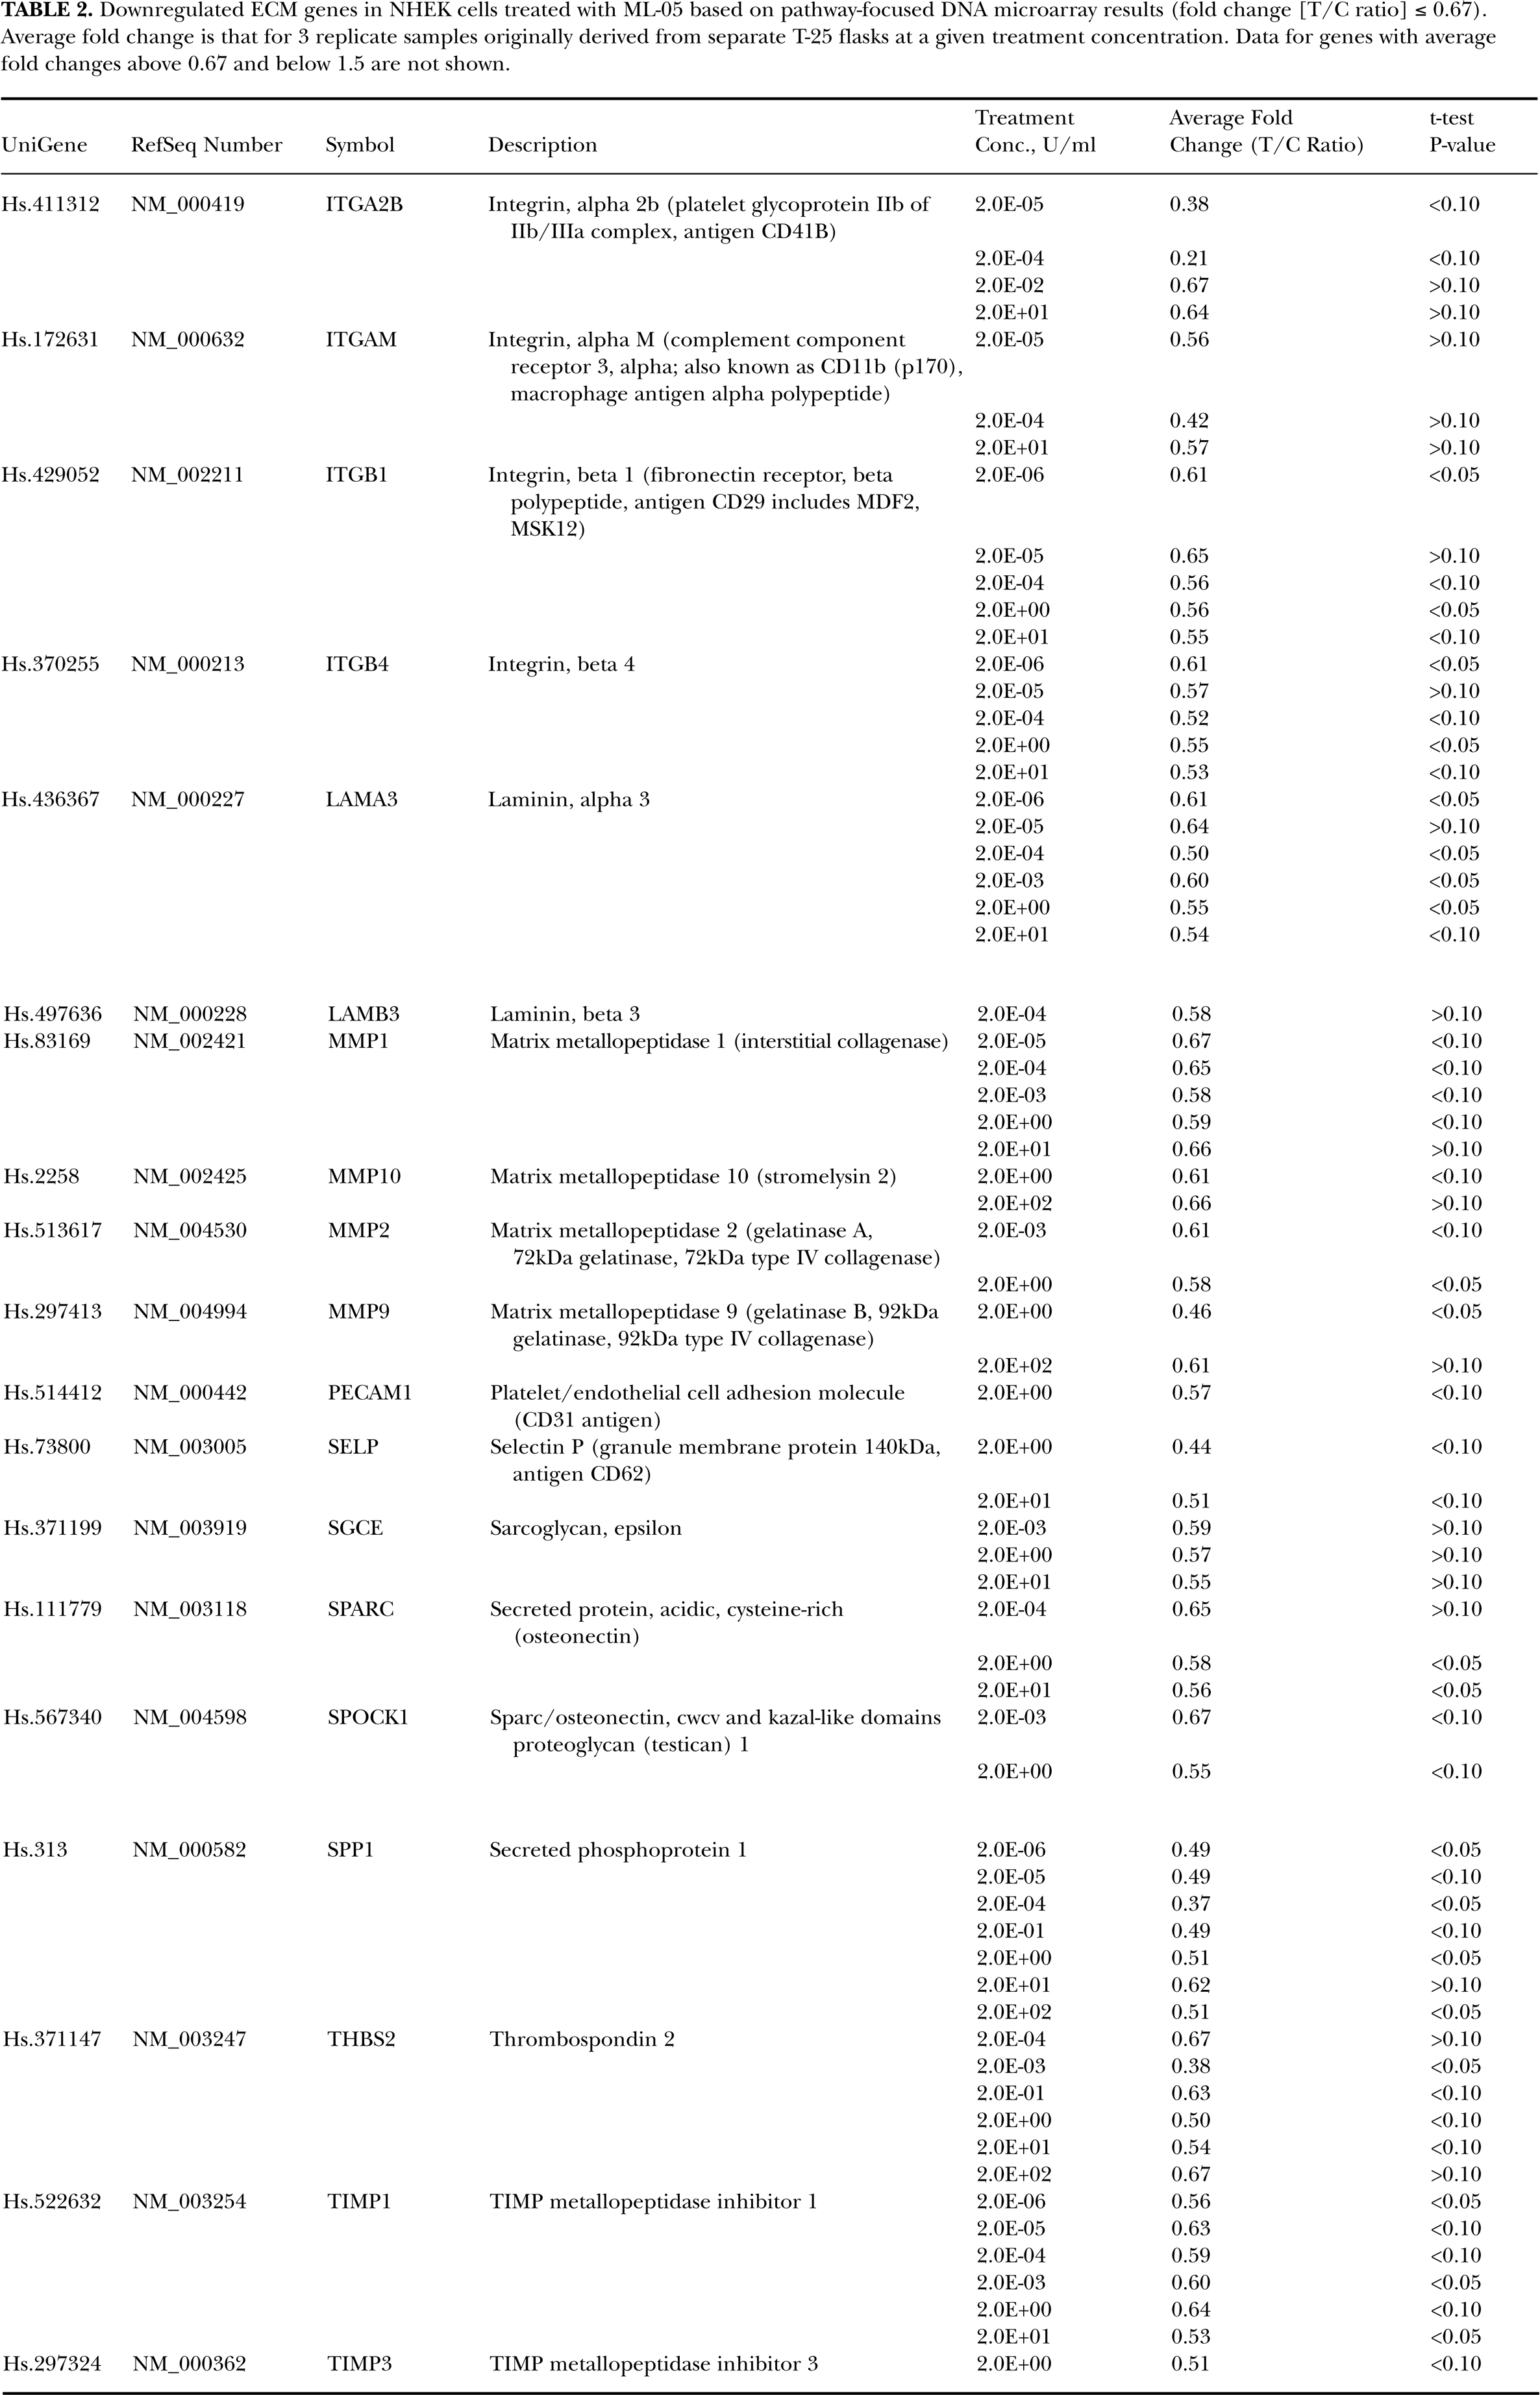
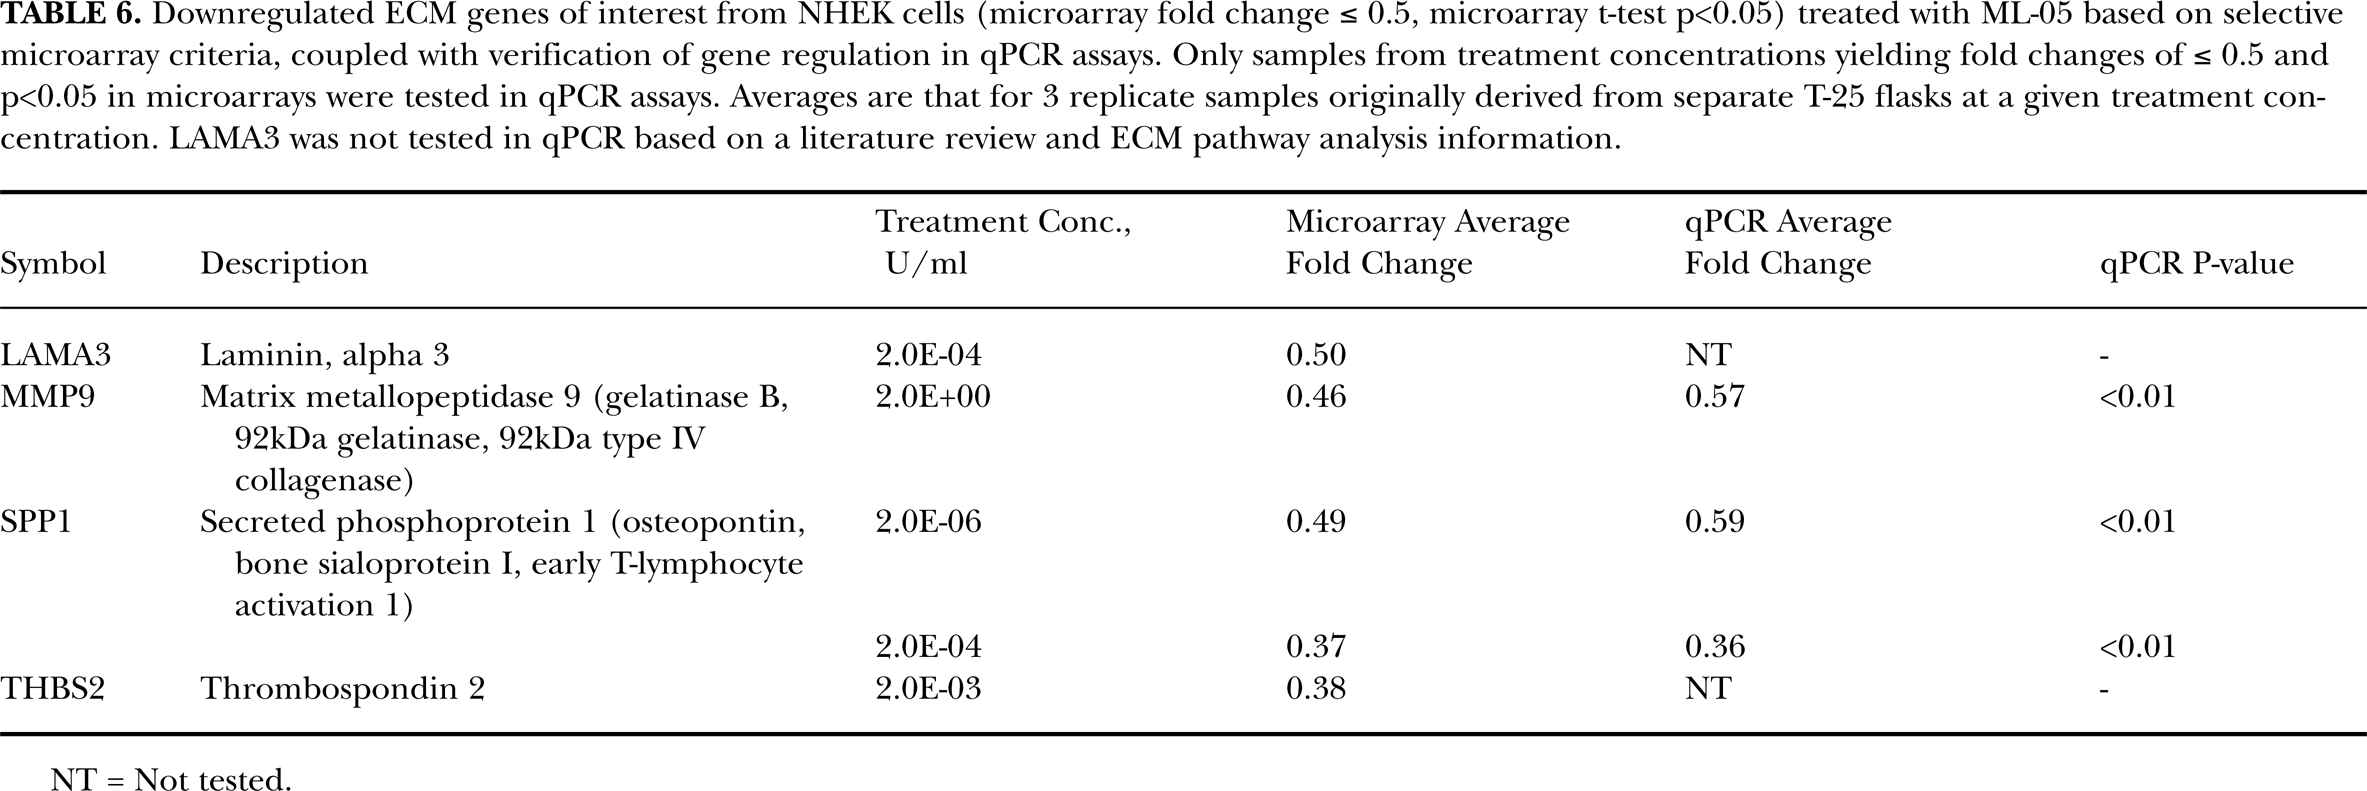
For an overview of the effects of ML-05 treatment on ECM gene expression in NHEK cells, initial (first-pass) evaluations of the results considered fold changes in preference to t-test results. Tables 1 and 2 list quantitative data (treatment concentrations, fold changes and t-test p values) for the upregulated and downregulated ECM genes of interest, respectively, resulting from the treatment of NHEK with ML-05 based on 1.5-fold (50%) or greater changes (increase/decrease) in treatment:control gene expression ratios (T/C ratios). There were 18 upregulated genes (Table 1) and 19 downregulated genes (Table 2). The upregulated and downregulated genes at each treatment concentration are shown in Tables 3 and 4, respectively. There were no instances of any of the 27 genes being upregulated at one or more treatment concentrations and downregulated at other concentrations. Figure 2 shows the numbers of upregulated and downregulated genes obtained at each treatment concentration. The data indicate a biphasic relationship between treatment concentration and gene regulation at the single 24-hour time point. Once t-tests were taken into account, there were 9 each of the upregulated and downregulated genes at p<0.05 (Tables 1 and 2). Further selectivity was applied using a combination of 2-fold changes and p<0.05. This yielded 6 upregulated and 4 downregulated genes of interest in NHEK cells exposed to ML-05, which are shown in Tables 5 and 6, respectively. Figure 3 is a volcano plot of 6 of the regulated genes that were subsequently verified using qPCR methodologies. (All tables and figures are presented after the References section.)

Numbers of upregulated (circle) and downregulated (square) ECM genes in microarrays as a function of ML-05 treatment concentration, based on fold change ≥ 1.5 (upregulated) or ≤ 0.67 (downregulated).
Volcano plots of 6 specific genes of interest highlighting the upregulation and downregulation of these genes by ML-05 at all 9 treatment concentrations. Upregulated genes are VCAN (square), ICAM1 (X), CTGF (triangle) and CD44 (diamond). Downregulated genes are MMP9 (star) and SPP1 (circle). These results highlight the subtle regulatory effects of ML-05 on these 6 genes of interest, based on both fold change and statistical significance.
Upregulated ECM genes in NHEK cells treated with ML-05 based on pathway-focused DNA microarray results (fold change [T/C ratio] ≥ 1.5). Average fold change is that for 3 replicate samples originally derived from separate T-25 flasks at a given treatment concentration. Data for genes with average fold changes above 0.67 and below 1.5 are not shown.

Downregulated ECM genes in NHEK cells treated with ML-05 based on pathway-focused DNA microarray results (fold change [T/C ratio] ≤ 0.67). Average fold change is that for 3 replicate samples originally derived from separate T-25 flasks at a given treatment concentration. Data for genes with average fold changes above 0.67 and below 1.5 are not shown.
Upregulated ECM genes of interest from NHEK cells (microarray fold change ≥ 1.5) as a function of ML-05 treatment concentration. (Gene descriptions and quantitative microarray data are shown in Table 1.)

Downregulated ECM genes of interest from NHEK cells (microarray fold change ≤ 0.67) as a function of ML-05 treatment concentration. (Gene descriptions and quantitative microarray data are shown in Table 2.)

Upregulated ECM genes of interest from NHEK cells (microarray fold change ≥ 2.0, microarray t-test p<0.05) treated with ML-05 based on selective microarray criteria, coupled with verification of gene regulation in qPCR assays. Only samples from treatment concentrations yielding fold changes of ≥ 2.0 and p<0.05 in microarrays were tested in qPCR assays. Averages are that for 3 replicate samples originally derived from separate T-25 flasks at a given treatment concentration. CNTN1 was not tested in qPCR based on a literature review and ECM pathway analysis information.

NT = Not tested.
Downregulated ECM genes of interest from NHEK cells (microarray fold change ≤ 0.5, microarray t-test p<0.05) treated with ML-05 based on selective microarray criteria, coupled with verification of gene regulation in qPCR assays. Only samples from treatment concentrations yielding fold changes of ≤ 0.5 and p<0.05 in microarrays were tested in qPCR assays. Averages are that for 3 replicate samples originally derived from separate T-25 flasks at a given treatment concentration. LAMA3 was not tested in qPCR based on a literature review and ECM pathway analysis information.
NT = Not tested.
Verification of Microarray Genes of Interest using qPCR
Seven representative genes of interest from NHEK cells that were identified as being upregulated (CD44, VCAN, CTGF, ICAM1 and ITGA4) or downregulated (MMP9 and SPP1) in the pathway-focused DNA microarrays were selected for verification using qPCR. Results of qPCR assays for these genes are shown in Tables 5 and 6. VCAN (CSPG2), ICAM1 and CTGF were verified as upregulated at 3 of 4, 2 of 4 and 1 of 3 treatment concentrations, respectively. However, CD44 and ITGA4 were not verified as upregulated in qPCR assays (2 and 1 treatment concentrations, respectively). Both genes of interest that were downregulated in the microarrays, MMP9 and SPP1, were verified as downregulated by qPCR.
DISCUSSION
Genomics experiments employing pathway-focused DNA microarrays were conducted to determine the effects of in vitro ML-05 exposure on the expression of ECM genes in NHEK cells. The initial findings, based on fold changes of ≥ 1.5 alone to be all-inclusive, revealed 18 upregulated and 19 downregulated genes at one or more ML-05 concentrations, for a total of 37 out of 113 genes that were differentially expressed in the ECM microarray (33%). The majority of fold changes were less than 2.0, indicating that ML-05 treatment had modest or subtle quantitative effects on gene expression. These subtle effects could also be visualized in the volcano plot for all genes (Figure 1) as well as in the volcano plot for key genes of interest (Figure 3). With respect to the effects of ML-05 concentration on gene expression, a dose-response plot of the numbers of upregulated and downregulated genes as a function of treatment concentration was biphasic in nature (Figure 2). The effects of multiple exposure times were not investigated in these studies, as this experiment was designed only to test multiple (nine) concentrations of ML-05 at a single time point (24 hours). Of particular interest was that the two concentrations at which the fewest genes were upregulated or downregulated (0.02 and 0.2 units/ml) did cause in vitro keratinocyte migration and proliferation and on ex vivo wound healing in a previous study (Tomic-Canic et al. 2007). Accordingly, it would be useful to conduct a separate time-course experiment to determine the effects of shorter ML-05 exposures (e.g., 15 minutes to 12 hours) at selected concentrations on ECM gene regulation.
The application of t-tests for statistical significance (p<0.05) reduced the numbers of regulated genes to 9 upregulated and 9 downregulated (accounting for 16% of the microarray genes). Thus, about half of the upregulated and downregulated genes that met the selected 1.5-fold-change criteria did not achieve statistical significance (p<0.05). This may reflect both the variability obtained between replicates using these microarray methodologies and the modest fold changes obtained with ML-05 treatment. These data suggest that these types of microarray assays should be performed using more than three replicates per treatment concentration and time point. On the other hand, the majority of differentially regulated genes of interest in the microarrays (based on fold changes of 1.5 or greater) were active at more than one treatment concentration (see Tables 1–4 and Figure 3). It is also noted that no genes were upregulated at one or more treatment concentrations and downregulated at other concentrations. This indicates a degree of consistency for the regulated genes at different ML-05 treatment concentrations, despite the nonlinear dose-response relationships encountered at the single 24-hour exposure time.
The use of more selective fold-change criteria (≥2.0) yielded 6 upregulated and 4 downregulated genes of interest, which represented 9% of the genes in the microarray and thus provided the primary focus for verification using PCR methodologies. Based on a combination of a) the pathway-focused DNA microarray results, b) a review of the literature on ECM genes and c) ECM information obtained via pathway analysis software, 7 representative genes of interest from NHEK cells that were identified as being upregulated (CD44, VCAN, ICAM1, CTGF and ITGA4) or downregulated (MMP9 and SPP1) in the microarrays were selected for data verification using qPCR. The qPCR assays established upregulation of VCAN, ICAM1 and CTGF and downregulation of both MMP9 and SPP1 in NHEK cells exposed to ML-05. As with the microarrays, fold changes for active samples were modest, with average fold changes ranging from 1.3–2.5 for upregulated genes and from 0.6–0.3 for downregulated genes. As such, the qPCR results provide further evidence of the subtle nature of the effects of ML-05 on the regulation of specific genes of interest. While CD44 upregulation was observed in the microarray results, its upregulation was not verified by qPCR. The discrepancy between the microarray and PCR results for CD44 may be related to a splice variant issue, as CD44 mRNA is known to undergo alternative splicing to yield splice variants (Hirano et al. 1994; Bell et al. 1998). It has been noted in the literature that false-negative results for CD44 can be obtained by RT-qPCR, and recommended that CD44 upregulation should be demonstrated by other methods (Chen and Wang, 2000). CD44 was previously shown to be upregulated in NHEK cells by ML-05 treatment using immunohistochemical methods (Mamber et al. 2004). Accordingly, the combination of immunological and microarray data provide the evidence that CD44 is upregulated by ML-05. ITGA4 also was not verified as upregulated by qPCR.
VCAN encodes versican (also known as chondroitin sulfate proteoglycan 2; VCAN is an updated nomenclature for the CSPG2 gene), and is an anti-adhesion molecule involved in cell migration and proliferation (Wight 2002; Wu et al. 2005; Rahmani et al. 2006). Versican interacts with hyaluronan in maintaining the structural and functional integrity of the ECM, as does CD44, which encodes the hyaluronan receptor (Mamber et al. 2004; Aruffo et al. 1990; Lesley et al. 1993; Cichy and Puré, 2003; Wu et al. 2005; Rodgers et al. 2003; Yoon and Halper, 2005). The role of CD44 upregulation by ML-05 in cell migration and proliferation was recognized previously (Mamber et al. 2004; Aruffo et al. 1990; Lesley et al. 1993; Cichy and Puré, 2003; Johnson et al. 2000; Rilla et al. 2002; Boraldi et al. 2003; Karvinen et al. 2003; Tammi et al. 2005). However, based on the combined microarray and qPCR results of the present studies (with 3 of 4 tested samples verified as upregulated), VCAN may be the more prominent of the hyaluronan-related genes upregulated in ML-05-treated NHEK cells. The upregulation of Intercellular adhesion molecule-1 (CD54), the ICAM1 gene product, can also facilitate wound healing by promoting keratinocyte migration (Nagaoka et al. 2000; Yukami et al. 2007). CTGF encodes connective tissue growth factor, an ECM protein that contributes to cell migration and proliferation, and to the production of certain proteins such as integrins (Mercurio et al. 2004; Burgess, 2005; Rachfal and Brigstock, 2005; Heng et al. 2006). Thus, all three of the qPCR-verified upregulated NHEK genes, VCAN, ICAM1 and CTGF, along with CD44 (whose upregulation was previously established by immunohistochemical methods), can be related to keratinocyte migration and proliferation. This provides a mechanistic basis for the ML-05-induced enhancement of keratinocyte migration and proliferation that was observed in experiments employing in vitro wound scratch assays (Tomic-Canic et al. 2007). With respect to the downregulation of genes in NHEK cells treated with ML-05, matrix metalloproteinase gene MMP9 was downregulated both in the microarrays and in qPCR assays. Metalloproteinase genes MMP1, MMP2 and MMP10 were also downregulated in the microarrays at several concentrations, but the combination of fold changes and t-test results did not meet the criteria established for qPCR verification. For example, the strongest microarray results for MMP2 (T/C ratio of 0.58, p<0.05) was slightly above the activity criteria established for these studies. The protein encoded by MMP9, matrix metalloproteinase 9 (also known as gelatinase B), acts by degrading certain types of proteins within the ECM (gelatin and type IV collagen in particular) as well as certain receptor proteins at the surface of the cell (Opdenakker 1997; Nguyen et al. 2001; Opdenakker et al. 2001). Although MMPs in general have a role in tissue remodeling, some have been involved in pathological processes (Giannelli et al. 1996; Crowe and Brown, 1999; Bellosta et al. 2003; Lakka et al. 2003; El-Shabrawi et al. 2004; Kim et al. 2005; Jansen et al. 2007). By protecting key ECM proteins from proteolytic cleavage, downregulation of MMP9 (and other MMPs, notably, MMP2) may have utility in the treatment of pathological conditions such as fibrosis in which MMPs may be involved (Giannelli et al. 1996; Crowe and Brown, 1999; Bellosta et al. 2003; Lakka et al. 2003; El-Shabrawi et al. 2004; Kim et al. 2005; Jansen et al. 2007). Moreover, MMP9 can be downregulated through the interaction of CD44 and hyaluronan (Spessotto et al. 2002). CTGF also is capable of modulating the production of both matrix metalloproteinases and tissue inhibitors of metalloproteinases within the ECM (Brigstock 2002; Black et al. 2003). Accordingly, it is speculated that ML-05 treatment could result in the preferential downregulation of MMP9, as well as down-regulating the activity of other detrimental MMPs. SPP1, the other gene of interest whose downregulation was verified by RT-qPCR, encodes secreted phosphoprotein type 1, commonly known as osteopontin. This ECM glycoprotein is upregulated in inflammatory responses as well as in autoimmune diseases (Collins et al. 2004; Pardo et al. 2005). The downregulation of SPP1 is known to decrease inflammation and fibrosis (Mori et al. 2008).
It was observed that 9 of the 18 upregulated genes encoded different types of collagens, although selectivity criteria excluded these from qPCR verification. However, this potential upregulation may explain a finding from a previous in vivo experiment involving the effects of ML-05 on collagen levels in the tight skin (Tsk) mouse model of scleroderma (Mamber et al. 2004). Hydroxyproline levels (a measure of collagen concentration) in skin samples from the ML-05 treatment group of Tsk mice averaged 43% higher relative to that in the saline control group at 4 and 5 months post-treatment initiation. Then, a 25% decrease in hydroxyproline levels was obtained in samples from the ML-05 treatment group relative to the control group at 6–8 months. These differences led to speculation that ML-05 could promote the synthesis of new collagen along with the loss of fibrotic collagen structures. The current microarray results for the collagen genes, if confirmed in subsequent studies, may provide some evidence that ML-05 treatment can facilitate fresh collagen synthesis in addition to its other biological effects.
In summary, treatment of NHEK cells with ML-05 resulted in the upregulation of several ECM genes (notably VCAN, CD44, ICAM1 and CTGF) whose encoded proteins are directly involved in promoting keratinocyte migration and proliferation. ML-05 also downregulated MMP9 and SPP1, which encode proteins with potentially detrimental roles in wound healing. These results provide a mechanistic basis for explaining how ML-05 could promote keratinocyte migration, proliferation and other activities related to ECM organization and wound healing. It is hypothesized that the regulation of these genes by ML-05 could effect physiological changes in the keratinocytes that may ultimately result in a restoration of normal ECM organization during the wound healing process. Further experiments are being conducted to confirm the regulatory effects of ML-05 on the genes of interest identified in these studies. In addition to the regulation of the above-named ECM genes and other genes of interest, ML-05 treatment of NHEK cells also may affect the expression of specific cytokine, chemokine and related immune response genes that are associated with wound repair. Experiments to evaluate the effects of ML-05 on immune response gene expression, as well as investigations using other types of cells, such as normal human dermal fibroblasts and peripheral blood mononuclear cells, are also being conducted. ML-05 treatment appears to regulate the expression of specific ECM genes in complex yet logical ways. It is possible that relationships can be established between the ECM and immune response proteins encoded by the respective genes of the different types of cells that are involved in wound healing processes.
Footnotes
ACKNOWLEDGEMENTS
The authors wish to thank A. E. Dahlberg, S. A. Gregory, R. Belardinelli, S. Pond-Tor, C. Schorl and W. Atwood of Brown University for providing access to a concentrator, hybridization oven, pathway analysis software, and for other technical support. The authors also wish to thank L. Martin and B. Jenkins of the University of Rhode Island and J. Boylan and P. Gruppuso of the Women and Infants Hospital of Rhode Island for providing CCD cameras to visualize and record the microarray results. This research is based in part upon work conducted using the Rhode Island Genomics and Sequencing Center which is supported in part by the National Science Foundation under EPSCoR Grant No. 0554548.