
Abstract
The DCFH assay is commonly used for measuring free radicals generated by engineered nanomaterials (ENM), a well-established mechanism of ENM toxicity. Concerns exist over susceptibility of the DCFH assay to: assay conditions, adsorption of DCFH onto ENM, fluorescence quenching and light scattering. These effects vary in magnitude depending on ENM physiochemical properties and concentration. A rigorous evaluation of this method is still lacking. The objective was to evaluate performance of the DCFH assay for measuring ENM-induced free radicals. A series of diverse and well-characterized ENM were tested in the acellular DCFH assay. We investigated the effect of sonication conditions, dispersion media, ENM concentration, and the use of horseradish peroxidase (HRP) on the DCFH results. The acellular DCFH assay suffers from high background signals resulting from dye auto-oxidation and lacks sensitivity and robustness. DCFH oxidation is further enhanced by HRP. The number of positive ENM in the assay and their relative ranking changed as a function of experimental conditions. An inverse dose relationship was observed for several Carbon-based ENM. Overall, these findings indicate the importance of having standardized assays for evaluating ENM toxicity and highlights limitations of the DCFH assay for measuring ENM-induced free radicals.
INTRODUCTION
Extensive scientific research and investments have been made in the field of nanotechnology, leading to high rate, high volume manufacturing of a variety of engineered nanomaterials (ENM). It has been estimated that the production of ENM would increase approximately 25 fold from a few thousand tons produced today to 58,000 tons by 2020 (Maynard 2006; Nastassja et al. 2008) with possible applications in a range of diverse fields, from development of advanced materials, novel devices in the fields of medicine, biotechnology, energy, environmental remediation to their use in consumer products (Zhang 2003; Salata 2004; Raimondi et al. 2005). In respose to this reality, a broad consensus is being built to conduct adequate environmental, health and safety evaluations of these novel ENM at an early stage of materials/product development. Major efforts are underway on developing reliable and predictive nanotoxicity screening approaches based on proven toxicological pathways (Meng et al. 2009; Donaldson et al. 2010). Given the variability in ENM physicochemical properties (e.g. surface area, surface charge, morphology, and surface chemistry) and the large number of resulting combinations, the challenge of timely evaluation of their toxicity can only be met with high throughput, low cost, screening assays (Ayres et al. 2008; Bello et al. 2009; Lu et al. 2009; Meng et al. 2009; Xia et al. 2009). Although how this will be accomplished is still unresolved, it is likely that a platform of standardized tests, spanning various possible toxicological pathways, may be needed in order to predict the overall toxicity potential of ENM.
Oxidative stress (OS) has been recognized in vivo and in vitro systems as one such major pathway and is being explored for ENM toxicity screening purposes (Nel et al. 2006; Xia et al. 2006; Borm et al. 2007; Ayres et al. 2008; Rogers et al. 2008; Bello et al. 2009; Lu et al. 2009; Meng et al. 2009). OS has been linked to pathogenesis of several diseases, including neurodegenerative diseases (Calabrese et al. 2006), arthrosclerosis (Hsiai and Berliner 2007; Bonomini et al. 2008), cancer (Lau et al. 2008; Mates et al. 2008; Nishikawa 2008), diabeties mellitus (Bekyarova et al. 2007; Forbes et al. 2008), hypertension, (Paravicini and Touyz 2008), and other inflammatory conditions. OS has also been implicated as an important pathway in metal toxicity (Valko et al. 2005; Valko et al. 2006), and several commercially important classes of ENM are either metals or metal oxides themselves or contain significant amounts of metal catalysts (such as CNTs).
Several assays relying on the detection of free radicals generated in the test system have been employed for OS screening. The DCFH, ESR and DTT are commonly used assays for quantitating ROS elicited by ENM (Sauvain et al. 2008). The DCFH assay has been around since 1940s and has been used for measuring several endpoints, such as determining monoamine oxidase activity (Degli-Esposti et al. 2001), serum uric acid and glucose concentrations (Kato et al. 1979) and identify spermine in seminal stains (Suzuki et al. 1980). An excellent summary of the DCFH assay history and applications has been published recently (Chen et al. 2010). Modified variants of the DCFH assay have also been used for nanotoxicity studies in a cell-free (acellular) environment and on a variety of cell lines (Wilson et al. 2002; Arbab et al. 2003; Manna et al. 2005; Foucaud et al. 2007; Doak et al. 2009; Lu et al. 2009; Xia et al. 2009). Because DCFH detects a wide range of ROS (RO2, RO, OH., HOCl and ONOO but not O2 − and H2O2), it is simple and inexpensive to set up and offers 96-well plate automated capabilities, it has gained popularity for measuring ROS induced by ENM (Doak et al. 2009).
The DCFH assay, like most of the other conventional colorimetric (dye-based) assays that have been used for ENM toxicity evaluations (such as 3-(4,5-dimethylthiazol-2-yl)-2,5-diphenyltetrazolium bromide (MTT), 2-(4-iodophenyl)-3-(4-nitrophenyl)-5-(2,4-disulfophenyl)-2H-tetrazolium (WST-1), Neutral Red and Alamar Blue™) were originally standardized and optimized for chemical compounds and were adopted with little modifications and method evaluation for ENM. Because of the fundamental differences in the physicochemical properties and behavior between ENM and organic molecules, the assumption that ENM can be tested similarly to other chemicals needs to be proven and anecdotal evidence is building up against the DCFH assay (Doak et al. 2009). Interaction of these indicator dyes with carbon-based ENM may provide erroneous results (Hurt et al. 2006; Monteiro-Riviere and Inman 2006; Wörle-Knirsch et al. 2006; Belyanskaya et al. 2007; Casey et al. 2007; Monteiro-Riviere et al. 2009), which raises concerns over applicability of the organic dye-based assays for ENM toxicity evaluations (Casey et al. 2007). Unreliable assays may generate confusion caused by conflicting and irreproducible data, and questioning of the utility of OS as a marker for nanotoxicity evaluations.
The DCFH assay provides a measure of several ROS and RNS species and is useful when such a global metric is desirable, such as for toxicity screening. Its utility is more constrained for mechanistic studies; such as if one needs to measure specific ROS/RNS radicals and identify their source/origin (Tarpey and Fridovich 2001; Doak et al. 2009). The DCFH, however, suffers from several well-known problems (Chen et al. 2010). One major problem intrinsic to the DCFH is its unstable nature. The DCFH dye is slowly oxidized to the fluorescent DCF species in air and is also prone to photo-oxidation by the laser light utilized for fluorescence excitation. Thus, DCFH detection can generate false-positive results (Sarvazyan 1996; Wang and Joseph 1999) and background values increase with time. A summary of potential sources of error in the DCFH assay is provided in Table 1.
In this study, we look systematically at several factors (summarized in Table 1) that may compromise the DCFH performance for ENM ROS measurement, including: the type of nanomaterial, ENM concentration, sonication conditions, dispersion media, and the effect of horseradish peroxidase (HRP) on the DCFH stability and ROS generation. HRP has been added to ENM to mimic the cellular conditions of ROS production (Foucaud et al. 2007; Jiang et al. 2008; Rothen-Rutishauser et al. 2010). This paper provides multiple lines of evidence that the DCFH assay is susceptible to several experimental parameters and that in its current format the assay is not well suited for ENM ROS measurements.
Potential errors can be introduced at various steps of the DCFH assay when it is used for the measurement of reactive oxygen species generated by engineered nanomaterials (ENMs). We grouped them into three broad steps: (i) Preparation of ENM dispersions; (ii) Interaction of ENM with the assay measurement principle; and (iii) System interdependence on nanomaterial properties.

Although important, dispersion is a generic issue for ENM and not specific to DCFH.
MATERIALS AND METHODS
Chemicals and reagents
The 2′-7′-DiChlorofluorescein Diacetate (DCFH-DA) dye, NaOH, Phosphate Buffer Saline (PBS), H2O2, Bovine serum albumin (BSA), Horseradish peroxidase (HRP) and Triton X-100 were obtained from Sigma–Aldrich (Sigma, St. Louis, MO). Methanol was purchased from Burdick and Jackson (Muskegon, MI, USA). All chemicals were of analytical grade and were used as received.
Nanomaterials
For the purpose of investigating the DCFH response to different ENM types, a well characterized set of 19 materials of commercial importance and with a broad range of physicochemical properties, were selected. The ENM used in the study, are summarized in Table 2. The materials together with their sources and specifications have been described previously by us (Bello et al. 2009) and included a series of carbon blacks, a series of fullerenes, a series of titanium dioxides (nano- and micron-sized anatase and rutile), a series of single and multi-wall carbon nanotubes (CNTs) of variable length and purity, H2O2-oxidized single wall carbon nanohorns (SWCNHs-ox), nano alumina, nano silver, and micron-sized crystalline silica. For simplicity, we will refer to the whole set of materials under investigation as ENM, although some are microscopic.
Physicochemical characterization
The initial set of 19 ENM has been previously reported (Bello et al. 2009) and includes: Specific Surface Area (SSA), total and water-soluble transition metals, organic and elemental carbon (OC/EC), surface charge in PBS saline and crystalinity. Procedures for each characterization technique are detailed in Bello et al. 2009.
Dispersion of Nanomaterials
Efficient dispersion of ENM at or near the primary particle size dimensions remains a serious challenge and different ENM classes may require different protocols for best dispersion. Because sonication itself may introduce artifacts (such as the generation of free radicals, modification of the dispersion medium and the ENM themselves), it is important that all ENM to be tested for comparative evaluations get dispersed under the same protocol. Initial work investigated dispersion efficiency of the whole ENM set in two dispersion media, one analogous to a biologically relevant medium of 1% wt. BSA/0.9 wt % NaClaq (Bihari et al. 2008) and the other in the chemical surfactant 0.07% wt. Triton X-100 (Hilding et al. 2003; Moore et al. 2003; Saran et al. 2004). For this study three independent stock solutions of 0.8-1.0 mg/mL were prepared for each ENM in each medium on different days and each stock was assessed at least three times in triplicates. That is a minimum of nine measurements were available for each ENM/condition combination. Sonication to prepare dispersions was performed using a 400 W Branson 450D sonifier with a 550 dismembrator. In our work, three distinct dispersion conditions were investigated: (i) ENM dispersed in 1% BSA / 0.9 % NaCl(aq) for 12 min with cup sonication (∼90W), (ii) ENM dispersed in 1% BSA / 0.9% NaCl(aq) for 10 min with 30 sec cycle at 30% amplitude probe sonication (∼200W); and (iii) ENM dispersed in 0.07% Triton X-100 for 10 min with 30 sec cycle at 30% amplitude probe sonication (∼200W). The scintillation vials containing ENM solutions were kept in ice and capped during the whole cup sonication process, whereas for probe sonication vials were kept in ice uncapped. Because the primary purpose of this set of experiments was to investigate the magnitude of susceptibility of the assay to sonication/dispersion conditions (which continues to be a non standardized process) and not a strict comparison of dispersion protocols, some variations in the sonication cycle settings were deemed acceptable.
Dispersion efficiency of ENM in each dispersion condition was determined in triplicate by taking intensity weighted particle size measurements using a dynamic light scattering (DLS) Malvern Zetasizer Nano-ZS instrument. The Zetasizer is equipped with a monochromatic coherent 4mW Helium Neon laser (λ = 633 nm) with a 173° scattering angle and with a non-invasive back-scatter (NIBS) technology for increasing particle size sensitivity. The measurements are reported as the z-average hydrodynamic diameter (d h,z ave) and the particle size polydispersity index (PDI), which is a measure of the broadness of the particle size distribution. The PDI scale ranges from 0 to 1, with 0 being monodisperse and 1 being polydisperse (Bihari et al. 2008). The measurements were performed within 5 minutes after sonication, and before and after each measurement, the electrophoretic cell was washed with distilled and deionized water to prevent cross contamination. The temperature of the laboratory was kept at 22 ± 2.5 °C during all experiments. In brief, during DLS measurements the particles are subjected to Brownian motion. This is compensated by normalization of the electric field autocorrelation function, of which the cumulative analysis is used to obtain the z-average hydrodynamic diameter (d h,z ave). The autocorrelation function is calculated by the Stokes–Einstein equation with the diffusion coefficient determined from the decay time of autocorrelation function. In addition there is certain probability that the light scattered by larger particles will swamp the light scattered by smaller particles since the light intensity of a scattered particle is proportional to the diameter in the sixth power. That means that larger particles are overestimated in the dispersions. For this reason the change of d h,z ave with ultrasonic treatment time shows only a trend in the change of particle size (Krause, et. al., 2010).
The Acellular DCFH assay
We used the modified DCFH method as described in previous publications (Foucaud et al. 2007; Bihari et al. 2008) for dispersion, as well as the ROS measurements. Briefly, in the DCFH assay 15 μl of 1 mM DCFH-DA dye was chemically hydrolyzed to DCFH with 50 μl of 0.01N NaOH in each well of 96-well ELISA plate. The reaction plate was placed in dark at room temperature for 30 minutes. Following hydrolysis of DCFH-DA, 170 μl of 0.1M PBS was added in the 96-well plates. Then, ENM solution was spiked in triplicates to give a final concentration of 0.1, 0.3, or 0.5 mg/mL in wells. Alongside, a blank (no ENM added) and a positive control (H2O2) were used in the assay, both in triplicates. In the wells containing H2O2, HRP (0.01U) was added. No HRP was added to wells containing ENM. After addition of HRP to the H2O2 wells (positive controls and calibration standards), the plate was placed on ice and assayed rapidly. The fluorescence generated by the DCFH oxidation was measured continuously for 120 min at 485 nm excitation and 530 nm emission both with a slit-width of 10 nm under constant agitation condition and constant temperature of 37 °C. Readings were taken at time zero and every 10 min intervals for 120 min. The data reported is for 90 min reaction time-frame, a decision that was based on initial reaction kinetics evaluations. Fluorescence values obtained for ENM were converted to H2O2 equivalents against a calibration curve of H2O2 in the range of 0–1000 μM H2O2 with an r2 = 0.999. This conversion is not necessary for the purpose of the paper. However, conversion of arbitrary fluorescence units to a biologically meaningful ROS value is desirable and one approach used for ENM is conversion in H2O2-equivalents (Foucaud et al. 2007; Jiang et al. 2008; Lu et al. 2009). Because H2O2 cannot oxidize DCFH independently, the enzyme HRP is added to catalyze generation of OH radicals. Therefore, HRP was added only when H2O2 was used as positive control and for the standards.
Effect of HRP on DCFH oxidation
Considerable discrepancies and confusion exists in the literature with regards to the practice of adding HRP to ENM, its concentration, and the sequence of events with regards to its use (when exactly is HRP added in reaction mixture). We have not found convincing scientific rationale for addition of HRP to ENM. Since oxidation of DCFH by HRP has been reported over a decade ago (Rota et al. 1999a; Rota et al. 1999b), this raises concerns over its use in the DCFH assay for ROS measurements of ENM. It has also been reported that the HRP catalytic activity may be modulated (deactivated or enhanced) by several transition metals (e.g. Mn, Co, and Ni), which are common in carbon nanotubes and other metal oxides (Mahmoudi et al. 2003). Therefore, a systematic investigation of the effect of HRP on DCFH was undertaken. HRP effect (0.01U final concentration) was investigated on blanks (no ENM added) under different conditions, including the sequence of adding HRP and sonication. Several experiments were grouped into three broad conditions: effect of HRP on blanks with and without sonication and effect of event sequence of HRP addition. As an illustration, we investigated the DCFH fluorescence of blanks when reagents were added in the following order: (i) DCFH, NaOH, PBS; (ii) DCFH, NaOH, PBS plus HRP; and (iii) DCFH, NaOH, PBS, HRP + dispersant (BSA or Triton X-100) plus sonication.
Statistical Analysis
Experimental data was investigated for normality of distributions and differences in means between test systems were analyzed via two-sided t-test, analysis of variance ANOVA, correlation and regression using SPSS v18 (SPSS Inc., Chicago. IL, USA). The error bars in DCFH response figures represent the 95% Confidence interval (CI) of at least three independent ENM dispersions tested in triplicate.
RESULTS
Effect of HRP on DCFH oxidation
Results of the investigation of HRP on DCFH response are summarized in Figure 1. For blanks without HRP (experiment 1, 4 and 7) the DCFH response is comparable at ∼ 100 μM H2O2 eq. and notably lower than for all other experiments that involved HRP. Addition of HRP to blanks increased fluorescence response by ∼4-5 times regardless of sonication (experiments 2 and 3 vs. 5 and 6 relative to 1, 4, and 7). The worst situation was observed for experiment 8 (addition of HRP in Triton X-100 dispersion media followed by sonication). The sequence of events apparently may be important in some circumstances (e.g. experiment 8 vs. 9) but not others (2 and 3 vs. 5 and 6). Dispersion medium also plays a significant modifying role on the effect of HRP on DCFH as can be clearly seen in the differences between 1%BSA/0.9%NaClaq medium (experiments 5 and 6) and Triton X-100 (experiments 8 and 9). HRP is undoubtedly involved in DCFH oxidation and the magnitude of the effect spans approximately an order of magnitude compared to blanks without HRP, depending on the experimental conditions. Based on these results we could not justify the addition of HRP onto ENM for ROS measurements.

Effect 0.01U of HRP on DCFH oxidation of blanks (no nanomaterials involved) under different conditions (sequence of events and dispersion conditions). The label on the X-axis reflects actual sequence of events. HRP is undoubtedly involved in DCFH oxidation and the magnitude of the effect spans approximately an order of magnitude compared to blanks without HRP, depending on the experimental conditions.
Dispersion Efficiency
Dispersion efficiency results for the complete set of 19 ENM in all three conditions are presented in Table 2. The z-average hydrodynamic diameter (d h,z ave) and polydispersity index (PDI) of the dispersions were determined using DLS and were used as a measure of dispersion efficiency. The d h,z ave of all ENM (except TiO2_Rutile in Triton X-100) in each of the three dispersion conditions tested were consistently higher than the primary particle size of ENM. Thus, the particles aggregated and agglomerated considerably in the dispersion conditions. Better dispersions (lower d h,z ave and PDI values) were obtained for the majority of ENM in 1% BSA / 0.9 % NaCl(aq) as the sonication energy increased (cup sonication vs. probe sonication). Using 0.07 % Triton X-100 and high energy probe sonication even better dispersions for ENM were obtained, except for SWCNT_L, TiO2_mR and Al2O3. In general, higher dispersion stability was observed for ENM dispersed in 0.07 % Triton X-100 than for ENM dispersed in 1% BSA / 0.9 % NaCl(aq) irrespective of energy used. (DLS measurements were conducted over 90 min for a few ENM to confirm these interpretations, data not shown).
We obtained d h,z ave and PDI values for the entire carbon black series tested and the distribution of particles was such that 90% or more particles was found in the primary peak. The d h,z ave increased from N110 to N990, reflecting the same trend as their primary particle size. For example, N990 (primary size > 200 nm) had consistently larger d h,z ave values than N550 (44 nm). For the fullerene series, values obtained showed variability both in d h,z ave and PDI due to a high rate of particle agglomeration (due to its strong hydrophobic nature) in solution under all tested conditions. Irrespective of dispersion conditions, high PDI was obtained with < 70% particle found in the primary peak of the particle size distribution (PSD) for Fullerene_purified.
Comparable values were obtained for two SWCNT in all dispersion conditions. For SWCNT_L, however, the d h,z ave value in 0.07 % Triton X-100 was half of that obtained in 1 % BSA / 0.9% NaCl(aq) without any considerable change in PDI but with fluctuations in number of particles in primary peak. In the series of MWCNT tested, values for d h,z ave and PDI consistently decreased for all three MWCNT tested, with a major decrease in both d h,z ave and PDI for MWCNT_L (d h,z ave from 471.6 nm to 124.2nm and PDI from 0.48 to 0.19). SWCNHs-ox had nearly identical values in all three conditions, although there was a small shift in size and PDI in 0.07 % Triton X-100 condition than 1 % BSA / 0.9 % NaCl(aq) conditions.
Dispersion efficiency of different ENMs for three different sonication conditions. These materials have been fully characterized and were previously reported (Bello et al. 2009). Legend: SSA, Specific Surface Area; Z-Ave – Average particle size as measured by DLS; PDI – Poly dispersity index.a Represents the primary peak (90% or more of the overall distribution);b This peak represented primary peak (>75% of the overall distribution).c Represents the primary peak (<75% of the overall distribution).

For the metal oxides series comprising titania, nAg, silica, the d h,z ave decreased for TiO2_nA, TiO2_nR, nAg and silica as shown in Table 2 (going from dispersion in 1 % BSA / 0.9 % NaCl(aq) with cup sonication to dispersion in 0.07 % Triton X-100 with probe sonication). There was no trend in PDI for the same set of ENM. For TiO2_mA, TiO2_mR and alumina both the d h,z ave and PDI show considerable variations depending on the energy and surfactant used for dispersion. As indicated by d h,z ave and PDI values, Triton X-100 with probe sonication gave overall better dispersion stability than the other two dispersion conditions, with the carbon based nanomaterials being better dispersed than the metal oxides.
ROS generation in the DCFH assay
ROS values for all ENM under different dispersion conditions (reported as μM H2O2 equivalents) are presented in Figures 2, 3 and 4. All values are for 0.3 mg/mL of ENM. Data for the other two concentrations (0.1 and 0.5 mg/mL) are presented later. In each figure, the dotted red line indicates the ROS value of the blank (no ENM added) and error bars indicate 95% confidence intervals (95% CI). ENM for which the lower fifth percentile of the distribution was above the red line was considered as a positive result (i.e. the ENM generates ROS, which is statistically significantly greater than the blank value, p<0.05, t-test) on the assay whereas those for which the upper 95th percentile was below the blank were taken to be negative on the assay (i.e. the ENM did not generate ROS values that were higher than the blank; p>0.05, one sided t-test). When the 95% CI of ROS included the red line the test was considered inconclusive, meaning that for a single DCFH measurement (as is commonly done in reality) the ROS value could potentially be positive, although statistically the ENM ROS value was not significantly different than the blank (p>0.05, t-test).
The number of ENM in the positive, negative and inconclusive category varied with the assay conditions. For ENM dispersed in 1% BSA/0.9% NaCl(aq) using cup sonication (Figure 2) there were 4 positive ENM (SWCNT_S, SWCNT_L, MWCNT_S and SWCNH-ox), 13 negatives (the majority of ENM) and 2 inconclusive (MWCNT_L, nAg). For ENM dispersed in 1% BSA/0.9% NaCl(aq) using probe sonication (Figure 3) there were 3 positives (SWCNT_S, SWCNT_L and nAg), 12 negatives and 4 inconclusive (MWCNT_L, MWCNT_S, nano Al2O3). Interestingly, SWCNH-ox, the ENM with the highest response in cup sonication yielded a negative result and the CI interval was narrower. Additionally, nano Ag switched from inconclusive to positive and MWCNT_S switched from positive to inconclusive. For ENM dispersed in Triton X-100 (Figure 4) there were 5 positives (SWCNT_S, SWCNT_L, MWCNT_S, MWCNT_L and SWCNH-ox), 12 negatives and 2 inconclusive (MWCNT_I and nano Ag). Interestingly, SWCNHs-ox gave the highest ROS value again. The CI intervals were generally narrower for this condition, likely reflective of better and more reproducible dispersion.

DCFH ROS generation of 19 ENMs in 1wt.%BSA/0.9wt. % NaClaq dispersed by cup sonication. Only 4 of the 19 ENMs were positive (95% confidence interval above blank value denoted with the red line), 13 were negative and two were inconclusive (MWCNT_L, nano Ag). The positive samples included three CNTs and the SWCNH-ox. Each value represents 3 or more independent sonications, each in triplicates (n≥9).

DCFH ROS generation of 19 ENMs in 1wt.%BSA/0.9wt.% NaCl dispersed by probe sonication. Only 3 of the 19 ENMs were positive (95% confidence interval above blank value denoted with the red line), 12 were negative and four were inconclusive (MWCNT_L, MWCNT_S, nano Al2O3). The positive samples included SWCNT_S, SWCNT_L and nAg. Note also that SWCNH-ox dropped from the strongest signal in cup sonication (Figure 2) to negative. Each value represents 3 or more independent sonications, each in triplicates (n≥9).

DCFH ROS generation of 19 ENMs in 0.7wt.% Triton-X 100 dispersed by probe sonication. Only 5 of the 19 ENMs were positive (95% confidence interval above blank value denoted with the red line), 12 were negative and 2 were inconclusive (MWCNT_I and nano Ag). The positive samples included four CNTs (SWCNT_S, SWCNT_L, MWCNT_S, MWCNT_L) and SWCNH-ox. Each value represents 3 or more independent sonications, each in triplicates (n≥9).
The majority of ENM were consistently negative on the DCFH assay, and this included the series of carbon blacks, fullerenes, titania, crystalline silica, and nano alumina (two out of three tests). Important also is the common observation that the majority of the negative ENM gave results that were consistently lower (up to 2x) than the blank value.
Dose Response of ENM
The dose-response for each ENM was studied at three concentrations: 0.1, 0.3 and 0.5 mg/mL. Here we report results for probe sonication in Triton X-100, the condition with overall better dispersion efficiency and stability, and the data are shown in Figure 5. The first general observation is the lack of a proportional DCFH response with increased ENM dose. The highest ENM dose of 0.5 mg/mL gave consistently a much lower response that the lowest dose (0.1 mg/mL). The 0.3 mg/mL dose gave responses that were slightly higher than the 0.1 mg/mL dose for some materials (metal/metal oxides) but not others (mostly carbon based ENM). For several carbon based ENM (carbon blacks, fullerenes, several CNTs), an inverse DCFH response is seen with increasing concentration (e.g. N110, F_soot, SWCNT_L). ENM with higher SSA tended to give a higher magnitude of decrease in the response (e.g. SWCNT_L vs. SWCNT_S vs. N110 with SSA of 510.5, 343, and 110 m2/g, respectively.
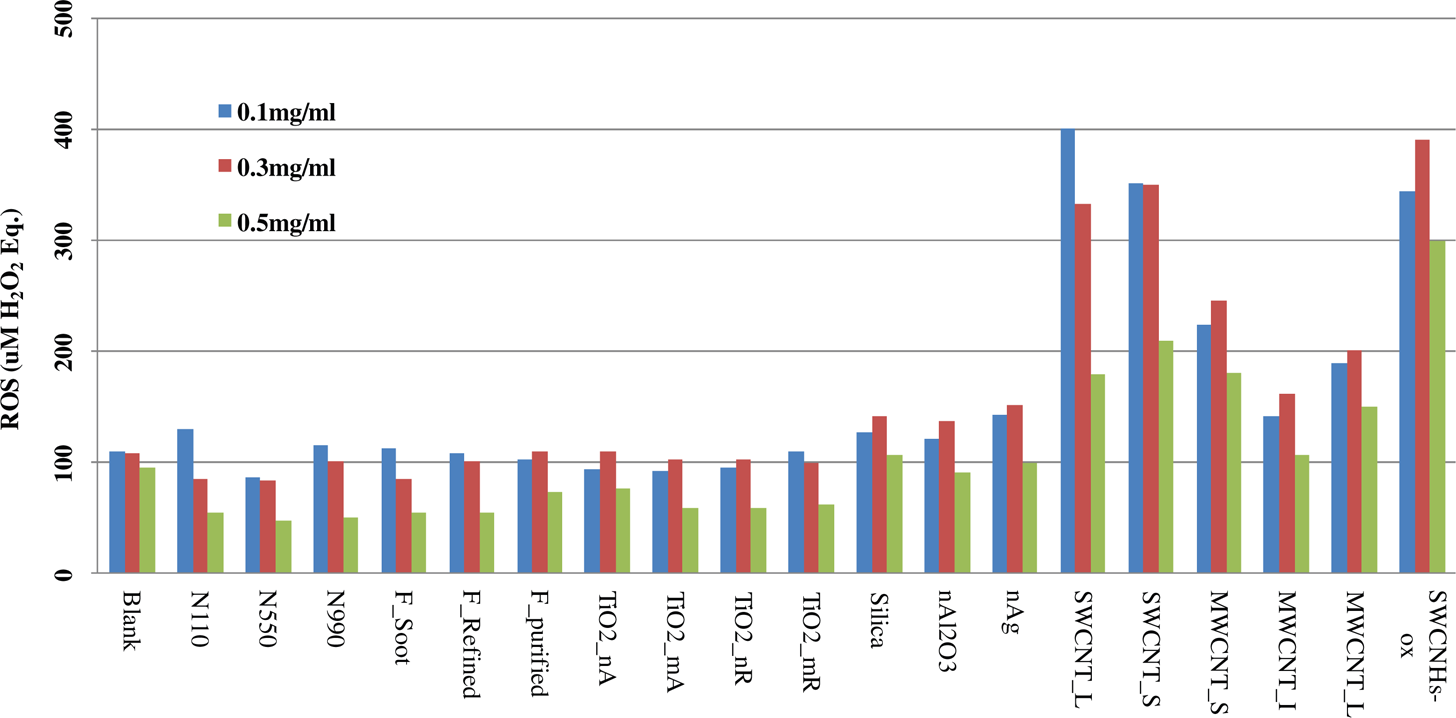
Dose response for the whole series of nanomaterials studied at three concentrations: 0.1, 0.3, and 0.5 mg/ml. The data are for Triton-X probe sonication, the condition with overall better dispersion efficiency and stability. Lack of a linear relationship with increased concentration is apparent. The lowest response was consistently observed for the highest concentrations. Depending on the nanomaterial type, especially for the carbon based nanomaterials, an inverse linear DCFH response is seen with increasing concentration (e.g. SWCNT_L and N110). The effect is higher for higher surface area nanomaterials. These anomalies are likely a net effect of several processes, such as potential absorption of DCFH reagent onto the surfaces of particles followed by removal from solution via agglomeration/precipitation and light scattering effects.
DISCUSSION
Nanomaterials have large surface area owing to higher particle number per unit mass than their micron-sized counterparts. This makes them highly reactive because surface atoms usually have unsatisfied high-energy bonds that will readily interact with other molecules to gain stability (Oberdorster et al. 2005; Doak et al. 2009). Enhanced adsorption onto ENM surface of the dyes or other chemical entities present in the reaction system, further modified by variable surface chemistries, manufacturing processes, and types of surfactants used to disperse ENM, may lead to measurement errors that are largely unknown (Belyanskaya et al. 2007; Doak et al. 2009). Few studies pointed to these limitations in the DTT assay (Sauvain et al. 2008) and DCFH assay (Doak et al. 2009); however, the evidence was mostly anecdotal. Several potentially serious analytical problems have been reported for the DCFH assay as early as 1999 (Rota et al. 1999a; Rota et al. 1999b; Myhre et al. 2003; Bonini et al. 2006) but they seem to have had little impact on adoption of the DCFH assay for ENM ROS measurements. Our finding that the DCFH assay is susceptible to several parameters and that the direction and magnitude of such effects varies unpredictably is in good agreement with these earlier cautionary reports.
Dispersion Efficiency
Proper dispersion of ENM for toxicological studies is a key factor and its significance has been recognized (Bihari et al. 2008). Yet, the problem has not been fully resolved and dispersions at the primary particle size continue to be challenging. In the present study, consistent with the best practices at the time, two types of dispersion mediums were tested, one biologically relevant medium of 1 % BSA/ 0.9 % NaCl(aq) and the other, 0.07 % Trition-X 100, a nonionic surfactant routinely used for dispersing ENM. Agglomeration of ENM varies according to the sonication energy, frequency and time used and can impact ROS measurements (Murdock et al. 2008). Thus, both cup sonication (lower energy) and probe sonication (higher energy) were employed to disperse ENM in two media (1 % BSA / 0.9 % NaClaq and 0.07% Trition-X 100). The d h,z ave and PDI results obtained (Table 2) indicate that, depending on the ENM class, dispersion efficiency can vary considerably. Dispersion stability and efficiency (with a few exceptions) was generally in the order: 1% BSA / 0.9% NaClaq with cup sonication < 1 % BSA / 0.9 % NaClaq with probe sonication < 0.07 % Trition X- 100 with probe sonication. In general, consistent with earlier reports (Allouni et al. 2009), carbon based ENM dispersed better than metal oxides under probe sonication and their agglomeration rates were slower than for metal oxides. This was reflected in the overall PDI values. Our dispersion efficiency (as reflected in the d h,z ave and PDI values) were equivalent to or better than earlier results (Foucaud et al. 2007; Murdock et al. 2008; Bihari et al. 2008; Lu et al. 2009) performed with similar ENM.
While higher sonication energy can generally lead to better dispersions and smaller agglomerate size for some ENM, it can also lead to changes in ENM structure and even ENM breakage and generation of free radicals, which may induce biologically significant structural alterations in serum proteins (such as BSA) and other biological surfactants frequently used as dispersion media (Wang et al. 2009). For example, materials with high aspect ratios (SWCNT and MWCNT series) as well as those whose primary particle size is in the micron range (TiO2_mA,TiO2_mR and silica) had fluctuations in d h,z ave and PDI. Moreover, the % intensity of the primary peak in the PSD fluctuated as well. Overall these factors point to a variable rate of agglomeration in dispersions of these materials. DLS data and SEM/TEM images of SWCNTs and micron-size TiO2 confirmed structural fragmentations. This phenomenon was consistent with earlier observation of TiO2 breakage (Mandzy et al. 2005). For the micron-size crystalline silica (with sizes typically in the 1–5 μm range), electron microscopy revealed a substantial fraction of smaller (<1 μm) particles. The d h,z ave for crystalline silica may reflect a combination of these smaller particles and potential fragmentations. For TiO2_Anatase particles, the dispersion was not as effective, consistent with the prior observations (Bihari et al. 2008).
It is speculated that the values for Al2O3 and the fullerene series (especially F_purified), are not representative of the true particle size distribution in the dispersions. They showed the highest rate of agglomeration of all the ENM studied, even though measurements were taken instantaneously after sonication. The PDI values obtained for these ENM were higher (approx 0.6-0.7) than the average PDI for the other ENM tested.
While these modifications may be less important relatively, for acellular than cellular assays, the use of high sonication energy may need to be balanced against these undesirable effects. Measuring particle size of CNTs by DLS might be error-prone (as stated in method section), but for our study it is sufficient for obtaining an idea of their hydrodynamic diameter in the dispersions. This is especially the case for their agglomeration rate in different mediums under different dispersion conditions. It was found that poorer dispersion leads to a larger average diameter (d h,z ave) for CNTs. Dispersion efficiency is likely a major contributor to the observed variability in ROS values (the 95% CI around the mean). This is easier noticed by looking at the 95% CI for the same material under different dispersion conditions (e.g. CNTs in 0.07 % Triton X-100 vs. 1% BSA / 0.9% NaCl(aq)). However, it should be pointed out that dispersion is not a DCFH-specific problem.
ROS measurements
Different measurement times have been reported in the literature for the DCFH assay spanning from minutes to one hour (Foucaud et al. 2007; Veranth et al. 2007; Lu et al. 2009; Rothen-Rutishauser et al. 2010). Initially we investigated reaction kinetics for all tested ENM over 120 min (Figure 6). Under the current assay conditions, none of the reactions reached completion, and this may be in part due to continued auto-oxidation of the large DCFH pool. During the first 40 min, distinct reaction dynamics were observed for different ENM depending on dispersion media and sonication and the relative ranking of ENM ROS generation would change depending on the time of measurement. Meaningful measurements and comparisons among ENM leading to stable rankings of ENM ROS intrinsic potency could be made after 60 min. Reaction completion was observed at 90 min for higher reactant (DCFH and ENM) concentrations. We reported data for 90 min as a more conservative approach, although the results and conclusions of this work would not change if data were reported for 60 min. The reaction kinetics data have several implications. Because only a minor fraction of the reaction is completed in the first 10 min, DCFH measurements based on this time frame for individual ENM have little value. Even for comparative purposes, such as for relative ranking of their intrinsic potency to generate ROS, such measurements are unreliable if they are based on short time frames, especially < 40 min. Sixty minutes or more is necessary.
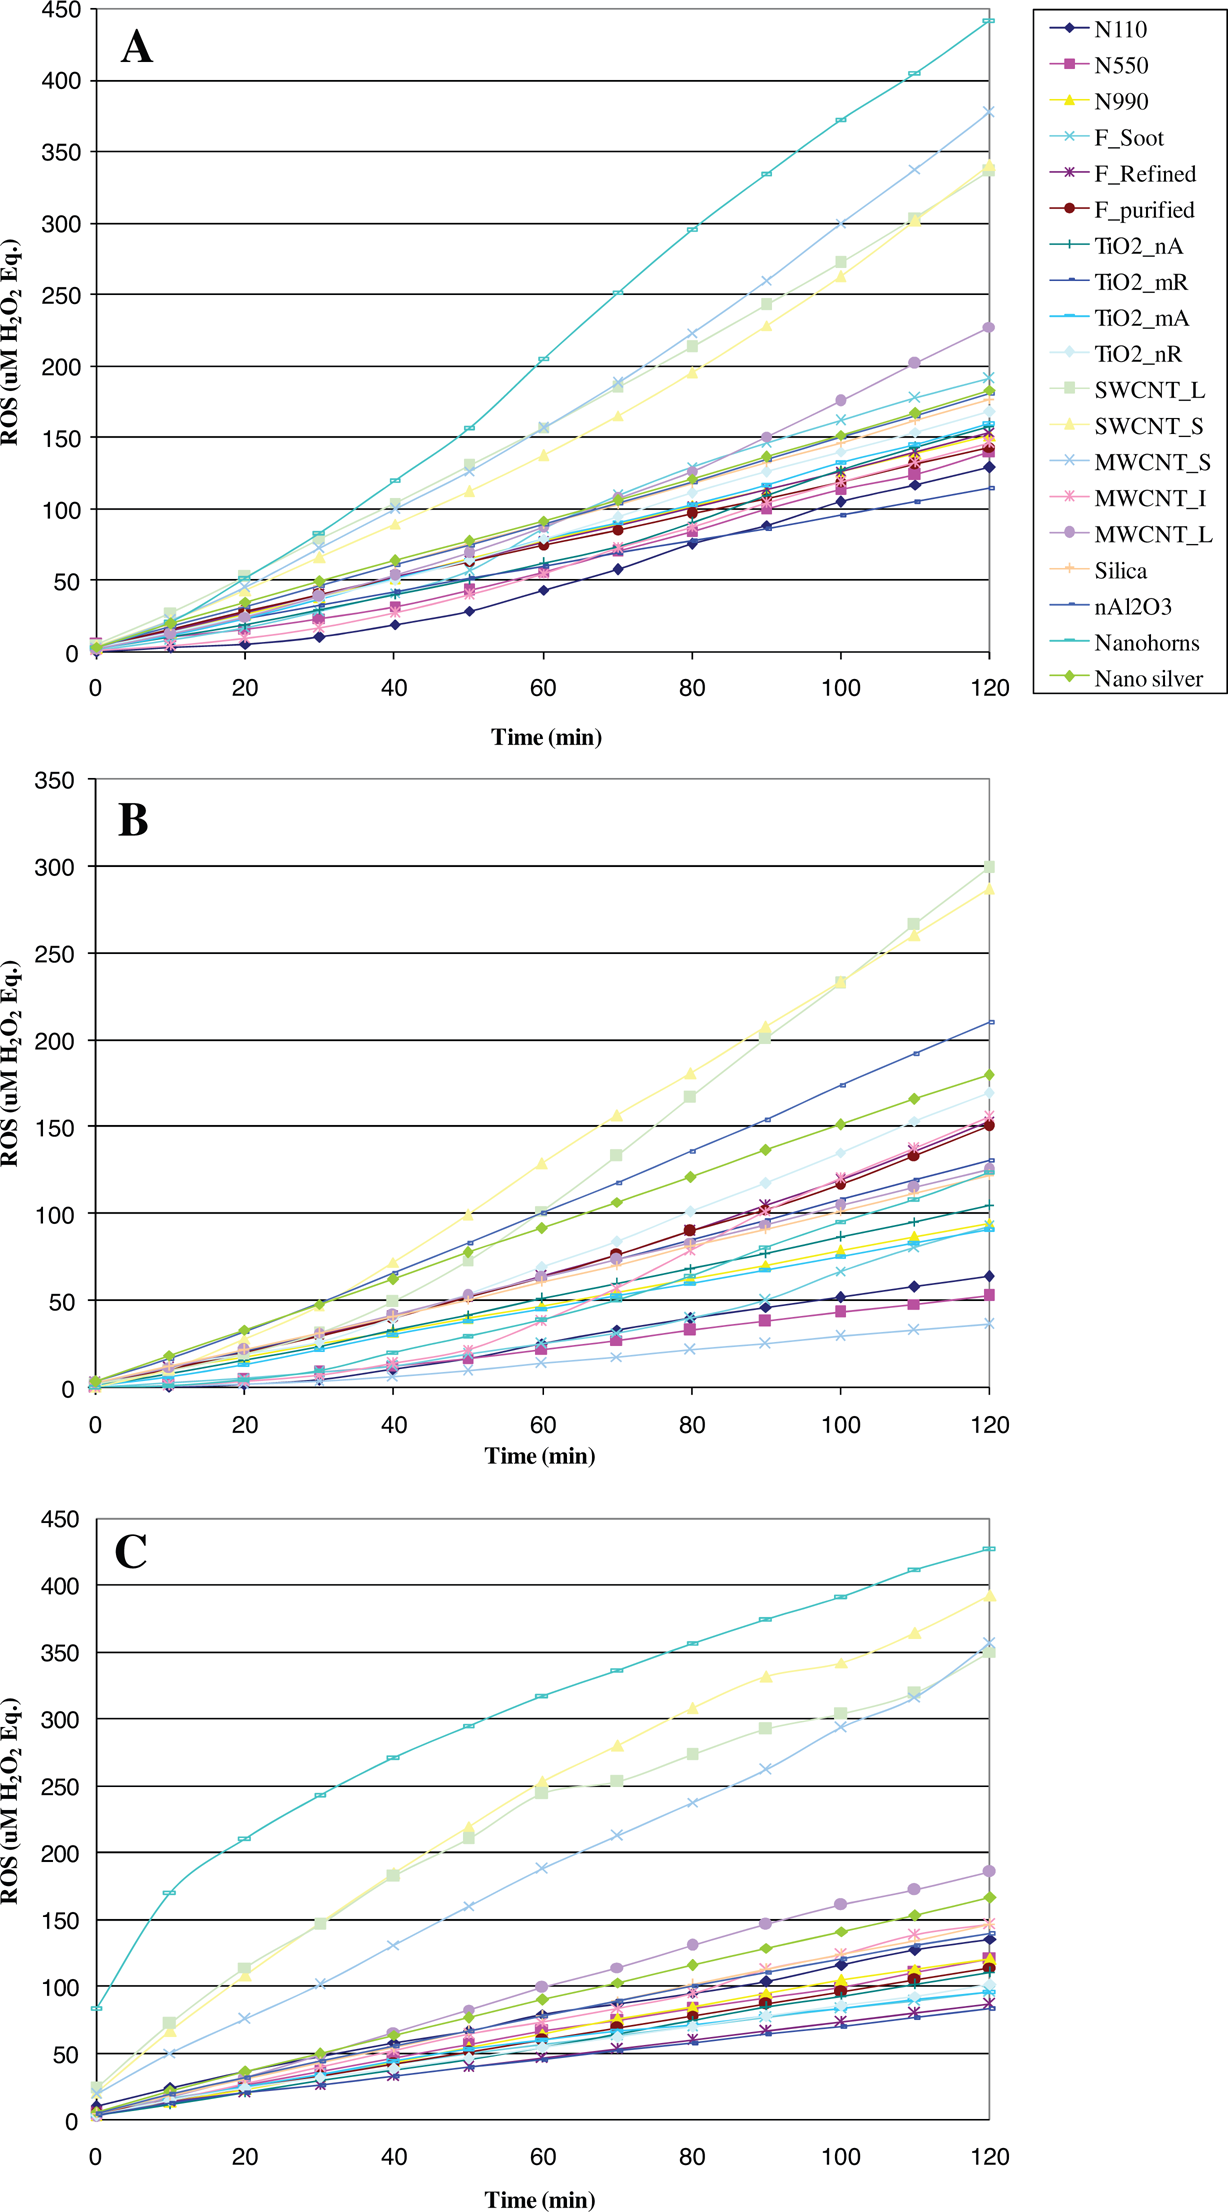
Reaction kinetics for the set of 19 ENM under various dispersion conditions for the 0.3 mg/mL concentration: (A) 1 wt.% BSA/0.9wt.% NaCl(aq) and cup sonication; (B) 1% wt.BSA/0.9wt.% NaCl(aq) and probe sonication; (C) 0.07% wt Triton-X and probe sonication.
Consistent with previous reports on DCFH oxidation by HRP, our results document significant effects of HRP on DCFH oxidation. More problematic is the finding that the magnitude of this effect varies depending on the dispersion media and sonication conditions, making corrections for such effects impossible. The range of H2O2 Eq. ROS generated as a result of DCFH oxidation by reactants other than ENM spanned from 100 (blank without HRP) to 800 μM H2O2(eq) (blank with HRP and probe sonication). The range of H2O2(eq) ROS generated as a result of DCFH oxidation by ENM without HRP was ∼100 (blank) to < 400 μM H2O2(eq) under all conditions. These data do not support addition of HRP to ENM.
Another important factor, often overlooked, which may add to the variability of ROS measurements induced by ENM in the presence of HRP in the DCFH assay is the potential interaction and inactivation of HRP as a result of absorption onto ENM surfaces, as has been shown for silica nanoparticles and HRP, lysozyme, trypsin, and catalase (Vertegel et al. 2004). The magnitude of this effect, which may lead to different levels of HRP activity and DCFH oxidation, will likely depend on ENM type and particle size. Such concerns are contrary to a general tendency where HRP is being added during DCFH assay to ‘amplify the DCFH oxidation’ (Foucaud et al. 2007; Jiang et al. 2008; Rothen-Rutishauser et al. 2010). As mentioned previously, several M2+ transition metals (Co, Mn, Ni) common in CNTs and metal oxides may inactivate or enhance HRP catalytic activity with different potencies. For the reasons stated above, addition of HRP to ENM severely compromises the quality of the data, (which in the DCFH assay are inherently compromised by DCFH auto-oxidation) and renders comparisons inconsequential as one would not know how much effective ROS is generated by each ENM, given their variable physiochemical characteristics and unknown re/activity to HRP.
In our tests, the DCFH gave consistently negative responses for the majority of ENM, irrespective of dispersion medium and method used. This is primarily driven by the high ROS values obtained for blanks (without ENM) and reflects one major inherent limitation of the assay: auto oxidation. This fact is consistent with other studies (Foucaud et al. 2007; Lu et al. 2009; Rothen-Rutishauser et al. 2010). Notable also is the fact that the majority of ENM that were negative gave values than were below the blank. For a reliable assay, a ROS value below blank would mean that the ENM exhibits antioxidant properties and the difference from blank value would be proportional to its intrinsic potency. This is unlikely to be the case for the majority of these ENM (with the exception perhaps of purified fullerenes). The more likely explanation for these observations is a net effect of several aforementioned ENM-induced artifacts that drive the overall DCFH response towards smaller values.
Only two ENM were positive under all three conditions (SWCNT_L, SWCNT_S). The number of positives varied with the dispersion medium and sonication conditions between 3 and 5. A few CNTs switched from positive to negative and vice-versa upon dispersion/sonication conditions. Some typical cases involved nano silver (1/3 positive), MWCNT_S and _L (1/3 inconclusive) and SWCNH-ox. The SWCNH-ox represents an even more drastic example. For 2/3 conditions (1% BSA / 0.9% NaCl/ cup sonication and Triton X-100/probe sonication) SWCNH-ox gave one of the highest ROS values. However, in 1% BSA / 0.9% NaCl medium with probe sonication the result was conclusively negative. The reason for this drastic shift in behavior is not known and it warrants further investigations. For all the aforementioned reasons, negative DCFH results for ENM should be treated as uninformative. Additionally, reports of individual acellular DCFH results for ENM for which no blank values were provided or which have been acquired with the addition of HRP to ENM should be treated with skepticism.
Lack of a linear dose-response over the tested 0.1-0.5 mg/mL range is also concerning. For the series of carbon blacks, fullerenes, CNT and TiO2 an inverse dose response was observed. For the remainder ENM (TiO2 series, Silica, nAl2O3, nAg, MWCNTs and SWCNHs-ox) ROS values increased as concentration increased from 0.1 to 0.3 mg/mL but decreased for 0.5 mg/mL. This effect for the DCFH assay was also observed by Doak et al. 2009 for one type of ENM (iron oxides). Since only negligible fluorescence responses were obtained from ENM when they were run as blanks without DCFH (data omitted), factor associated with the reagent (DCFH) and its interaction with ENM must be responsible for such phenomena (non-linear response, high blank values, high variability in ROS measurements, many ENM resulting in responses below blank values, etc.). Although the mechanisms contributing to these observations have not been studied in detail and these effects have not been quantified, they can be attributed to several processes: adsorption of DCFH onto the surface of ENM (and the subsequent fluorescence quenching), ENM reagglomeration and sedimentation from solution, and light scattering or absorption by several ENM.
These findings are based on a cell-free system. The DCFH assay is also commonly used for quantitating the extracellular and intracellular oxidative stress in the presence of ENM. Since there are reasons to believe that problems with the acellular DCFH assay may also occur in the cellular DCFH assay, more rigorous method development and evaluation may be needed in order to quantify and minimize ROS measurement errors in cellular systems. The problems with the acellular DCFH assay for ENM ROS measurements raise concerns that similar problems may also happen in intracellular milieu. Since the medium complexity is greater, the variability and uncertainty in DCFH measurements in cellular systems may be even greater. As for the intracellular DCFH measurements, one important factor is the ENM type and the extent of its intracellular uptake. In the best case scenario, there is always the auto oxidation of DCFH by visible light to worry about (Marchesi et al. 1999).
CONCLUSIONS
The acellular DCFH assay for measuring ROS elicited by ENM is susceptible to experimental conditions and the assay lacks robustness and reproducibility required in an analytical method. Its broad adoption for ENM ROS measurements without sufficient method development and validation may lead to erroneous and conflicting data. Although further modifications and development may improve its performance, the inherent limitations of the assay are a serious obstacle. We advocate for the discontinuation of the DCFH assay for measuring ROS elicited by ENM and encourage exploration of alternative more biologically relevant assays.
Footnotes
ACKNOWLEDGEMENTS/DISCLAIMERS
One of the authors (AKP) would like to dedicate this work to his dear friend, Mr. Yogesh Rawat, whose life was cut short by a tragic accident. Yogesh’ enthusiasm for life and studies was contagious and has had a strong influence in shaping his academic ambitions.
We would like to thank Mr. Neeraj Pardhy, from Dept. of Plastics Engineering, Prof. Jackie Zhang from Dept. of Civil and Environmental Engineering, Mr. Srikanth Ammu and Prof. Sanjeev Manohar from Dept. of Chemical Engineering and Mr. Abhishek Kumar from Dept. of Physics for their assistance with some aspects of the experimental work. This study was supported through the Nanoscale Science and Engineering Centers Program of the National Science Foundation # 0425826.