
Abstract
In the prior Part I, the potential influence of the low level alpha radiation induced bystander effect (BE) on human lung cancer risks was examined. Recent analysis of adaptive response (AR) research results with a Microdose Model has shown that single low LET radiation induced charged particles traversals through the cell nucleus activates AR. We have here conducted an analysis based on what is presently known about adaptive response and the bystander effect (BE) and what new research is needed that can assist in the further evaluation human cancer risks from radon. We find that, at the UNSCEAR (2000) worldwide average human exposures from natural background and man-made radiations, the human lung receives about a 25% adaptive response protection against the radon alpha bystander damage. At the UNSCEAR (2000) minimum range of background exposure levels, the lung receives minimal AR protection but at higher background levels, in the high UNSCEAR (2000) range, the lung receives essentially 100% protection from both the radon alpha damage and also the endogenic, spontaneously occurring, potentially carcinogenic, lung cellular damage.
1. INTRODUCTION
We present here Part II of a three part study of the potential effects of adaptive response radio-protection and bystander effects on the human health risks from radon. In Part I (Leonard et al. 2009a), we have primarily examined experimental in vitro data that show the effect of radon progeny and other high LET alpha particles on the induction of transformation frequencies and chromosome aberrations in a number of cell species thus illustrating the potential for alpha particle induction of carcinogens in human lung tissue. It is found that the cellular dose response from alpha particles is relatively independent of cell species and LET of the alpha radiation to within about ± 10% and is non-linear. Thus a representative alpha particle dose response shape is obtained which should be applicable to the alpha particle dose response in human lung tissue. This representative alpha particle dose response is shown in Figure 10 of Part I (Leonard et al. 2009b). It is then normalized to the Figure 3-2, of BEIR VI (1999), estimated lung cancer Relative Risk at 400 Bq m−3, believed to be reliable for both the case-control and underground miners lung risk data. The normalized dose response is presented as Figure 16 of Part I (Leonard et al. 2009a). In the Part I analysis, it is found that the Brenner et al. (2001) BaD microdose Bystander Model is an excellent tool for the analysis of bystander effects in tissue with however the necessity to require two alpha particle hits to initiate the Direct Damage component of the dose response, consistent with observations of Miller et al. (1999). It is also found that the human lung cancer relative risk should not be Linear No-Threshold and that underground miners risk data may not be valid for estimating risks at domestic and workplace radon levels.
This is compatible with premises by others (Little and Wakeford 2001, Little 2004, Brenner and Sachs 2002, Brenner et at 2001) that Bystander Effect Damage occurs in human lung tissue from the high LET radon alpha radiations. We here further premise in this Part II text, also based on in vitro data, that adaptive response radio-protection most probably is activated in human lung cells. This predominantly by low LET radiations received on a continually basis by humans from natural background and man-made radiations.
2. MATERIALS AND METHODS
2.1 Distinction Between Adaptive Response and the Bystander Effect
The Bystander Effect is the induction of biological effects in cells that are not directly traversed by a charged particle, but are in the close proximity to cells that are. Investigations have encompassed both deleterious and beneficial results in un-hit cells as Bystander Effects (Little and Wakeford 2001, Belyakov et al. 2005, Iyer and Lehnert 2002, Leonard and Leonard 2008).
Adaptive response, to many, is thought to mean the reduction in the biological effects of large doses of ionizing radiation by the prior exposure to low doses of radiation. The prior low dose is usually called the “primer” dose and the subsequent large dose the “challenge” dose. It is consistently observed that AR is primarily observed from low LET radiations. Recent work has shown the priming dose can also result in a reduction of endogenic spontaneous, naturally occurring, potentially carcinogenic cellular damage. Azzam et al. (1996), Redpath et al. (2001) and others have logically considered the spontaneous damage priming dose protection also as Adaptive Response. The AR protection seen in endogenic spontaneously occurring damage of course has far greater human radiation risks implications since this could affect a reduction in lung cancer risks worldwide by low LET natural background and man-made radiations. We can say that, for Adaptive Response, the affected cell must be traversed and for the Bystander Effect the affected cell is not traversed. The high dose response region we will call the Direct Damage Region as Brenner et al. (2001) has done in his BaD bystander model and we have done in our prior publications.
2.2 Models for Adaptive Response Dose Response Behavior and Combined Bystander and Adaptive Response Behavior
In the following sections we will provide a summary of the adaptive response Microdose Model (Leonard 2007a, 2007b) and a composite adaptive response and bystander Microdose Model (Leonard 2008a, 2008b, Leonard and Leonard 2008). These will be used in the Appendix A and the Results sections to examine combined BE and AR effects relative to human lung cancer risks from radon.
2.2.a Adaptive Response Suppression of Cellular Damage
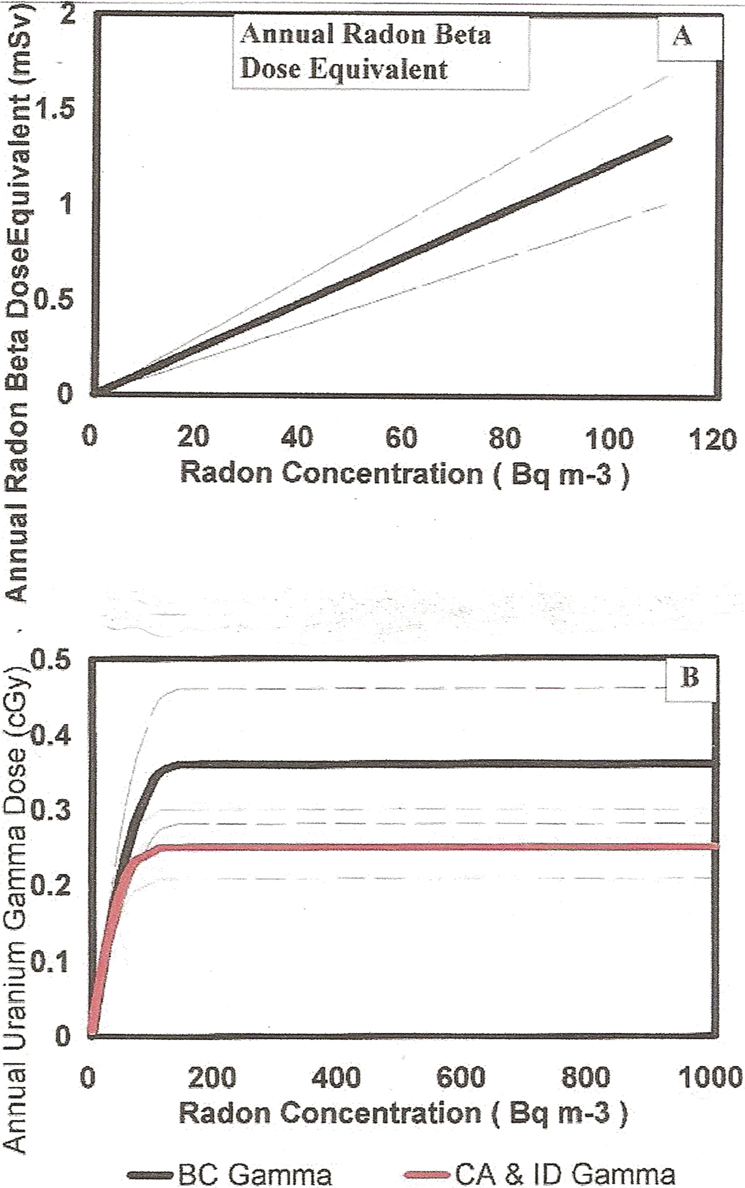
Since the adaptive response effect involves the micro-dosimetric induction of a radio-protective behavior in cells from the passage of small numbers of radiation induced charged particles through the cell, we have earlier developed the adaptive response Microdose Model (Leonard 2005, 2007a, 2007b). As Equation (1) below, we provide a modified form of the AR Microdose Model from Leonard (2007a):
where Pspon is the zero dose natural spontaneous damage, Pprot-s∞ and Pprot-r∞ are the adaptive response protection fractions for the reduction of the spontaneous and radiation induced damage. Broad beam exposures are assumed to deliver Poisson distributed cellular events (Brenner et al. 2001, Miller et al. 1999, Little and Wakeford 2001, Little 2004). The f(M) is the AR dissipation function in the Direct Damage Region. PAFS, PAFR and PAFD are the Poisson accumulation functions for the transition of the adaptive response spontaneous, the radiation damage protection and the deleterious direct damage, respectively, given by

In this general form for the Poisson accumulation function, M is the mean number of events occurring (such as cell hits) from the radiation dose and n is the number of incidental events (hits) necessary to produce the effect (in our case cell radio-biology endpoints). It is important to note that M is the mean number of events for a statistically significant large cell population and is not an integer but a continuous function of dose. The linearity of M as a function of dose is given by M = D / <z1> (so in our prior formulation and here, M is equivalent to Brenner et al. (2001) <N>). <z1> is the conventional microdosimetry specific energy deposition per charged particle traversal through a cell (ICRU 1983) and defined in Section 2.3.b of Part I. For microdosimetric hits then P(M, j) is the hit probability at a value of M in the differential range dM that the required j hits have occurred. Thus, the first term in adaptive response Equation (1) is the initial zero dose natural spontaneous damage with adaptive response reduction and the second term is the direct radiation damage [the conventional linear-quadratic behavior – (α D + β D2)] with also a possible threshold and adaptive response radioprotective reduction as was found to be the case in prior work. We see at zero dose, D = 0, then M = 0, PAFS (M,N) = PAFR (M,Q) = PAFD (M,U) = 0 and DR = Pspon.
As is frequently the case for risks reported by the Radiation Effects Research Foundation for the Japanese A-bomb survivor data, we wished to express the relative risk, RR, (normalized with respect to zero radiation dose natural spontaneous risk – Pspon) we obtained

This corresponds to the prior work Equation (16) of Leonard (2007a) and Equation (19) of Leonard (2008b). We see that for absorbed dose = D = 0, then M = 0 and RR = 1.0. BEIR VI (1999) makes use of Relative Risk in evaluating lung cancer risks as seen in Figure 1C of Part I. These adaptive response Microdose Model parameters are also explicitly defined in Appendix B.
2.2.b The Combined Adaptive Response and Bystander Model
We review the formulation of the composite BE and AR Microdose Model (Leonard 2008a, 2008b). The radiation dose response is expressed in terms of charged particle traversals through the exposed medium using Specific Energy Hits as the independent variable. The experimental radio-biologists conduct their experimental exposures in terms of tissue absorbed dose. However, in planning and analyzing results, the independent variable Specific Energy Hits per Nucleus is important, given by tissue absorbed dose D / <z1>. We here have therefore provided, as was done in prior work, the BaD Model and our composite AR and BE Microdose Model in terms of both of these independent variables – and also, as will be seen, provide the abscissa of our graphs with both. For the composite model and the BaD Model, we have assumed that there are no intracellular interactions between the separate processes creating the potentially deleterious (or protective) bystander and the potentially protective adaptive response mechanisms. The composite model encompassing both processes can be given by
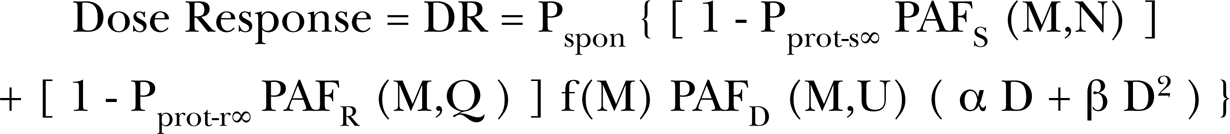
Examples of adaptive response radio-protection from low LET priming doses for “challenge” and spontaneous cellular damage as analyzed with the AR Microdose Model (Leonard 2005, 2007a, 2007b, 2008c). Provided as red solid curves are the Poisson accumulations of single charged particle traversals (Pprot-pr) are shown to induce the protection. Specific energy hits per nucleus abscissa scales are given. Panel A – Wiencke et al (1986) data for relative chromosome aberrations in vitro versus tritiated thymidine concentrations as the primer source. Data is for a “challenge” dose of 1.5 Gy of 250 kVp X-rays. Panel B – Azzam et al (1996) adaptive response data for 10T1/2 cells exposed to priming doses of 60Co gamma rays producing a reduction in spontaneous neoplastic transformations. Panel C – Redpath et al (2001, 2003) adaptive response reduction of spontaneous transformations from exposure of HeLa x skin cells to primer doses of 137Cs gamma rays. Panel D – Elmore et al (2005) adaptive response reduction of spontaneous transformations from exposure of HeLa x skin cells to primer doses of 232 MeV protons.
Dose Response = Initial Spontaneous Damage (with AR protection) + Bystander Effect Damage (with AR protection) + Direct Deleterious Damage (with AR protection)
As defined above, the zero dose natural spontaneous damage is given by Pspon, as in Equation (1). Thus, from Equation (3), we have for the normalized relative risk as a function of tissue absorbed dose, RR = Dose Response / Pspon and

where M = D / <z1>. Again for absorbed dose = D = 0, M = 0 and RR = 1.0. From Equation (2) of Leonard (2008a) and Equation (34) of Leonard (2008b), the BaD Model in terms of tissue absorbed dose is given by

In both Equations (4) and (5), the BaD Model parameters q and k are converted to dose units by
The Relative Risk, for the composite model in terms of Specific Energy Hits per Nucleus as the independent variable, is given by

Here if M = 0, then absorbed dose = D = 0 and RR = 1.0.
2.3 Properties of Adaptive Response and Bystander Effects Relative to Combined High and Low LET Exposures
In the following sections, the experimentally observed properties of adaptive response and data relative to combined low LET and alpha particle dose response, based on prior observations, will be summarized. From the extensive BE data available, the basic properties of BE are examined in Part I (Leonard et al. 2009a). The basic behavior of AR with respect to lung exposure from natural background and man-made low LET radiations is examined here in Appendix A.
2.3.a Examples of Adaptive Response Protection for Challenge Dose and Spontaneous Cellular Damage with low LET Priming Doses
In our microdosimetry work (Leonard 2005, 2007a, 2007b, 2008a, 2008b, Leonard and Leonard 2008), we have shown, in the Adaptive Response data of others (Azzam et al. 1996, Elmore et al. 2006, 2008, Ko et al. 2004, Redpath et al. 2001, 2003, Redpath and Antoniono 1998, Shadley and Wiencke 1989, Shadley and Wolff 1987, Shadley et al. 1987, Wiencke et al. 1986, Wolff et al. 1989) for a number of cell species, that single (i.e. just one) charged particle traversals through the cell nucleus can activate AR protection. The early works studied the effects of prior priming doses on subsequent exposures to larger challenge doses for human lymphocyte cells (Wiencke et al. 1986, Shadley and Wolff 1987, Shadley et al. 1987, Shadley and Wiencke 1989, Wolff et al. 1989). Figure 1A provides the AR data of Wiencke et al. (1986) where the human lymphocyte cells were treated with endogenic tridiated thymidine and then exposed to the exogenic 250 kVp X-rays. Shown is the fit of the AR Microdose Model showing, with the Beta Ray Specific Energy Hits per Nucleus scale, that the emission of a single low energy tritium beta ray activates the suppressive radio-protection and reduction of the cellular damage from the challenge X-rays. Relative to spontaneous AR protection, we show as Figure 1B the adaptive response data of Azzam et al. (1996) for exposure of 10T1/2 cells to low priming doses of 60Co gamma rays and subsequent reduction in the spontaneous transformation frequency. As Figure 1C, we show the AR data of Redpath and Antoniono (1998) and Redpath et al. (2001) for exposure of HeLa x skin cells to low priming doses of 137Cs gamma rays and, in this case, subsequent reduction in the spontaneous transformation frequency levels. The Microdose Models analysis, in these figures, shows that single radiation induced charged particle traversals through the cell nucleus initiates a Poisson accumulated AR radio-protection shown in red in the figures. This can be seen by referring to the Specific Energy Hit per Nucleus abscissa scales. As Figure 1D, we show the HeLa x skin dose response to cosmic high energy (232 MeV) protons (Elmore et al. 2005). In Figure 2, it is shown, as was extensively analyzed in Leonard and Leonard (2008), that the mammogram and diagnostic X-rays extend their protection into the Bystander Damage Region (below one specific energy hit) forming a double “U” shaped dose response. The mammogram results are significant for the millions of women undergoing mammogram screening each year (Redpath 2007, Redpath and Elmore 2007, Redpath and Mitchel 2006). Altogether, the Dr. Redpath research group has shown that the adaptive response protection is independent of the type of low LET radiation, encompassing 137Cs gamma rays, mammogram 30 kVp X-rays, diagnostic 60 kVp X-rays, 125I brachytherapy photons and 232 MeV protons as well as 250 kVp X-rays (Shadley et al. 1987), 60Co gamma rays (Azzam et al. 1996) and tritium beta rays (Wiencke et al. 1986), all requiring only one charged particle traversal through the cell nucleus [see Table I, Leonard and Leonard (2008)].

Examples of both protective bystander and adaptive response radio-protection reduction in spontaneous neoplastic transformations. Panel A – Exposure of HeLa x skin cells to 28 kVp mammogram X-rays. Panel B – Exposure of HeLa x skin cells to 60 kVp diagnostic X-rays.
2.3.b Combined Bystander Effect and Adaptive Response Effects for Low LET Radiation
As shown in Figure 2, there are now two spontaneous data sets that show that low LET radiation can activate a protective bystander behavior i.e. a reduction at very low doses where the dose is too low for even single charged particle traversals to have occurred. This is for both the mammogram (Ko et al. 2004) mentioned above and also diagnostic (Redpath et al. 2003) X-rays for HeLa x skin cells as analyzed with the Microdose Model (Leonard and Leonard 2008). It may be that the other radiations AR data for HeLa x skin would have shown protective bystander effects but the exposure levels of the dose sets were not low enough to encompass the Bystander Damage Region [see again Table 1, Leonard and Leonard (2008)]. Figure 2A and 2B provides these mammogram and diagnostic X-ray data showing the reduction in dose response at specific energy hit levels below one traversal (hit) per cell nucleus (thus protective bystander behavior).
2.3.c Low LET Adaptive Response Radio-protection for High LET Alpha Induced Bystander Damage
The alpha particle micro-beam research, primarily at the Columbia University Micro-beam Facility (Randers-Pehrson et al. 2001), has shown that alpha particles can induce damage to neighbor bystander cells. The analysis presented in Part I (Leonard et al. 2009a) conclusively supports this evidence. Recent measurements have shown the range of the bystander signal from alpha particles in three dimensional tissue is on the order of 200 μm, which would extend over many lung bronchial and bronchiolar neighbor cell diameters (Belyakov et al. 2005, Leonard 2009). Of fundamental interest is whether the bystander damage, thus known to occur in the lung, can be modulated by adaptive response induction with accompanying low LET radiation. Zhou et al. (2003, 2004) performed micro-beam alpha particle exposures where 10% of the AL cells were irradiated with one alpha particle. A significant bystander damage was observed. As a second experiment, 4 hours prior to alpha irradiation, the cells were subjected to broad-beam exposures of low priming doses of 250 kVp X-rays. Figure 3A shows the relative response and approximately a 75% reduction in the bystander damage from the alpha irradiations induced by the low LET X-rays. We also show in Figure 3A the Azzam et al. (1996) AR data for 60Co priming dose exposures, as a comparison, showing nearly the same large magnitude of AR protection. Again with the micro-beam facility, Sawant et al. (2001a) injected exact numbers of alpha particles through the nuclei of 10% of the C3H 10T1/2 cell population and measured the clonal survival. As a second experiment, they exposed all the cells to a broad-beam exposure of 2 cGy of 250 kVp X-rays prior to the micro-beam alpha exposures. Figure 3B provides the percent survival data showing about a 50% adaptive response reduction in cell killing from the priming dose AR protection.
In the medium transfer experiment of Iyer and Lehnert (2002) the surviving fraction was measured for the exposure of human lung fibroblast to radon alpha particles. As the second experiment, they exposed supernatant medium to 1 cGy of X-rays and then transferred to the in vitro culture before alpha irradiation. As seen in Figure 3C, what was observed was a very large reduction in cell killing even greater than that observed by Sawant et al. (2001b).

Examples of adaptive response reduction of alpha particle cellular damage from priming doses of low dose radiations. Panel A – Shown are the data of Zhou et al (2003) from their study of adaptive response effects on the micro-beam induced bystander damage to 10% of 10T1/2 cells. The bystander damage was normalized to damage without priming dose X-rays. We show the reduction of the bystander damage from priming doses of X-rays. Shown also as a comparison is the data of Azzam et al (1996) presented in Figure 4B. Panel B – The surviving fraction data of Sawant et al (2001a, 2001b) for injection of specific numbers of alpha particles, showing a reduction in cell killing for C3H 10T1/2 cells when pre-exposed to X-rays. Panel C – The results of Iyer and Lehnert (2002) alpha particle exposures where prior exposure of super-nutriants to X-rays produces reduction in alpha particle human lung fibroblast cell killing. Panel D – The Pohl-Ruling (1988) non-monotonic dose response of chromosome aberrations in human lymphocytes from radon alpha particles, caused by adaptive response radio-protection from radon progeny beta rays. Reproduced from Leonard (2008a) with permission.
A study was conducted by Wolff et al. (1991) to examine the effectiveness of 250 kVp X-rays in inducing adaptive response radio-protection for challenge doses of radon alpha particles in human lymphocyte cells. Cells were exposed to a dose of 16.4 cGy of radon alphas alone. In a second experiment, the cells were first exposed to 2 cGy of X-rays and then 15.3 cGy of radon alphas. A 51% decrease in the yield of chromosome aberrations was observed.
We had mentioned in our earlier work, the possibility that the human lymphocyte exposures of Pohl-Ruling (1988) to radon alpha particles may have exhibited a combination bystander effect and an adaptive response modulation in the plateau region of her observed dose response curve (see Figure 4, Leonard 2007a). In our more recent work (see Figure 4, Leonard 2008a), her data was fitted to the bystander BaD Model but the model was unable to justify the depth of the “U” shaped plateau response. This in contrast to excellent fits for the data considered in Part I (Leonard et al. 2009a) and the other bystander data examined in Leonard (2008a). A detailed analysis of the Pohl-Ruling (1988) data and progeny beta activation of adaptive response is given in Leonard (2008a). In considering the 8 different energy beta rays emitted in the 222Rn decay chain, it was found that enough beta radiation was present for at least one beta traversal per human lymphocyte cell nucleus in the higher radon plateau region. Figure 3D shows the magnitude of the adaptive response reduction to produce the non-monotonic behavior “U” shaped dose response. For the Pohl-Ruling (1988) data, the radon alpha damage may thus be considered a “challenge” dose behavior and the accompanying radon progeny betas considered a primer to induce AR protection but with the beta “priming” dose increasing along with the radon progeny “challenge” alpha dose until just enough beta ray traversals occur to induce adaptive response. This implies that human lung tissue may be subjected to adaptive response reduction in lung cancer risk from the radon progeny own beta radiation that may dominate over the bystander chromosome damage. One may question the validity of this beta ray protection since it will occur simultaneous with the progeny alpha damage and not a priming AR dose hours before. as seen to be the case from the work of Shadley et al. (1987) [see Figure 1C, Leonard (2007b)]. Two factors are at play in the beta AR protection. One is that many more cells are traversed by the low LET betas than hit by the short range alphas rendering them protected during the approximately 30 day mitotic cycle for lung cells. This is discussed Section 3.2. Also, there is evidence that AR protection may be activated after the challenge dose (Day et al. 2007a, 2007b). We will consider these radon progeny betas as one low LET radiation source of adaptive protection against lung cancer in later Section 3.1.e.
2.3.d The Time Dependent Behavior of Adaptive Response Radio-protection – Fading and Dose Rate Effects
Shadley and Wiencke (1989) studied the sensitivity of adaptive response protection with respect to the dose rate of the priming dose for challenge dose experiments with human lymphocytes using 250 kVp X-rays. In evaluating their data, it was found that there is a dose rate threshold as well as a single traversal dose threshold (Leonard 2005, 2007b). Elmore et al. (2006) measured the dose rate behavior of adaptive response for spontaneous damage in HeLa x skin cells, which we examined with the Microdose Model in Section 3.1 of Leonard (2008b) with again a dose rate threshold being required to model the data. Shadley et al. (1987) varied the time between the administration of the priming dose and the later challenge dose. It had been known from others that the endogenic cellular activation of the AR radio-protection required 4 to 6 hours. From Leonard (2007b), we reproduce the Figure 1C graph as Figure 4A here of the adaptive response protection afforded the challenge dose as a function of time between the priming dose and the challenge dose. It is shown that the protection is maintained at a constant level up to 38 hours but then begins to fade and the protection is dissipated. The cell cycle time for human lymphocytes is approximately 38 hours. Considering the dose rate threshold also being compatible with the cell cycle time, the data suggests that the protection may be lost at mitosis although this has not been conclusively confirmed in the laboratory. The fact that after the AR activation threshold and Poisson transition of the AR protection, the protection remains constant as primer dose is increased (as seen in Figure 4A) suggests that early stages of the cell cycle may be insensitive to AR activation and the magnitude of the protection, when it becomes fully effective, is related to the fraction of time in the entire cell cycle that the cell is sensitive to the single charged particle traversal that produces the activation. Other data however contradict the mitosis AR dissipation hypothesis. Klokov et al. (2000) found that exposure of the SHK mice in vivo to low doses between 0.1 and 0.4 Gy produced a reduction in bone marrow micronuclei that was sustained for up to 100 days. We show their data as Figure 4B. We will discuss other very recent data, primarily from Dr. Ron Mitchels research group (Mitchel et al. 1999, 2002, 2003, 2004, Mitchel 2006, 2007a, 2007b, 2008), showing the persistence of AR effects in vivo for much longer times in the later Discussion sections of Part III (Leonard et al. 2009b). It may be that AR is sustained longer in vivo than in tissue cultures where immortalized cells are used.

The persistence and fading of adaptive response radio-protection. Panel A – From Shadley et al (1987). The normalized reduction in relative chromosome breaks as a function of delay time between administering of the 1.5 Gy X-ray “challenge” dose after the 1.0 cGy primer dose. The AR protection is shown to materialize in about 4–6 hours and is sustained for about 38 hours before fading and completely dissipating. Panel B – The data of Klokov et al (2000) showing reduction of mice bone marrow micronuclei after exposure in vivo to X-rays as a function of time after exposure. Both reproduced from Leonard (2007b) with permission.
2.3.e The Dose Region of the Dose Response Curve for the Adaptive Response Radio-protection to be Effective
We have divided the basic dose response curve into three regions i.e. the Bystander Damage Region, the Adaptive Response Region and the Direct Damage Region as shown in Figure 2. Of significant interest is the questions of “at what dose level does the AR protection begin and at what dose level does the deleterious Direct Damage begin to dominate over the protection and also what role does the quality of the radiation plays?”. The dose region of low LET radiation exposures, where humans may expect adaptive response radio-protection, depends on the size of the energy deposition for the single specific energy hits that are found to first begin to activate AR. We have compared the AR behavior of HeLa x skin cells for 137Cs 0.66 MeV gamma rays and the much lower energy 28 kVp mammogram X-rays in Figure 5. In earlier work, we examined the differences in the initiations of the adaptive response radio-protections and the beginning of the Direct Damage domination at higher doses (Leonard and Leonard 2008). The question is “At what dose or charged particle traversals does the Direct Damage begin to dominate over the AR protection?” In Figure 5A, the abscissa scale is in units of Primer Absorbed Dose where we show for both radiations that the Direct Damage component begins to dominate at a threshold of about 10 cGy but the lower dose thresholds for AR activation is quite different for the two radiations, in terms of dose. In Figure 5B, we use Primer Specific Energy Hits per Nucleus as the abscissa scale and we see that the lower dose AR thresholds coincide at a mean of one specific energy hit per nucleus but the beginning of the Direct Damage component is over a factor of 10 different in terms of hits. This is because the respective values of <z1> (which determines the AR single hit threshold) are quite different i.e. 0.638 cGy/hit and 0.060 cGy/hit for the mammogram X-rays and the 137Cs gamma rays respectively. We have found that the constancy of the Direct Damage threshold persists, in terms of dose, for the other radiations used by Dr. Redpaths group. In fact, Redpath (2007) showed this to be true in analyzing the dose response slopes of the different results for high and low spontaneous level AR experiments. We reproduce their Figure 1 as Panel C of Figure 5. This means that the dose range for the AR protection is shorter for radiations with higher <z1> value i.e. lower energy radiations, with correspondingly higher LETs. No data has shown adaptive response radio-protection being induced by naturally occurring alpha particle radiations, the lack of this then as evidenced from our Part I analysis. This may be because the <z1> values range from about 5 to 20 cGy/hit – in the region for the Direct Damage threshold, negating any observable evidence of AR by domination of the Direct Damage.

Comparing the Ko et al (2004) mammography data and the Redpath et al (2001, 2003) 137Cs data. Panel A – the simultaneous plot of the two data sets and Microdose Model fits as a function of Primer Absorbed Dose. We see that the two high dose Direct Damage curves very nearly coincide even though the LET's and <z1> values are very different, indicating the total energy deposited to the cells dictates the priming dose induced high dose Direct Damage response, not the Specific Energy for each hit. Panel B – Plot of the data and fits as a function of accumulated Primer Specific Energy Hits per Nuclei. We see that, as determined from our Microdose Model analysis, that a Poisson distributed mean of one single Specific Energy Hit activates the Adaptive Response protection. This means that Adaptive Response activation is solely dependent on a single Specific Energy Hit irregardless of the size of the energy in the deposition and independent of the Primer Absorbed Dose. Panels A and B reproduced from Leonard (2008b) with permission. Panel C – Reproduction of Redpath and Elmore (2007) Figure 1 with permission. Analysis of their combined data for 137Cs gamma rays, 28 kVp X-rays, 60 kVp X-rays, 232 MeV protons (Redpath et al 2001, Redpath et al 2003, Ko et al 2004, Elmore et al 2005) showing a threshold and linbearity of the Direct Damage dose response. Shown also is an apparent retention of the AR protection in the Direct Damage Region.
2.3.f The Potential Retention of the Adaptive Response Radio-protection at High Dose Levels in the Direct Damage Region.
Microdose Model analysis of dose response data have shown that a threshold seems to exist for the induction of the Direct Damage as dose increases when AR protection is present. Some data also show that the adaptive response protection is retained at the higher doses above the Direct Damage threshold. This has been examined in Figure 1D, 2 and 3C of Leonard and Leonard (2008). AR retention is seen to occur if, by extrapolation of the Direct Damage, linear- quadratic, region back to the origin of the dose response curve, the extrapolation intersects below the zero dose spontaneous level. The Figure 5C here of Redpath et al. (2001) shows an extrapolation well below the spontaneous level for all their AR data, thus showing AR retention even at doses where the Direct Damage dominates.
2.4 The Human Lung Cells as “Targets” for Low LET Traversals and Subsequent Energy Depositions per Traversal
2.4.a The Size of the Human Lung Target Cells Susceptible to Carcinogenesis
Section 2.3.a of Part I discusses the estimated size of the three lung “target” cell species susceptible to carcinogenesis. They are the bronchial basal, bronchial secretory and bronchiolar secretory lung cells and each vary in size and hence present different target sizes for radiation “Hits” for the radon progeny alpha particles and the low LET AR inducing radiations. This thus affects the value of <z1> and cell hit rates relative the exposure doses. For our analysis. we estimate the three cell diameters to be 9.0, 17.7 and 10.7 μm for the bronchial basal, bronchial secretory and the bronchiolar secretory cells, respectively. These are in agreement with the BEIR VI (1999) Table 2–1 data and the same data used by Little and Wakeford (2001). We use these diameters in Tables A1, A2 and A3 of Appendix A to estimate the Specific Energy Deposition per Nucleus Traversals for the low LET radiations received by the lung from human exposures at the UNSCEAR (2000) world average low LET human exposure levels (Table 1 herein).
2.4.b Method for Determination of the Mean Specific Energy per Sensitive Volume Hit – < z1 >
Section 2.3.b of Part I provides the means to determine the microdose parameter Specific Energy Deposition per Charged Particle Traversal, <z1>. It is dependent on the linear energy transfer, LD (in units of keV / μm) and the mean chord length, ℓ (in units of μm), traversed through the sensitive volume. As was the case in the earlier works (Leonard 2005, 2007a, 2007b, 2008a, 2008b, Leonard and Leonard 2008) the sensitive volume here is chosen to be the nucleus for the three human lung cell species. BEIR VI (1999), ICRP (1995) and James et al. (2004) in their analysis with respect to alpha particle traversals consider the nucleus as the sensitive region for lung cancer induction. We noted in Section 2.3.a of Part I, by considering the mean chord length per cell cross-section area, an analytical approximation for <z1> was offered by Kellerer and Rossi (1972) as a function of spherical critical volume diameter, d, and the dose-averaged linear energy transfer, LD, of the radiation, i.e.

where ρ = density of cell tissue.
We estimate the accuracy in determining the cell nucleus diameters to be about ± 20 %SD and the overall accuracy of <z1> to be ± 30 %SD due to uncertainties in Le also. The impact of this on the use of the model is addressed in Leonard (2008b).
2.5 The Methods for Assessing the Combined Influence of the Bystander Effect and Adaptive Response on Human Lung Cancer Risks
In Section 2.3 above, we showed that all types of low LET ionizing radiations will activate the adaptive response radio-protection within cells, from single charged particle traversals through the nucleus. It is necessary to identify all the low LET whole body radiations and amount of dose from each to lung tissue.
To determine the charged particle track accumulation in the lung tissue, we will evaluate the new knowledge that has been gained about both 1.) the bystander effect and general cellular response to alpha particle radiation in Part I (Leonard et al. 2009a) and 2.) the protective behavior of adaptive response as reviewed here in the above Section 2.4. As was done in the recent prior works (Leonard 2008a, 2008b, Leonard and Leonard 2008), we will use the composite Adaptive Response and Bystander Effect Microdose Model, presented in detail in Leonard (2008b) and reviewed above, to examine and evaluate the expected behavior in the human lung.
With the Microdose Model, we have found that adaptive response has the very specific behavior, in particular, that single cell low LET charged particle traversals activates the protection and the protection results in between 50 and 80% reduction in potentially carcinogenic radiation induced exogenic cellular damage and endogenic spontaneous cellular damage. The protection is afforded for alpha particle cell damage as well as low LET radiation cell damage as shown in Section 2.3.c. The protection is relatively independent of the type of priming dose radiation quality, encompassing low and high energy X-rays, beta rays, gamma rays and even high energy cosmic protons. We have seen in Section 2.3.f that, at higher doses, the protection may be retained but at about 10 cGy of exposure the excessive damage from the priming dose begins to dominate. In Section 2.3.d, we showed that the duration of the protection, from dose rate and fading studies, is at least through one cell mitotic cycle and thus we will evaluate the charged particle traversals to the lung cells for the 30 day mitotic cycle (James et al. 2004).
3. RESULTS
3.1 General Approach to Assessment
A fundamental unknown, at the time the BEIR VI (1999) report was drafted was the amount of influence adaptive response has on radon progeny alpha particle initiation of human lung cancer. We here endeavor to assess the magnitude of adaptive response radio-protection that humans receive from the various low LET radiations received by humans on a routine, day-to-day basis. Based on the extensive supportive data, some of which is presented in the prior sections, we assume that single radiation induced charged particle traversals activates the Poisson transition of each traversed cell to the adaptive response radio-protective state. In Appendix A, we first tabulated the low LET radiations that an average person would receive using the United Nations worldwide average values for each of the radiation components. The UNSCEAR (2000) worldwide human exposures are provided in Table 1. In Table A1 of Appendix A, the radiations are listed with the energies, fraction of decays and the LETs (Attix 1986) for each radiation component. As was explained above, to obtain the number of charged particle traversals, the Specific Energy Deposition per Traversal, <z1>, is required. In Section 2.4.b, using Equation (7), it is shown that the diameter of the “target” cell as well as the LET of the radiation is needed. In Table A2, the LETs and the cell diameters of the three sensitive lung cells, bronchial basal, bronchial secretory and bronchiolar secretory, are given. In Table A2, using the UNSCEAR (2000) human exposure levels and the calculated <z1> values for each natural background and man-made radiation component is tabulated. The number of cell traversals (hits) occurring in one cell cycle (30 days) is then tabulated as a final result. These are for the worldwide annual average low LET radiations, giving traversals per 30 day cell cycles, and at the median radon concentration of 24.3 Bq m−3. In Table A2, we find that a significant fraction of the lung cells are traversed by single low LET charged particles and a sizable adaptive response radio-protection must be present i.e. 28.6%, 72.9% and 37.9% in the three respective cells.
We are interested in evaluating the magnitude of the AR protection as a function of varying human radon exposure and varying low LET human exposures. As noted, there are two lung dose components that vary with radon concentration. They are 1.) the radon progeny beta ray dose to the lung, that varies linearly with radon concentration and 2.) the terrestrial Uranium gamma ray dose which we have evaluated from USGS data and some indoor gamma ray measurements and presented in the following sections. By conservatively assuming the other human exposure components remain at the worldwide averages, we have estimated the variation in lung cell traversals with increasing radon concentration. As Table A3, we show a section (for Basal lung cells) of the spread sheet used to tabulate the Specific Energy Hits to the lung cells as a function of increasing radon concentration.
3.2 Effectiveness of Low LET Radiations in Providing Single Charged Particle Traversals to Lung Tissue
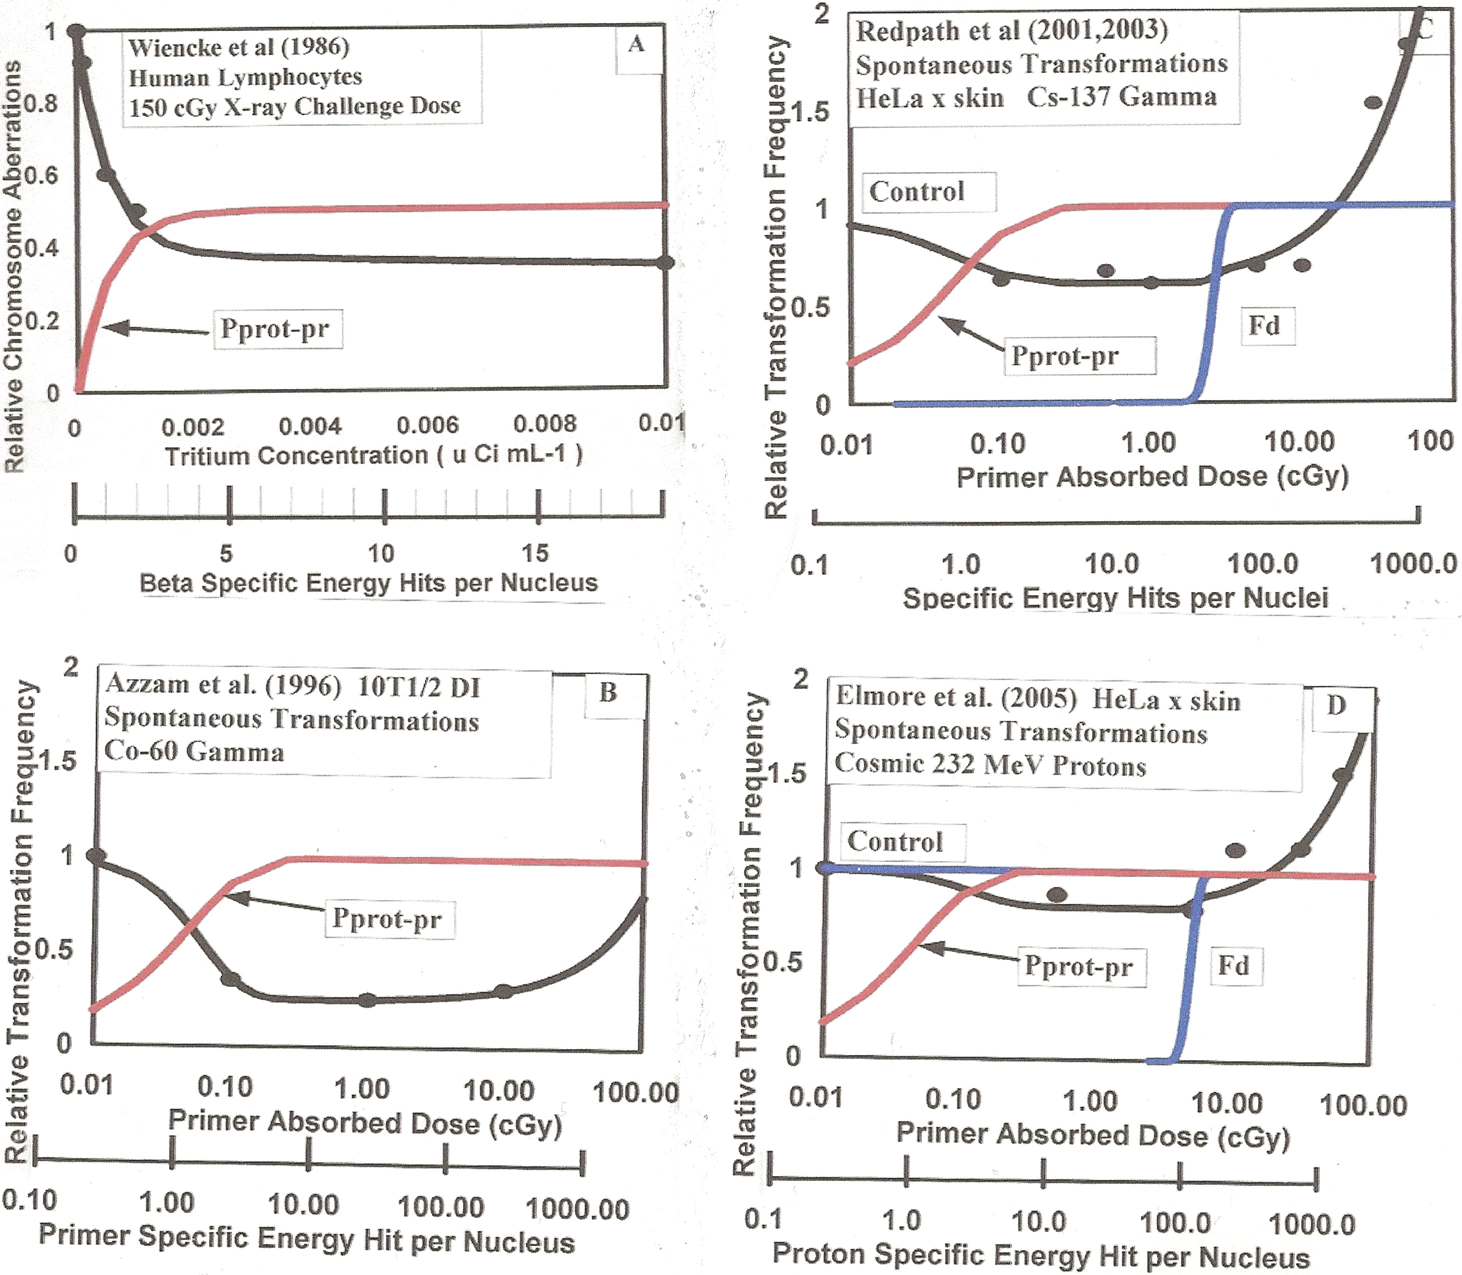
Humans receive a substantial amount of low LET ionizing radiations from natural background and man-made radiation sources. In Section 2.3, we have cited numerous radio-biology data showing that cells undergo a hormesis type adaptive response protective behavior from very low doses of low LET radiation. It has been shown that single, radiation induced, charged particle traversals through the cell nucleus activates this AR protection. It has also been shown that beta rays, X-rays and gamma rays seem to be equally effective in inducing this AR protection. This is substantiated by the low energy, 0.0186 MeV tritium beta AR data of Wiencke et al. (1986), the 28 kVp X-ray AR data of Ko et al. (2004), the 60 kVp diagnostic X-ray AR data of Redpath et al. (2003), the 250 kVp X-rays AR data of Shadley et al. (1987), the 31–35 keV photons 125I brachytherapy AR data of Elmore et al. (2006), the 0.66 MeV 137Cs gamma ray AR data of Redpath et al. (2001), the 1.17–1.33 MeV 60Co gamma ray AR data of Azzam et al. (1996) and the cosmic ray level 232 MeV proton AR data of Elmore et al. (2005). The range of low LET values that span these radiation sources is from about 0.1 to 2.0 keV/μm and the range of Specific Energy Depositions per Cell Nucleus Traversal, <z1>, is from about 0.02 to about 1.0 cGy/hit. The transmission range in tissue is from about 0.01 to 1.0 cm and therefore a 1 MeV photon produced electron or a beta ray will traverse many cell diameters compared to the μm range alpha particles in tissue. Figure 2-1 of BEIR VI (1999) illustrates the large difference in tracks for 1 Gy of low LET tracks (1000 tracks) to high LET alpha particles (4 tracks). We provide as Figure 6, a chart relative to beta or photon producing electrons and alpha traversals. Shown in the upper section are the effects from low LET radiation, 10 MeV protons and 4 Mev alpha particles in terms of LET and number of cells traversed. In the lower section, specifically for radon progeny beta rays and the 7.69 MeV 214Po radon progeny alphas, we give the range in tissue, the LET and <z1> showing a considerably lower dose of the radon progeny beta rays is capable of delivering the necessary single charged particle traversal to the lung cells to induce AR protection against chromosome damage inducing lung cancer. The radon progeny are deposited on the interior lung air passage surfaces, and become located primarily in the mucous gel and cilia regions [see Figures 9-2 through 9-5 of NRC (1991)]. In the lower two panels of Figure 6, we reproduce graphs of Nikezic and Yu (2001) that show the relative location of the basal and secretory cells relative to the radon progeny. The average alpha particle emitted from the progeny is attenuated by at least 50% before reaching the three cancer sensitive cells. The attenuation of the progeny beta rays is negligible. Strictly from an energy deposition basis, the total beta disintegration energy is 2.12 MeV, from Figure A2 and Table A1. The total energy of the two alpha particles is 6.00 + 7.69 = 13.69 MeV. If 50% is lost by attenuation then the deposition energy of the betas to the target cells is about 31%. Thus the progeny beta rays contribute a significant amount of low LET radiation, and potential adaptive response protection, to the sensitive lung tissue.
Top Panel – Graphics showing the difference in tissue interactions of low LET radiation induced charged particles and high LET alpha particles. Bottom Panels – Left, Alpha particle fluence as a function of distance through human lung tissue. Right, Location of basal and secretory cells depth in human lung tissue.
3.3 Properties, Magnitudes and Variations of Radiation Sources to Humans
3.3.a Sources of Low LET Radiations Experienced by Humans
In Table 1 and Section 3.3.a.1 below, we identify the various components to the radiations received by humans, for the purpose of assessing the AR inducing low LET radiations to the human lung that can activate adaptive response radio-protection to the lung cells and affect the risk probabilities of human lung cancer from radon progeny alpha particles. We then, in Appendix A, used the United Nations world-wide average exposure rates (UNSCEAR 2000) of these low LET components, given in Table 1, to estimate the low LET charged particle traversals to the three most sensitive lung cells i.e. bronchial basal, bronchial secretory and bronchiolar secretory cells, for potential AR activation. Then the special effects like the statistical distributions of these world-wide averages, from variations in geological and ecological conditions, are considered with respect to a high and low range of human exposure to these AR inducing charged particle traversals. The variations of, for example, U series terrestrial dose and beta radon progeny dose with radon indoor concentration are considered.
3.3.a.1 World-wide Averages of Human Low LET Exposures
Americans receive a population averaged annual dose equivalent of about 2.4 mSv of background radiation of which 39 % is low LET, consisting primarily of about 20% terrestrial gamma rays, 12% a cosmic ray component and 7% internal (ingestion) component, and 52 % from high LET radon progeny (BEIR VII 2006). We also receive an annual average of about 0.5 mSv of man-made radiation, of which at least 98 % is low LET. Thus, the major components of our total population averaged annual dose of 2.9 mSv is about 1.44 mSv low LET and about 1.25 mSv high LET radon progeny alphas. The United Nations Scientific Committee on the Effects of Atomic Radiation (UNSCEAR 2000) provides slightly different values for world-wide averaged human exposures and provides a more detailed break-down of the various components (summarized in Table 1). They estimate the external exposure from cosmic rays to be 0.3 mSv for the directly ionizing component and 0.055 mSv for cosmic neutrons. The internal cosmogenic dose is about 0.010 mSv. From external natural radioactivity exposure, they estimate 0.15 mSv for 40K, 0.100 mSv for the 238U series and 0.160 mSv from the 232Th series. Internal exposure from ingestion of radio-isotopes is estimated to be about 0.18 mSv from potassium-40, 0.006 from 87Rb, 0.005 mSv from 238U transition to 234U, 0.007 mSv for 230Th, 0.007 from 226Ra, 0.12 mSv from 210Pb transition to 210Po, 0.003 from 232Th, and 0.013 from 228Ra to 224Ra. The total annual exposure from natural sources equals about 0.765 mSv external and 0.356 mSv internal. UNSCEAR (2000) estimates that humans receive about 0.4 mSv from diagnostic medical exposures. Rounded off UNSCEAR (2000) values for the net components are in their report to the UN General assembly are external cosmic rays 0.2 mSv, external terrestrial gamma rays 0.5 mSv, medical 0.4 mSv, internal Ingestion 0.3 mSv and inhalation 1.2 mSv of which 1.1 mSv is considered radon (with a US median of 24.3 Bq m−3 concentration). Then the non-radon human exposures, which would be about 99% low LET, is 1.7 mSv per year. There are special considerations relative to the terrestrial radiations with respect to the relative contributions of the three components, Uranium series, Thorium series and Potassium-40 and their indoor distributions. Also, it is known that there is a correlation between the indoor radon concentration and the Uranium series indoor component, which we will address in the next section. Further, as we showed for the Pohl-Ruling (1988) data in Figure 2D and evaluated by Jostes et al. (1991), the beta ray dose from the lung deposited radon progeny contributes a significant number of lung cell low LET charged particle traversals that increases with increase in radon concentration. So the world-wide averages for U series dose and progeny beta dose is coupled to the worldwide variation in indoor radon concentration.
3.3.b Special Consideration for Terrestrial Radiation Components and Distributions.
3.3.b.1 Local Variations – USGS and EPA Terrestrial Gamma and Radon Concentrations
We next examine the variability of the human exposures worldwide using the UNSCEAR (2000) maximum and minimum range values in Table 1. In quoting US or world-wide averages for human exposure to ionizing radiations, usually a statistical range is also given, for example by BEIR VII (2006) and UNSCEAR (2000). More specific data are provided by the United States Geological Service (USGS) for the US lower 48 states (Duval et al. 1989, Phillips et al. 1993). An extensive program of mapping the terrestrial radiation components, U, Th and 40K exposures at 1 meter above ground level has been completed using highly sensitive aerial radiation monitoring equipment. Details relative to the airborne gamma ray method are found in a NOAA report (NOAA 2008), a DOE report (DOE 2002) and Schwartz et al. (1995). Figure 7 provides four maps of the terrestrial Gamma-Ray Exposure at 1 meter above ground. The first panel shows the net from all three gamma ray sources in units of μR/h (1 R = 1 Roentgen = 0.86 Rad = 0.86 cGy). The other three maps show the gamma radiation levels for Uranium, Thorium and 40K. The units for U and Th are parts per million (ppm) and for 40K are %K. To obtain the exposure dose rates for each and total, the USGS conversion equation is

We show the gamma ray spectra for the three components as Figure A1 of Appendix A. It is seen that the South-west region of the US shows the major gamma ray exposure for all three components. The Pacific North-west and Florida are seen to be the lowest terrestrial gamma ray exposure regions. Digital reports have been issued by USGS presently for only the Uranium series gamma ray dose data (in ppm) by counties for all states, in an Excel spread sheet.
EPA distributed maps are available for geometric mean radon levels in the US, also. We show as Figure 8A, a map of the geometric mean residential radon concentrations by states in pCi/L units. As Figure 8B, we provide a map of the US showing by county the mean residential radon levels in fractions of homes over 4 pCi/L. The EPA High-Radon Project has also provided in Excel spread sheet format itemized data on individual radon measurements organized by counties in each state.
3.3.b.2 Local Variations – Special Measurements of Radon and Gamma Ray Distributions
Relative to the distribution of the terrestrial gamma ray exposures, the state of California has been mapped and digital data provided by county has been provided (EPA 2003)). We have analyzed the distributions of the U, Th and 40K county data and provide these as Figure 9. The average total terrestrial gamma ray dose rate in California is 53.1 nGy/h. The respective gamma ray dose rates for the three components, U, Th and 40K, are 14.3, 18.8 and 20.0 nGy/h. The data has been fit to Normal Distribution functions with σ's of 5, 9, and 9.9 nGy/h and standard errors of 0.8, 0.9 and 1.0 nGy/h, respectively. From another part of the world, Clouvas et al. (2001) have preformed detailed indoor radiation measurements in over 1000 Greek homes. They used a high resolution Germanium gamma ray detector system to resolve the separate gamma rays from the Uranium, Thorium and Potassium isotopes. Figure 10 provides their dose rate distributions for the U, Th and K sources. Their gamma spetra are shown as Figure A1 in Appendix A. We have best fitted the data more accurately to log-normal distributions than a normal distribution, however the Potassium data showed a distribution between a normal and a log-normal. The total mean gamma dose rate was 47.0 nGy/h. The three components dose rates were 14.1, 15.3 and 17.5 nGy/h for U, Th and K respectively.

Reproduction of USGS terrestrial radiation maps (Duval et al 1989) for total gamma ray exposure and separate exposures from Uranium series, Thorium series and Potassium-40.
Clouvas et al. (2006) recently performed a new survey of Greek homes where both indoor gamma ray dose rates and radon concentrations were measured. In a total of 311 homes, the total gamma ray dose rate was 58.33 ±12.15 nGy/h and the three components were 14.61 ±3.80 (U), 20.81 ± 3.78 (Th) and 22.92 ± 4.92 (K) nGy/h. The average radon concentration was 34 Bq m−3. The distributions for the total indoor gamma ray dose rate is shown in Figure 11A and the distribution for the radon concentration is presented as Figure 11B. The gamma ray data reflects a Normal Distribution and the radon a Log-Normal Distribution. We show, for the radon data, the lung cell nucleus traversals for the three sensitive lung cell species based on James et al. (2004) values given in our Figure 11B. What is shown is that even on a local basis humans are exposed to a large range of radiation levels from the exposure sources, within the very large range of mean values worldwide. This means that one would expect to see a wide range of natural background and man-made radiation induced Adaptive Response radio-protection from the wide range of radon and progeny alpha induced lung damage as seen in the case-control studies [see Figure 2 of Part I (Leonard et al. 2009a)].

Reproduction of EPA radon maps (EPA 2003) showing indoor radon levels by states and by counties.

Analysis of the terrestrial gamma ray data from EPA (2003) for the state of California by counties providing Normal Distribution for each component and the geometric mean averages. Panel A – Total gamma ray. Panel B – Uranium series gamma ray. Panel C – Thorium gamma ray. Panel D – Potassium-40 gamma ray.

Analysis of the frequency distribution data of Clouvas et al (2001) for residential terrestrial gamma ray exposure showing Log-Normal Distributions and mean values. Panel A – Total gamma ray. Panel B – Uranium series gamma ray. Panel C – Thorium gamma ray. Panel D – Potassium-40 gamma ray.

Analysis of separate data by Clouvas et al (2001) showing indoor gamma ray dose rates and indoor radon concentration distributions. Also comparisons of radon concentration (EPA) and terrestrial Uranium gamma ray dose (USGS), for Arizona Nevada and Missouri, showing large variation in relative levels for the terrestrial Uranium gamma ray dose depending on geological localities. Panel A – Clouvas et al (2001) gamma ray data. Panel B – Clouvas et al (2001) indoor radon data showing a Log-Normal Distribution. Panel C – Radon (EPA 2003) and Uranium gamma ray (USGS) data.
3.4 Correlation Between Terrestrial Uranium Gamma Ray Dose and Radon Indoor Concentration
It has been known that the Uranium series indoor gamma ray dose correlates with the indoor radon concentrations. This is because radon and its progeny are decay products in the Uranium series. Several investigators have examined this correlation. Clouvas et al. (2003) performed a limited study comparing the Uranium series gamma dose rate with radon levels and found minimal correlation primarily due to a small number of data sets. Pilkyte and Butkus (2005) obtained measurements in 609 individual rooms in Lithuania and found considerable scatter in the data but a linear variation of Total Gamma Absorbed Dose Rate (nGy/h) = 121.5 nGy/h + 0.03 (nGy/h per Bq m−3) C (Bq m−3) where as noted C is radon indoor concentration in Bq m−3. We have converted the linear equation to Annual Gamma Dose in mSv (for gamma rays we let 1 mGy = 1 mSV) and show the curve as a solid blue line in Figure 12A. Also, Makelainen et al. (2001) examined a possible correlation in homes in Finland. They also found a loose correlation and found a difference between wood and masonry constructed homes. Their three data points for each case (wood and masonry) are shown in Figure 12A. The most significant data on indoor gamma ray dose and radon concentration are that obtained by the Canadian province of British Columbia in a study of human indoor doses from natural and man-made radiations. The study was performed by the British Columbia Centre for Disease Control (BC 2008). From the data for 22 provincial territories, we provide, in Figure 12A, the terrestrial annual dose equivalent data is given by sorting with respect to radon concentration also in mSv. In Figure 12B, we show three of the components in the British Columbia study (BC 2008) i.e. the cosmic ray gamma component which is found to vary slightly with increasing radon levels, the terrestrial gamma ray dose, the internal dose and the sum of the indoor gamma cosmic and terrestrial. The sum curve is the same as shown in Figure 12A. These data show that the terrestrial gamma ray dose increases with increasing indoor radon concentration. As we noted, it has been known that the Uranium content found in local soils and in building materials correlates with indoor radon concentration levels [as suggested by the Makelainen et al. (2001) data and USGS]. The connection with the Uranium series is because radon and its progeny are part of the Uranium decay series. A fundamental question is whether the Potassium-40 and Thorium series show some correlation also. Figure 12C provides a graph of the variation of U and Th, by ratios, with increasing observed K-40 levels. We see that the Th gamma ray dose is relatively linear with K-40 gamma ray dose. The Uranium dose shows significant variation indicating that the U dose varies with radon concentration whereas the other two gamma components are relatively constant. For the British Columbia (BC 2008) data presented in Figure 12B, we can estimate the variation in Uranium with respect to indoor radon levels by assuming that UNSCEAR (2000) world-wide ratios for U, Th and K-40 are valid. From the Table I from the UNSCEAR (2000) report, the U, Th and K-40 values are 0.100, 0.160 and 0.150 mSv, respectively. By assuming that these relative values apply for BC (2008) at the median radon concentration of 24.3 Bq m−3 and the Th and K-40 dose equivalents remain constant at those levels, we obtain the variation in Uranium Dose Equivalent with radon concentration. We show this in Figure 12D.

Examination of correlation between variation in terrestrial Uranium gamma ray dose and variation in indoor radon concentration. Panel A – Graphical presentation of U gamma and radon data from Pilkyte and Butkus (2005), Makelainen et al (2001) and the British Columbia radiation survey (BC 2008). Panal B – The variation of indoor cosmic ray, indoor terrestrial and internal dose with increasing indoor radon concentration. Panel C – A linear-quadratic least squares fit to the British Columbia (BC 2008) terrestrial gamma ray dose.
In the previous section, we showed how, from location to location, the radiation levels vary considerably. Another estimation of the correlation between the Uranium series gamma terrestrial dose and radon concentration was obtained from the USGS Uranium Concentrations Data File by US counties from the High-Radon Project: (NURE 1986). The data is given in ppm Uranium. With the 5.48 nGy/h per U ppm conversion factor [see Equation (9)] the mean Uranium dose equivalent for each county is available. To accompany this data, we have used the EPA State Residential Radon Survey ASCII data (EPA 2003) which lists individual indoor radon measurements by county in each state. A total of over 51,000 data sets are provided. We have chosen the California and the Idaho state data sets (EPA 2003) and averaged the radon concentration results for each county in these two states. We herein shall refer to these selective data from EPA (2003) as CA/ID. A total of 1886 indoor radon concentrations in the 53 counties were used for the California data. For Idaho, there were 1266 radon data sets for the 41 counties. Figure 12E provides the county averages data points as a function of radon concentration. Shown are also the separate 5 point smoothed curves, for California and Idaho, and the data least squares fitted to a linear-quadratic curve. The separate fits were very similar. For California, we obtained

where C is radon concentration in Bq m−3. For the Idaho data, we obtained

The purple curve is the averaged composite fit with

For the over 3000 radon data sets, we find that there is a significant variation in Uranium gamma ray dose with increasing indoor radon levels. It is significant that, using the median radon concentration of 24.3 Bq m−3 in the Equation (9), we obtain a Uranium gamma dose of 0.0879 mSv per year. The UNSCEAR (2000) estimated world-wide value is 7 nGy/h = 0.0964 mSv per year for the low LET gamma rays. It is seen that, at very low radon levels, the Uranium gamma ray dose is about 1/2 the level at the mean radon concentration of 24.3 Bq m−3. As Figure 12F, we provide the British Columbia (BC 2008) and the composite CA and ID Uranium Gamma Ray Dose Equivalent curves with their estimated standard errors (EPA 2003). We will use these estimates for the correlation of terrestrial Uranium gamma ray dose with indoor radon concentration and AR inducing charged particle traversals for the Uranium gammas with varying radon concentration.
3.5 Lung Dose from the Low LET Beta Rays Emitted from the Lung Deposited Radon Progeny
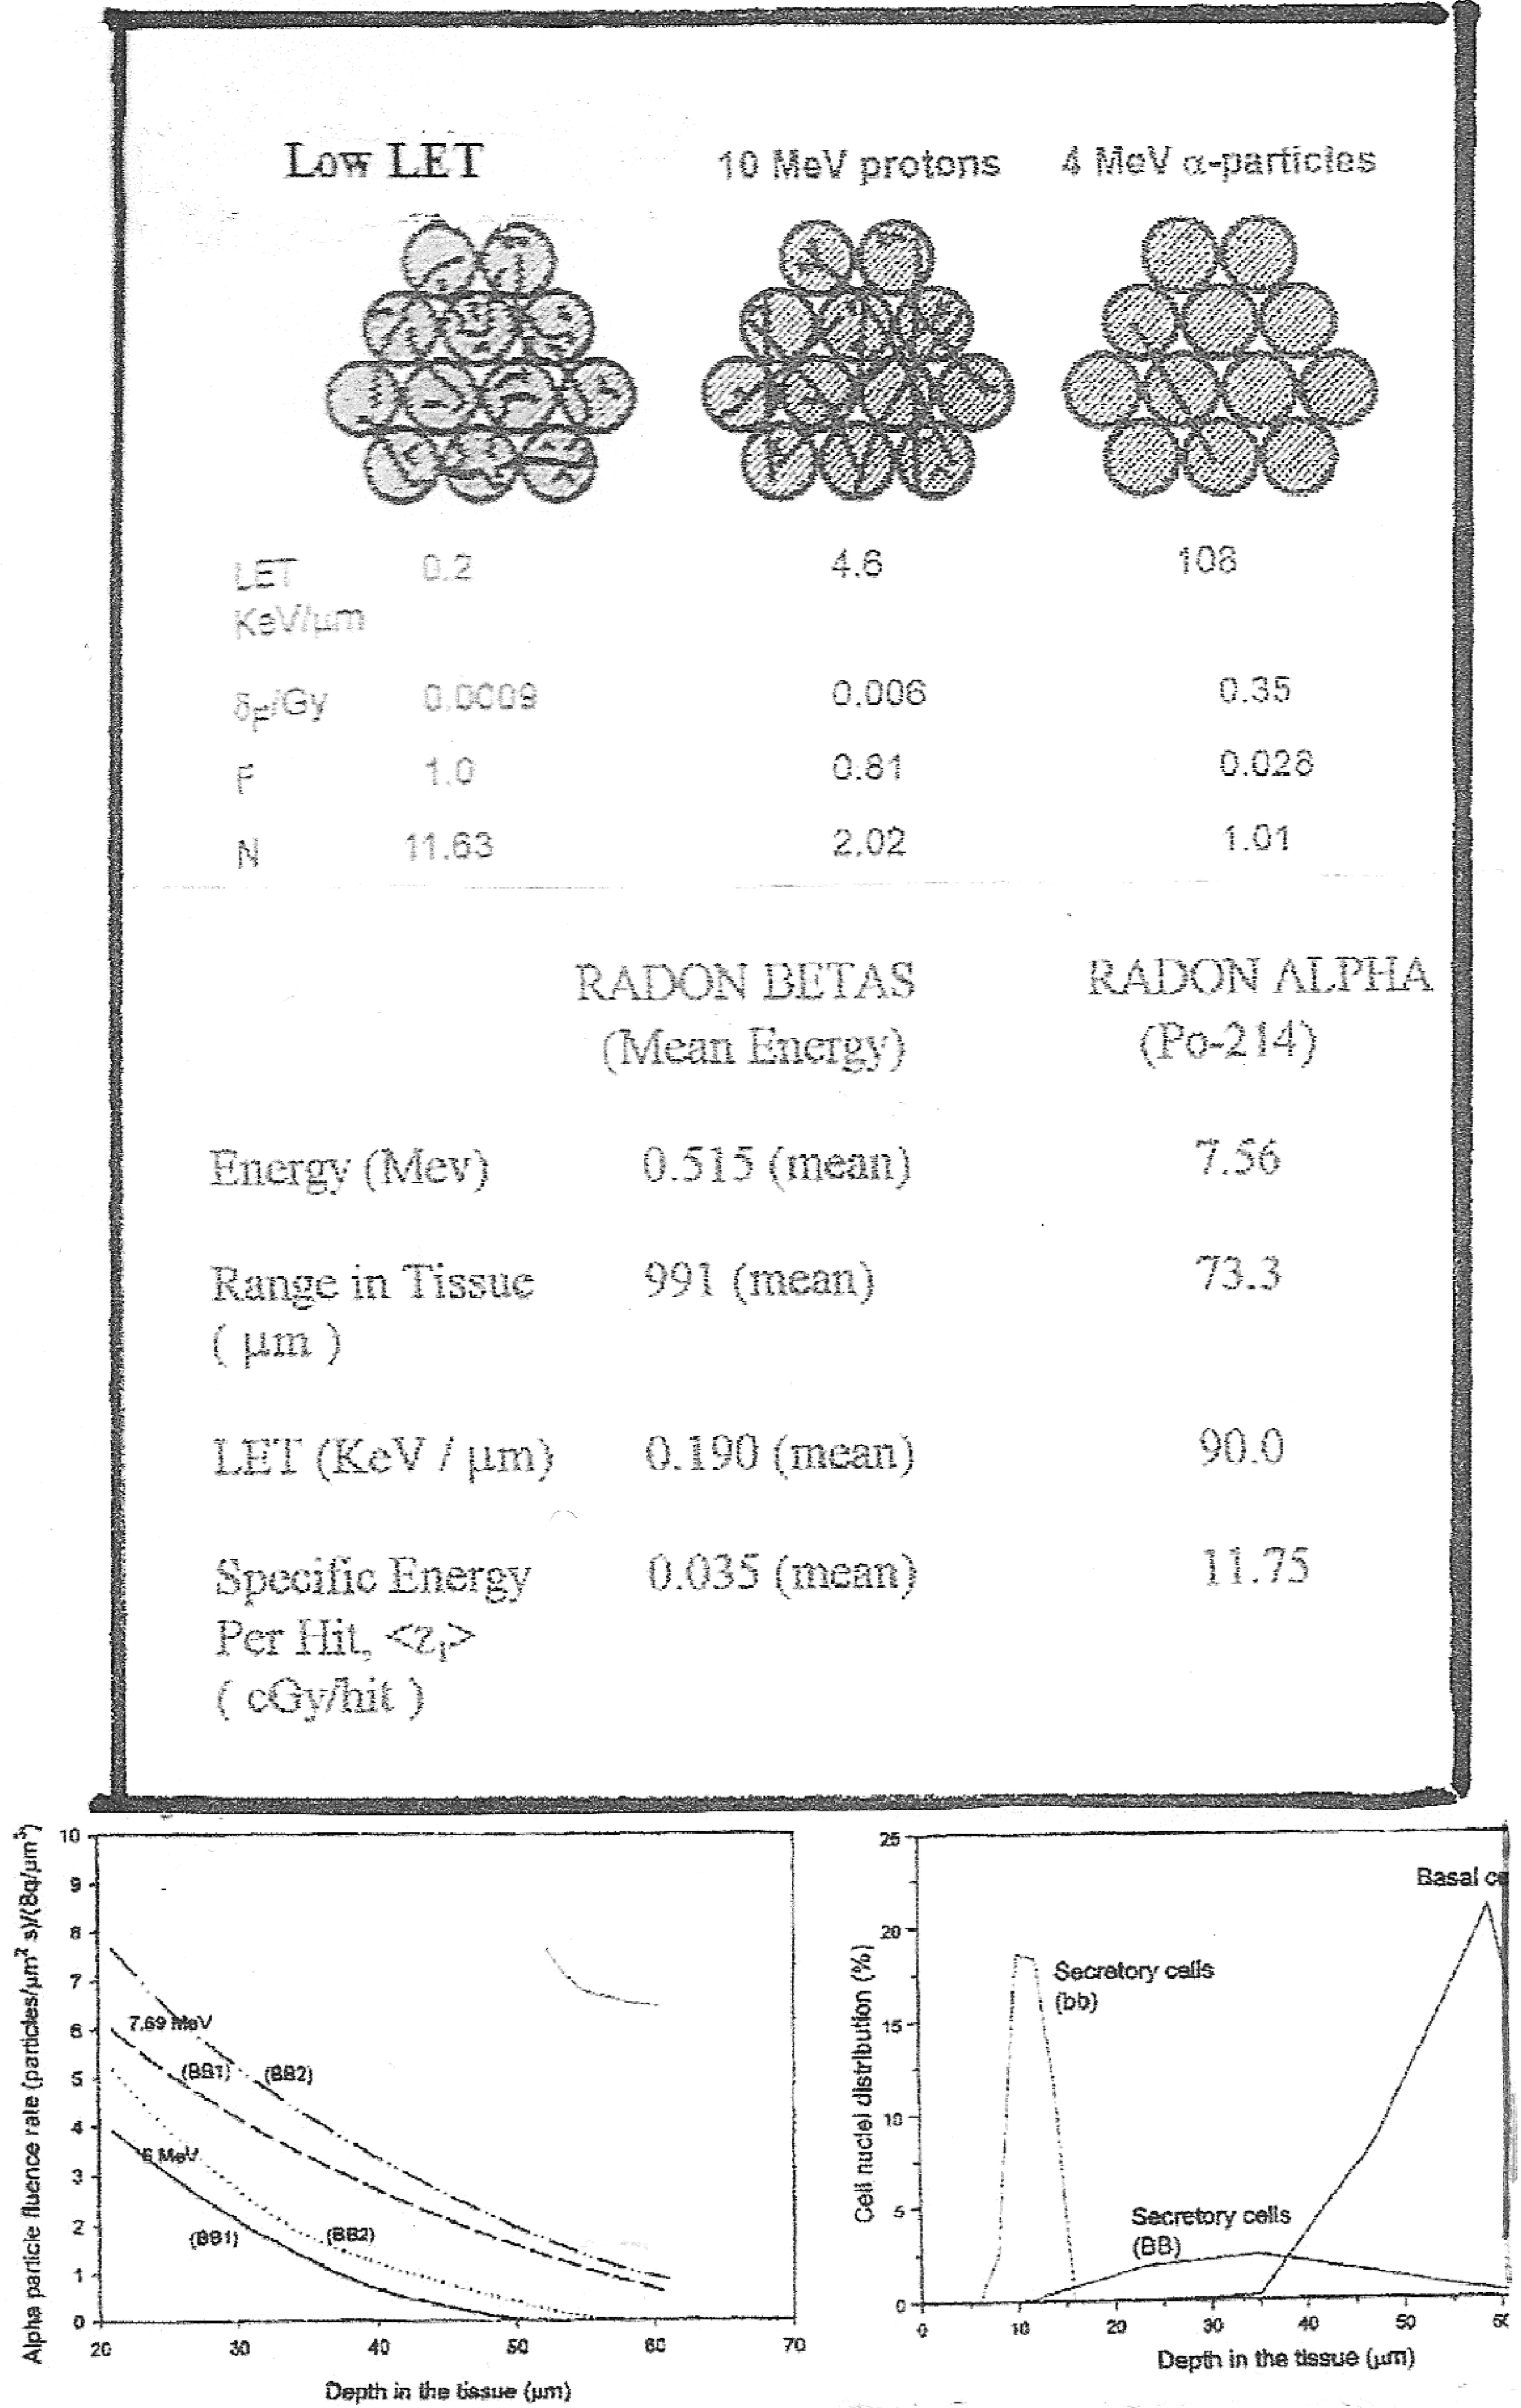
The radon gas and its progeny emit 14 different energy gamma rays and 7 different energy beta rays as seen in Figure A2. In most instances the effects of the radon progeny beta and gamma rays have been neglected when assessing the health risks from radon. This has been true for the BEIR Committee reports and even a recent extensive analysis by Kendal and Smith (2002) of doses to the lung and various other human organs and tissues. The neglect of these low LET radon progeny radiations is reasonably prudent since their LETs and hence RBEs are so much lower than the radon and progeny alpha particles as seen from the Miller et al. (1995) data in Figure A3 of Part I (Leonard et al. 2009a). The mean free path in tissue of the progeny gamma rays (Rockwell 1956) vary from about 5.6 cm (for the 222Rn 0.19 MeV gamma ray) to about 22 cm (for the 214Bi 2.44 MeV gamma), thus the gamma rays are correctly assumed to escape interaction to the lung tissue when emitted within the lung tissue itself from the deposited radon progeny. The case for the progeny betas is quite different in our effort to account for single traversals through the lung cells. As seen in the Figure 6, a progeny emitted beta ray is locally absorbed but traverses many cell diameters in its slowing down process. Only in a few cases involving radon research has radon progeny beta ray dose from radon progeny been evaluated, such as the extensive program of Cross (1988) in vivo exposure of dogs to high levels of radon and the in vitro exposure of human lymphocytes to radon progeny radiations (Pohl-Ruling 1988). A special team of dosimetry specialists evaluated the beta dose in the exposures (Jostes et al. 1991) for both the Cross (1988) and Pohl-Ruling (1988) studies. For the Pohl-Ruling (1988) exposures they estimated that about 5% of the dose was radon progeny beta dose since radon gas was a principle exposure source as well as the progeny. This is because much of the betas energy is expended outside the very thin in vitro samples. For the beta rays emitted from the radon progeny deposited in the lung, we estimate the beta dose to be about 20% of the radon dose in mGy. The beta dose will vary linearly with radon concentration i.e. we let

As Figure 13A, we show the radon progeny beta annual dose equivalent as a function of radon concentration. To consider the two lung radiation sources that are shown to vary with radon concentration (the U terrestrial shown in Figure 12D) and the radon betas, as Figure 13B we show the total variation of U terrestrial dose equivalent for the 30 day lung cells mitotic cycle from the British Columbia and the CA/ID data. Shown are the standard errors also.
4. ANALYSIS
4.1 Computation of the Lung Cells Specific Energy Hit Rate at UNSCEAR (2000) World-wide Average Low LET Human Exposure Rates
We have mentioned that, in Appendix A, we have computed the dose components for the UNSCEAR (2000) world-wide averages. In Table A1, we provide the tabulation of the individual external and internal radiations making up the total exposures. Given are the energies of the betas and gamma rays, the percent of decays for each decay transition for K-40, the Uranium series, and the Thorium series and the proton cosmic rays. Also given are the individual LETs for each radiation. In Table A1, the LETs for K-40 and the U and Th series are averaged based on their percentage of decays. From these the Specific Energy Depositions per Hit are computed and finally the Hits to the three sensitive lung cells for a 30 day mitotic cycle are given. In Table A2, we compute the mean Specific Energy Depositions per radiation induced charged particle through the three sensitive lung cell components, <z1>. We provide the tabulation of the total charged particle traversals from all the components to examine the probability of single traversals to activate adaptive response protection. The Tables are described in more detail in Appendix A. From these calculations, we estimate that 0.338, 1.306 and 0.477 specific energy hits per cell cycle are received per basal, bronchial secretory and bronchiolar secretory cells, respectively, at the UNSCEAR (2000) world-wide average human annual radiation exposure levels. With these Poisson distributed mean Hits, 29%, 73% and 38% respectively of the three sensitive lung cells are protected. By neglecting the progeny beta dose and the Uranium gamma dose that vary with radon concentration, at zero radon concentration, 0.150, 0.656 and 0.239 cells are hit, providing about 10%, 58% and 20% adaptive response protection to humans not even exposed to radon.
Panel A – Estimation of the variation in lung beta dose from the radon progeny deposited in the lung as a function of radon concentration. Panel B – Estimation of the human lung dose from the terrestrial Uranium gamma ray dose as a function of radon concentration. Shown is the estimated based on the British Columbia (BC 2008) and for the CA/ID (EPA 2003) data.
4.2 Radon Variation – Combined Alpha Particle Bystander Effects and Adaptive Response Protection for UNSCEAR (2000) World-wide Average
We have concluded, for our evaluation here of the specific energy hits to the human lung cells, that an assumption of constant dose rates for the human doses from medical, cosmic, internal, Thorium series and Potassium-40, based on UNSCEAR (2000) world-wide averages is sufficient for our analysis. We have however concluded that the dose rates for the terrestrial Uranium series gamma rays and the beta ray dose rate from the deposited radon progeny must be treated as variable in our analysis. In Figure 13B, based on the terrestrial Uranium gamma ray dose variations with radon concentration from the British Columbia and the combination CA and ID data in Figure 12, we have provided the estimated variation in the doses from the terrestrial Uranium gamma ray dose in the two cases. Both are normalized to the UNSCEAR (2000) world average of 0.122 at the indoor radon median radon level of 24.3 Bq m−3. We allow the Uranium dose to vary with radon level. We have then used the same method as in the Appendix A Tables A1 and A2 in Table A3 to compute the Specific Energy Hits per 30 day cycle as a function of varying radon concentration for the variation in beta dose with radon variation but for the two separate Uranium gamma ray variation cases. Figures 14A, 14B and 14C provide these data for the British Columbia for the three lung cell species. Figures 15A, 15B and 15C provide the Specific Energy Hits per 30 day cycle for the CA/ID case. We show, in Table A3, each components contribution to the overall net Specific Energy Hits per Nucleus per 30 day cycle. Where the net Specific Energy Hits curve crosses unity, a Poisson mean of one charged particle traversal has occurred per cell nucleus. As Figures 16A and 16B we show the adaptive response protection factor in blue, the alpha particle Excess Relative Risk from the Bystander Effect and Direct Damage without AR protection and the Net Dose Response (in terms of Radon Lung Cancer Risk) considering the alpha particle damage and also the adaptive response protection against the damage from the Specific Energy Hits in Figures 14 and 15.
Having obtained an estimate of the variation in adaptive response radio-protection as a function of increasing radon concentration at the residential radon level up to 1000 Bq m−3, we now can estimate the reduction in Relative Lung Cancer Risk starting with the dose response curves in Figure 16 of Part I. Figure 16C of Part I extends the radon level to 2500 Bq m-3. In Figure 16 herein, for the UNSCEAR (2000) world-wide average doses, still comparing the British Columbia and the CA/ID separate calculations, we show this normalized representative alpha particle dose response, without AR reduction (red curve), from Figure 16, Part I. The blue curve is the magnitude of the AR protection based on the estimate in Figure 14 of Specific Energy Hits (next to last column in Table A3) and the Table A3 calculation of AR protection (last column). The black curve is the net Relative Lung Cancer Risk for the two calculations [BC (2008) and CA/ID]. We see that there is little difference in the results in separately considering the estimated terrestrial Uranium gamma ray dose based on the British Columbia data and the California and Idaho (CA/ID) data. In the subsequent analysis, in Figures 17 and 18, we will report the use of only the British Columbia data believed to be more accurate since they were field measured.

British Columbia U gamma data (BC 2008). The variation in lung Specific Energy Hits for the separate dose components as a function of increasing radon concentration exposure. The cosmic, internal, medical external Thorium series and external K-40 are assumed constant at the UNSCEAR (2000) worldwide averages. The radon progeny beta and Uranium gamma doses are varied according to Figure 26 with increasing radon concentration. Panel A – Bronchial basal cells. Panel B – Bronchial secretory cells. Panel C – Bronchiolar secretory cells.

Same as Figure 27 except for using the lower CA/ID U gamma ray data (EPA 2003) for Specific Energy Hits with increasing radon concentration.

Based on the data in Figures 27 and 28 of Specific Energy Hits, the estimated human lung dose response to alpha particle traversals (red curve) and to the adaptive response radio-protection (blue curve) and the combined effect on the human lung cancer risks with increasing radon concentration. Panel A – The British Columbia data (BC 2008) from Figure 27. Panel B – the CA/ID data (EPA 2003) from Figure 28.

Considering the variation in human annual dose levels, based on UNSCEAR (2000) data, from variation in geological and ecological conditions, the estimated maximums and minimums are used to calculate the range of adaptive response radio-protection that may be expected from the range of Specific Energy Hits based on these variations. Panel A – Maximum for British Columbia Uranium dose data (BC 2008). Panel B – Maximum for CA/ID data (EPA 2003). Panel C – Minimum for British Columbia data (BC 2008). Panel D – Minimum for CA/ID data (EPA 2003).
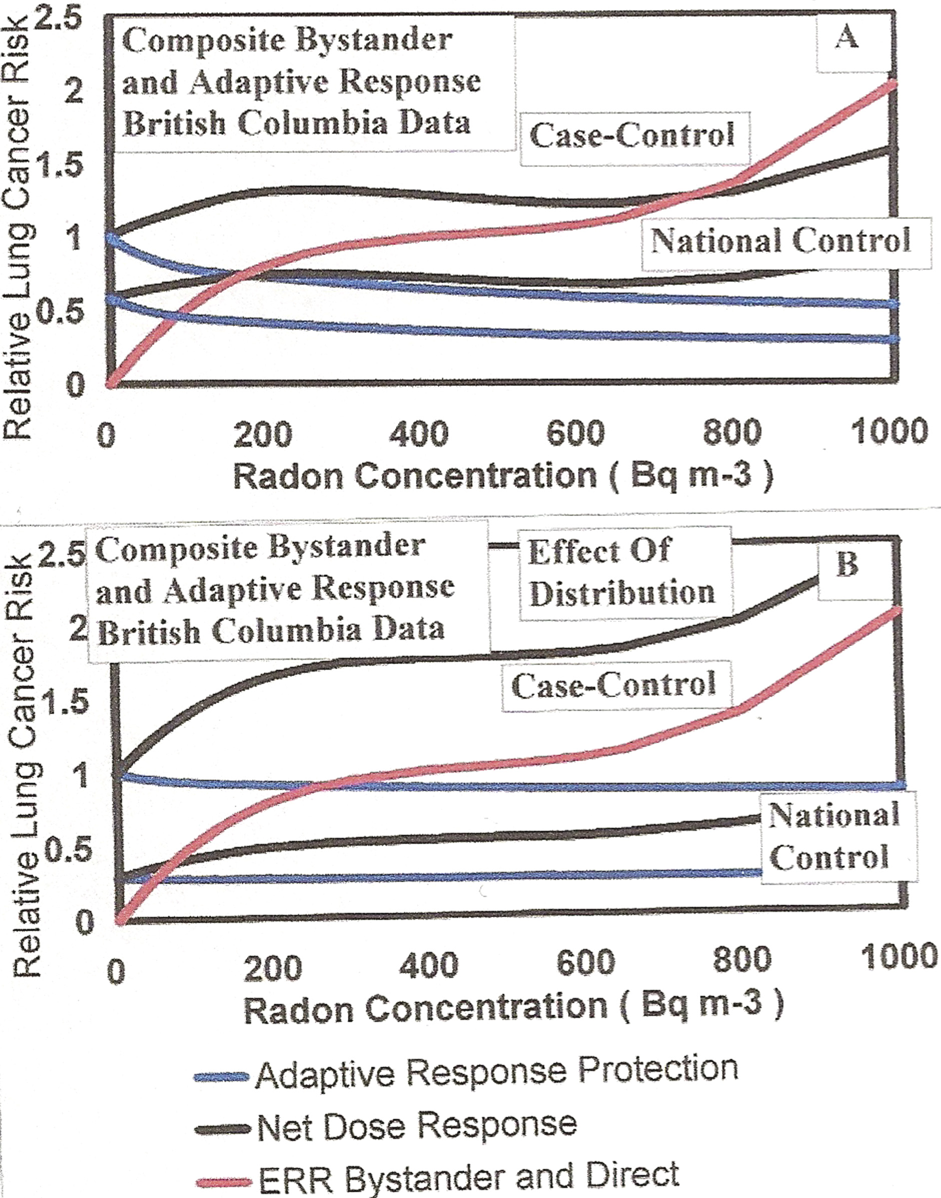
For the British Columbia data in Figure 16A, we show the effect of normalization to controls at zero radon concentration with, in Panel A, the upper Adaptive Response protection (in blue) and normalized case-control Net Dose Response (in black). Panel B is estimate of nomalized case-control with a distribution of background levels.
4.3 Examination of the Radon Relative Risks for the UNSCEAR (2000) Maximum and Minimum Variations in Human Low LET Radiations to Humans
Examining the EPA High-Radon Project data, the USGS Terrestrial Gamma Ray data, the California Gamma Ray data from EPA (2003), the residential data of Clouvas et al. (2001) and other data presented here in Sections 3.2.c and 3.2.d, we have shown that there is a very large variation in the human radiation exposures based on geographic location worldwide. For this reason, from the Table 1 UNSCEAR (2000) typical range of human radiation exposures by component, we have performed calculations for the low range values and the high range values of annual exposures. In the low range case we used – cosmic rays 0.30 mSv; Terrestrial gamma 0.30 mSv (U gamma 0.073 mSv; Th gamma 0.117 mSv; K-40 gamma 0.110 mSv); internal 0.20 mSv; and medical 0.02 mSv. Figure 17A provides the Radon Relative Risks for the UNSCEAR (2000) low range human exposure values. As Figure 17B, we show the maximum range calculations (High human low LET radiation exposures.). Here we used – cosmic rays 1.00 mSv; Terrestrial gamma 0.60 mSv (U gamma 0.146 mv; Th gamma 0.234 mSv; K-40 gamma 0.220 mSv); internal 0.80 mSv; and medical 1.20 mSv. These large variations support a large variation in human lung cancer risks for the case-control studies shown in Figures 2A and 2B of Part I (Leonard et al. 2009a), which are further studied in Part III (Leonard et al. 2009b). The normalized alpha particle representative dose response given in Figure 16 of Part I further support a non-linear BaD Model type dose response in the large variations in Figures 16 and 17. This will be shown to be true, in Part III (Leonard et al. 2009b), for the case-control studies. There is a difference relative to the expected dose response from case-control studies and what we have predicted in Figures 16 and 17 for combined bystander and adaptive response effects. Since case-control studies involve comparisons between lung cancer and non-lung cancer cohorts in the same geological and ecological settings they are normalized to unity at zero radon exposure and not worldwide or national “spontaneous” lung cancer rates (without radon exposure). We show this normalization of the Appendix A calculations to unity for case-control studies in Figure 18.
5. SUMMARY
In Part I of this three part study, alpha particle and other high LET broad-beam and micro-beam in vitro data (Miller et al. 1995, 1999, Zhou et al. 2003, 2004, Nagasawa and Little 1999, 2002, Hei et al. 1997, Sawant et al. 2001a, 2001b) were examined with the Brenner et al. (2001) microdosimetry, bystander BaD Model. This model has been used by others (Little and Wakeford 2001, Little 2004, Brenner and Sachs 2002, Brenner et at 2001) with the a priori assumption that at least some radon induced human lung cancers are caused by bystander damaged cells. It was found that for alpha particles with LETs near that of radon progeny alpha particles, that a standard representative alpha particle dose response shape with BaD Model parameters within ± 10% SD when scaled to microdose alpha particle cell traversals. This standard representative shape was then normalized to the BEIR VI (1999) Relative Risk at 400 Bq m-3 radon concentration to provide a best estimate of human lung cancer Relative Risk dose response. This best estimate is non-linear with the lung cancer incidence at low radon domestic levels from Bystander cellular damage and at high underground miner radon levels from direct alpha traversals.
This Part II here, of the three part study, has examined the potential influence of the adaptive response radio-protection on human lung cancer risks from radon. Radiation source of this protection is considered to be the natural background and man-made radiation to which humans are exposed on a day-to-day basis. The UNSCEAR (2000) world-wide estimate of human radiation exposures, Table I, is used for the radiation source components. Fundamental to the examination process is the knowledge that single low LET charged particle traversals activates the AR protective mechanism, it persists for at least one mitotic cell cycle, is relatively independent of the inducing low LET radiations and produces a reduction in both radiation induced and natural spontaneous chromosome damage by 50 to 80% (Leonard 2005, 2007a, 2007b, 2008a, 2008b, Leonard and Leonard 2008).
It is shown from a number of radiation surveys that there is a very wide range of natural background and man-made exposures from region-to-region and even in localized areas within regions. The Appendix A, Tables A1, A2 and A3 computes the Specific Energy Hits and adaptive response protection factors to the three carcinogenically sensitive lung cell species at the UNSCEAR (2000) world-wide average (40% AR reduction), with the estimated variation radon level and with the maximum (80% AR reduction) and minimum (20% AR reduction) range of human low LET exposures. Each Relative Risk curve (Figures 16, 17 and 18) show non-linear Bystander Damage dose response for residential and workplace human exposures and Direct Damage for underground miner exposures.