
Abstract
The involvement of [Ca2+]i in the reactive changes of astrocytes which accompany exposure to different chemicals were studied in cultures of C6 and 1321N1 cells. Cells were exposed to up to three serial pulses of the differentiating agent dBcAMP, which induces activation-type changes in the cells. Other cells, with or without the dBcAMP treatments, were treated with a range of concentrations of the antidepressants amitriptyline and fluoxetine and the glial toxicants acrylamide and chloroquine. In some experiments the L-type voltage calcium channel blocker Nifedipine was employed. [Ca2+]i was measured in populations of the cells using Fura-2AM and a charge coupled device (CCD) camera attached to a fluorescence microscope. dBcAMP induced both dose- and time-dependent changes in [Ca2+]i with increases in both the [Ca2+]i oscillations and mean [Ca2+]i (e.g. in C6 cells at 18 min mean [Ca2+]i was 318 ± 20nM following the single differentiating dBcAMP pulses, 489 ± 17nM (p < 0.001) following two serial pulses, and 275 ± 30nM (not significant) following three pulses). Therapeutic doses of fluoxetine and amitriptyline caused increases in the calcium oscillations and the mean calcium concentrations (maximum recorded mean increase was in the C6 cells at 10min by 0.02 μM fluoxetine when [Ca2+]i was 411 ± 35nM c.f. control 254 ± 25nM, p = 0.01). Higher (non-therapeutic) doses of both antidepressants caused significant reductions. Chloroquine and acrylamide also caused dose-dependent bi-phasic types of alterations in [Ca2+]i, with significant reductions at lower, sub-cytotoxic doses followed by significant increases at higher concentrations, approaching those which cause cell damage. Nifedipine treatment caused some reductions in the dBcAMP, antidepressant or toxicant-induced calcium changes, but this substance also initiated cytotoxic alterations. The findings show that both the activation-type changes (which are frequently associated with increased protective capacities) and toxic responses of C6 and 1321N1 cells to different chemical agents are associated with dose-dependent alterations in [Ca2+]i.
Keywords
INTRODUCTION
Astrocytes respond to most toxic chemicals with complex alterations in phenotype that are associated with changed expressions (often increases) in perhaps thousands of genes (reviewed by Eddleston and Mucke 1993). Several lines of evidence, from both in vivo and in vitro studies, show that the changes, termed astrocyte activation or reactive gliosis, are partly correlated with enhanced neuroprotection (reviewed by Pentreath and Slamon 2000). The reactive astrocyte phenotype involves increases in several systems which protect against oxidative damage, including the glutathione system, heme oxygenase and different forms of metallothionein and superoxide dismutase (Pentreath and Slamon 2000). Oxidative stress may regulate the antioxidant enzyme systems (Röhrdanz et al., 2001).
Our previous studies have evaluated the responses of cultured astroglial cells (primary astrocyte cultures, rodent C6 cells and human 1321NI cells) to a range of neurotoxicants and antidepressants. The responses were assessed by different biochemical and morphological markers, including glial fibrillary acidic protein (GFAP; Cookson and Pentreath 1994; Cookson et al., 1995; Slamon and Pentreath 1998; Pentreath and Slamon 2000; Pentreath and Mead 2004). A common feature for most toxic compounds when assessed by the different markers were biphasic responses, with increases (stimulation) at the low, subcytotoxic doses, followed by decreases at higher, cytotoxic doses (Pentreath and Slamon 2000). The early activation phase of the biphasic response embraces the increased protective capacity of the cells, before the damage phase with EC50 at the higher concentrations. The protection was conferred, in part, by antioxidant systems (e.g. the glutathione system: Cookson and Pentreath 1996; Cookson et al., 1998; Pentreath and Slamon 2000; Slamon and Pentreath 2000). The nonlinear pattern of response closely resembles that comprising the hormesis phenomenon which has been established to occur in a large number of biological systems when exposed to toxic insult (Calabrese and Baldwin 2001).
Key questions concern the nature of the mechanisms controlling the increases in protection evoked by different types of toxic chemical, which occur with astrocyte activation, and which are manifested with the early phase of the biphasic response. The time-course and patterns of increase in activity of the different components of the protective systems may vary for example with the type of astroglial cell, its culture environment and the toxic chemical (Pentreath and Slamon 2000). Thus the links between the toxic insult and protective capacity may be expected to involve multiple components and pathways.
An important role for cAMP in the signalling of astrocyte activation has already been shown. Increased levels of this substance induces alterations in astrocyte phenotype to the more differentiated, reactive state (see e.g. Sharma and Raj 1987; Hertz 1990). Numerous studies have been made on in vitro astrocyte cell model systems, with the changes associated with cAMP elevations including increases in GFAP, morphological alterations with hypertrophy of the branching processes and alterations (frequently upregulation) in a range of biochemical and closely linked physiological processes (see Eddleston and Mucke 1993; Pentreath and Slamon 2000). The changes are similar to those that occur during astrogliosis in vivo, where the levels of cAMP are also increased in the affected brain areas (Eddleston and Mucke 1993; Wilson 1997). The in vitro studies have frequently employed treatment of the cultured astrocytes with pulsed sequences of the membrane permeant cAMP analogue dBcAMP, which induces multiple activation-type changes including increased protective capacities (Mead and Pentreath 1998a; Pentreath and Slamon 2000).
Another ubiquitous cell messenger, Ca2+, has been extensively studied in the field of astrocyte biology. There is a very large literature concerning the nature of calcium oscillations within the astrocyte syncytium, their perturbations and the roles of excess calcium in pathological conditions (see Finkbeiner 1993; Jones et al., 2003). Experiments by Rzigalinski et al., (1997) have demonstrated that modest elevations (two- to threefold) of intracellular Ca2+ can protect cultured rat astrocytes against damage caused by physical injury. It has been suggested that the increased protection could be associated with enhanced membrane repair mechanisms (Ernst et al., 1994; Rzigalinski et al., 1997). Glial Ca2+ changes can also enhance transcription of the early response genes, c-fos and c-jun (Trejo and Brown 1991). However there appear to be no data available on possible direct roles of calcium in enhanced repair pathways which may correlate with astrocyte activation and the early phase of the biphasic response described above. Furthermore the understanding of how astrocyte Ca2+ signals may effect changes is made very difficult to elucidate because of the complex interrelationships between Ca2+ and other second messenger systems (second messenger cross-talk), including protein kinases, phospholipases, cyclic nucleotides and Ca2+-binding proteins, which can operate in complex synergies and feedback loops (see Finkbeiner 1993).
The purpose of the present work was to investigate the possible involvement of calcium in the biphasic responses of astrocytes. The study was made using rat C6 glioma and human (1321N1) astrocytoma cells. These cultured astrocyte systems have been extensively employed by us and others to study astrocyte properties using closely controlled conditions (see e.g. Slamon and Pentreath, 1998, 2000). The aims were to assess whether alterations in cell calcium levels were associated with the protective responses induced by cAMP manipulation or low doses of toxic compounds. For the latter we employed the neurotoxicants acrylamide and chloroquine, and the antidepressants fluoxetine and amitriptyline. Earlier studies have demonstrated that these substances can cause characteristic biphasic dose-responses to different toxicity indicators in the astroglial cultures (Mead and Pentreath 1998a; Slamon and Pentreath 1998, 2000). The effects of nifedipine on the alterations in Ca2+ were determined to investigate the intracellular and/or extracellular contributions of the Ca2+ changes.
MATERIALS AND METHODS
Cell Lines and Culture
C6 rat glioma and human 1321NI astrocytoma cell lines were obtained from the European Collection of Cell Cultures, Porton Down, Salisbury, U.K. The cells were certified negative for Mycoplasma.
The cells were subcultured as described previously (Slamon and Pentreath 1998). In brief, the cells were washed three times (each 2 min) in Hank's Balanced Salt solution (HBSS Gibco; calcium and magnesium free). The cells were detached by trypsinisation (1ml per flask of trypsin—EDTA) for 5 min at 37° C. When cells detached, 9ml growth medium (Dulbecco's Modified Eagles Medium, DMEM, supplemented with 10% v/v heat inactivated Foetal Bovine Serum, FBS, and 50mg/ml gentamycin sulphate; all purchased from Gibco) was added to prevent further action of the trypsin—EDTA. Cells were counted using a haemocytometer and diluted in growth medium to give a seeding density of 1–5 × 10⁵ cells/ml. Cells were grown (500ml/well) in 24 well plates (Nunclon) or 96 well plates (Greiner). In some experiments cells were grown on sterile cover slips coated with poly-L-lysine (Sigma) placed in the wells. The cells were grown until confluent.
Manipulation of cAMP
C6 and 1321NI cells were sometimes treated with N6,2′-0 dibutyryladenosine 3′:5′ cyclic monophosphate (dBcAMP; Sigma). There were two reasons for this. First, in some cases the treatment was used to induce differentiation of the astrocytes (Hertz 1990). Such treatment has particularly marked effects on C6 cells, inducing for example, more extensive ion channel formation so that the cells resemble quite closely freshly isolated astrocytes from CNS tissue (Hertz 1990). The 1321NI cells by comparison respond with more fully differentiated responses without this treatment (Mead and Pentreath 1998a,b) and this procedure was employed less frequently for these cells. For these experiments dBcAMP was added to the wells 24 hr after initial plating (final concentration 0.5mM) and 48hr prior to any further treatments with test substances or calcium measurements. Second the use of further serial treatments of dBcAMP induces further alterations in the glial cells (e.g. hypertrophy with increased GFAP) so that cells resemble reactive astrocytes. The procedure has been described previously (Mead and Pentreath 1998a). Briefly, the cells were treated with 0.5mM dBcAMP on the day after seeding for 48 hr then serial ‘pulses’ of dBcAMP (each 2.04mM in media for 48 hr) to a maximum of three treatments. The activation type responses and increased protection against toxicity caused by the treatments reaches a maximum after 2–3 pulses (Mead and Pentreath 1998a). The additions of further test substances and/or calcium measurements were made following each 48 hr period of dBcAMP application. Experiments were also made on cells not treated with dBcAMP.
Treatment of Cells with Test Substances
All compounds were dissolved fresh in astrocyte growth medium prior to addition to cells unless otherwise stated and were used in compliance with the manufacturers' statement of stability and shelf life. All compounds were shielded from light after addition to astrocytes, with all incubations carried out in the dark, prior to measurement of calcium concentrations. Cells were exposed to the antidepressants amitriptyline hydrochloride and fluoxetine hydrochloride (Prozac®), and the toxicants acrylamide and chloroquine (each purchased from Sigma). Each substance was tested over a range of concentrations (from 2mM–10mM) that according to our previous reports (Mead and Pentreath 1998a; Slamon and Pentreath 2000) included threshold, activation and EC50 concentrations for each substance. Substances were added following the periods of dBcAMP application for additional times of up to 7 hr, during which the intracellular calcium levels were monitored (see the following section).
Measurement of [Ca2+]i in the Astrocyte Cultures
Intracellular calcium was determined using the ratioable fluorescent probe Fura-2AM and a digital fluorescence imaging system.
Calibration Measurements
The system was calibrated to produce a standard curve of known calcium concentrations using the ratioable probe Fura-2 AME. Calibration measurements at zero and saturating levels of Ca2+ involved the determination of the constants Rmin and Rmax (maximum and minimum Ca2+ binding) using conditions identical to those employed for measurements of [Ca2+]i.
Standards were pipetted (30 μl/well) in duplicate into a 96 well plate. Images were taken at 338 nm and 366 nm (with a 10 second exposure time), and ratios were calculated from these values for each standard. Background images (Fura-free) were also taken in identical circumstances and measurements were deducted from the measurements obtained with the standards. From this a calibration curve was drawn and the constant K was derived from the gradient of the line.
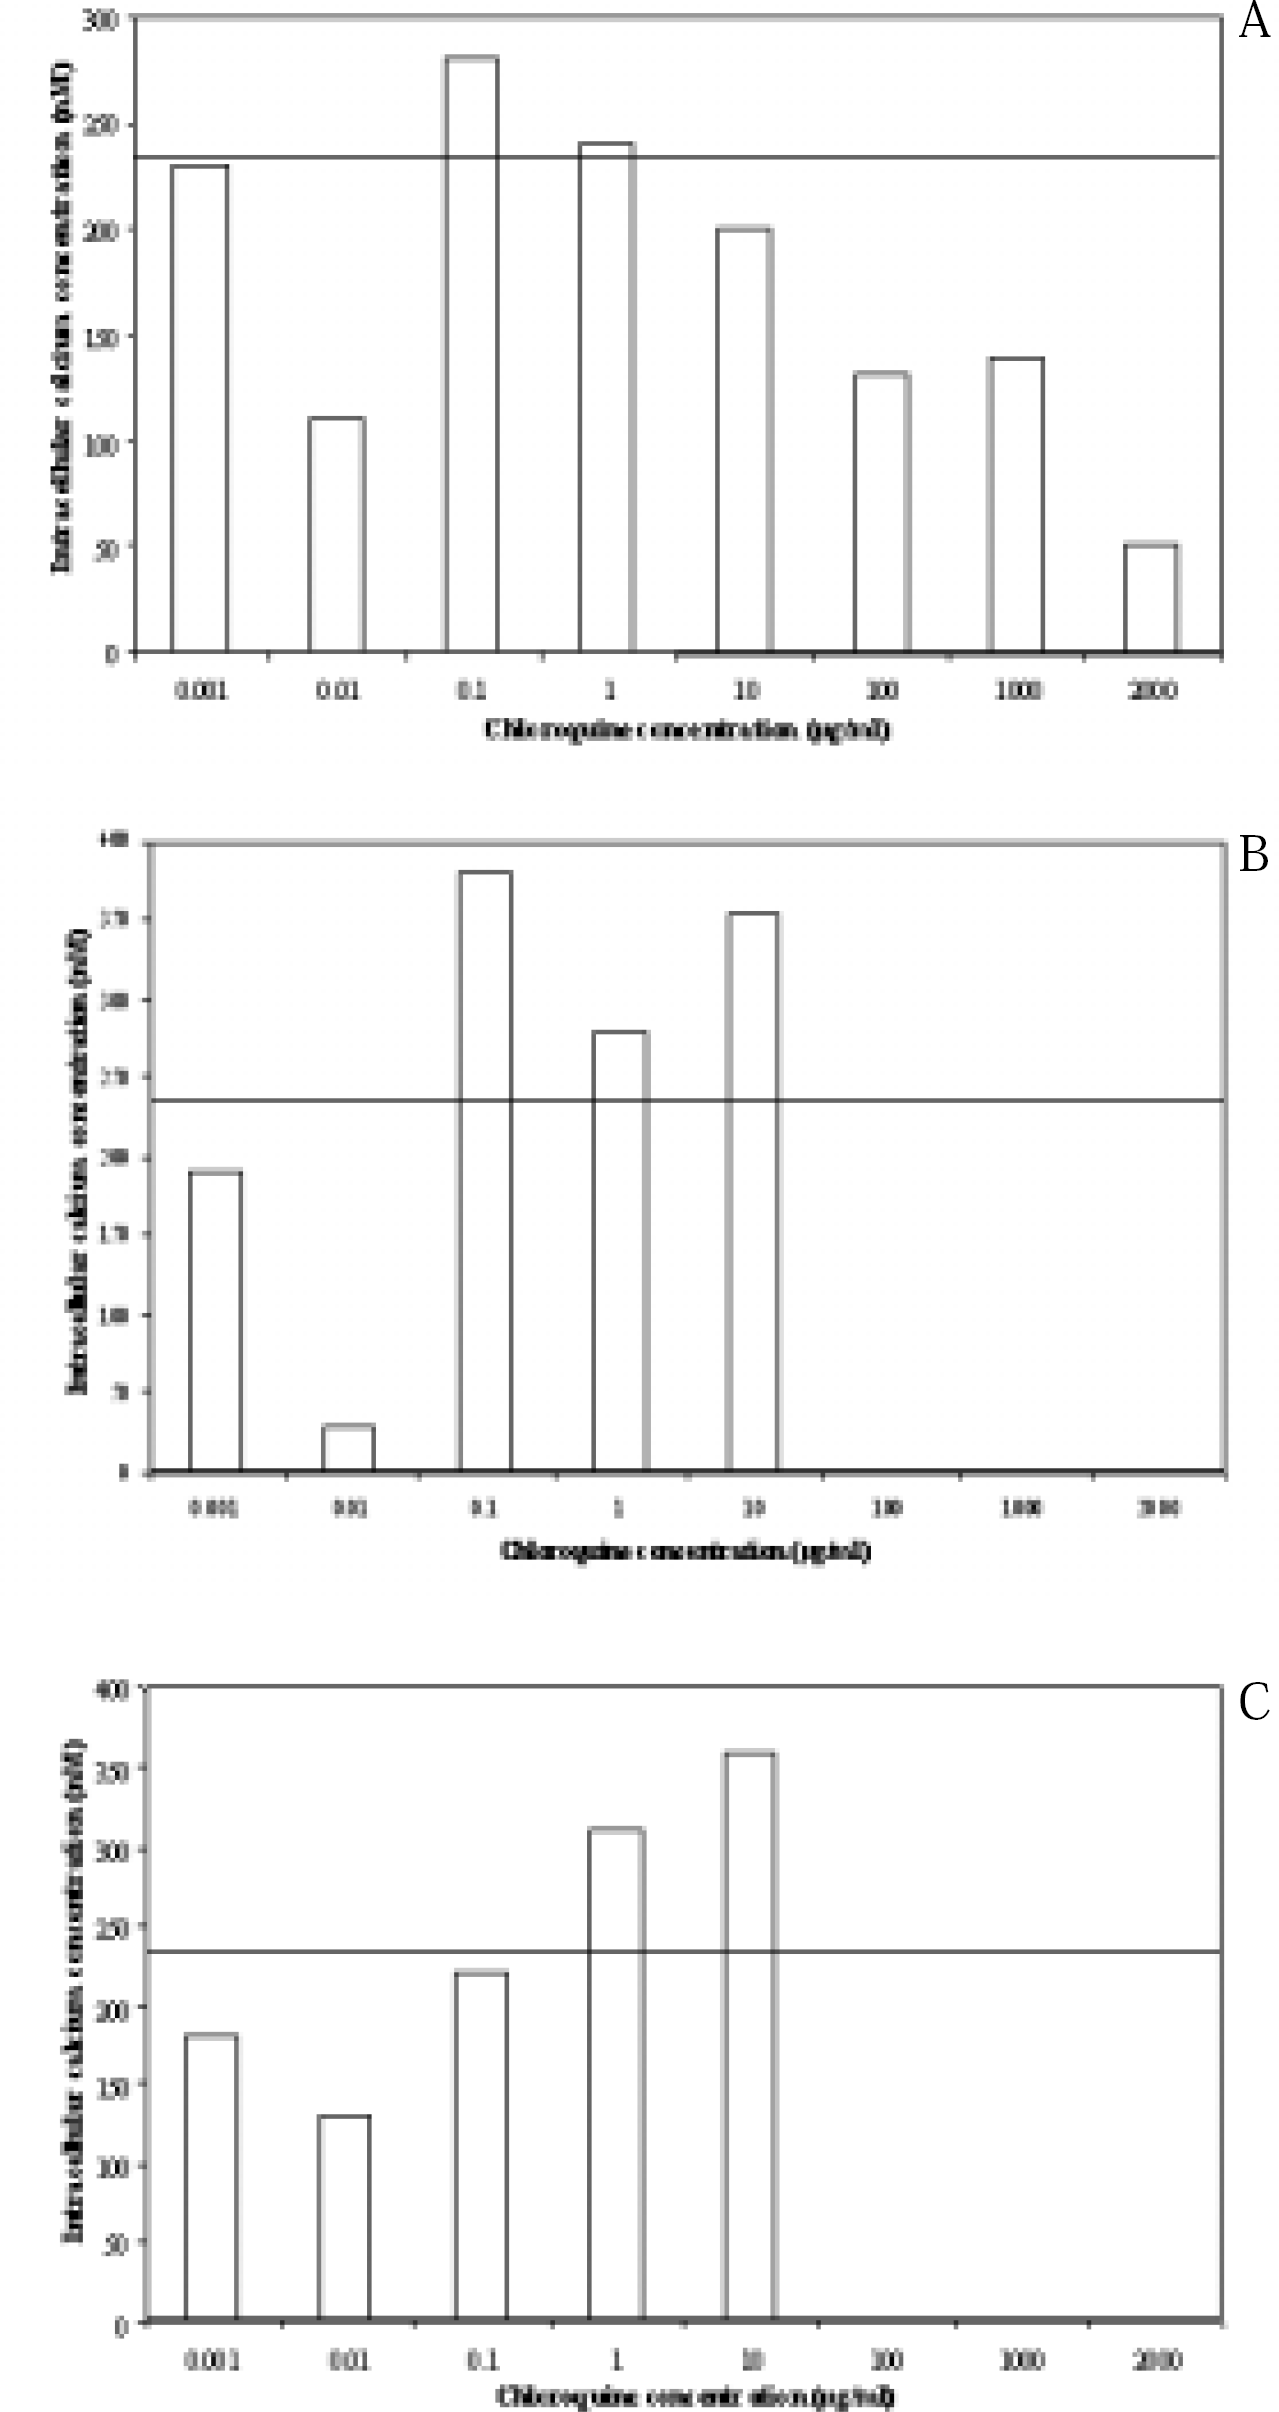
The calcium image was calculated from the ratio image by means of Rmin and Rmax images and the value of the constant K from the calibration, according to the following equation:
From this equation [Ca 2+]i is the concentration of intracellular calcium (in nM) (the ratio of fluorescence at the two wavelengths 338 nm and 366 nm was directly related to calculate [Ca2+]i.).
The constant K (calibration parameter) was obtained from the ratio of fluorescence values measured at the zero- and saturated [Ca2+]; R is the ratio of the fluorescence signal obtained at the wavelength where the Ca2+-bound dye predominates divided by the fluorescence signal at the wavelength where the Ca2+-free form predominates (i.e., the emission intensity ratio for Ex = 338 nm/Ex = 366 nm at any given [Ca 2+]i); Rmin is the fluorescence ratio value at zero free calcium and is determined from the ratio of fluorescence at the two wavelengths in the presence of excess EGTA; and Rmax is the fluorescence ratio at saturated calcium levels and is calculated from the fluorescence ratio at saturating Ca2+. The absolute values of these parameters are independent of dye concentration since they are measured as ratios. By using the ratio of fluorescence intensities produced by excitation at two wavelengths, factors such as uneven dye distribution and photobleaching are cancelled out since they both affect measurements to the same extent.
Loading of cells with Fura-2. Fura-2AM was purchased from Molecular Probes (Oregon, USA) in vials containing DMSO. Stock solutions (100μM) were prepared by dissolving in dimethyl sulphoxide (due to the poor water solubility of Fura-2AM). Working solutions (5μM) of Fura-2AM were prepared as required in calcium loading buffer (120mM NaC1, 20mM HEPES, 4.7 mM KC1, 1.2mM KH2PO4 1.2mMMgSO4, 1.25mM CaC12, 10mM glucose, pH 7.4). Standards were obtained from the Fura-2 Calcium Imaging Calibration Kit (Molecular Probes, Oregon, USA), using the free acid form of Fura-2. The kit consisted of a range of concentrations of CaEGTA, zero free Ca2+, 0.017, 0.038, 0.065, 0.1, 0.15, 0.225, 0.351, 0.602, 1.35, 39.8 μM Ca2+, a control (Fura-free sample), and 50μM of Fura-2. After treatment with dBcAMP and/or antidepressants or toxicants, the cells were washed twice with PBS (100μl/well) to remove the residual medium. Cells were then loaded with 60μl/well Fura-2AME (5μM) at room temperature with gentle shaking in the dark (to prevent photobleaching) for 1hr. Cells were then washed twice with loading buffer (100μl/well), and 100 μl/well of loading buffer was added to prevent dehydration. Cells were then analysed for alterations in intracellular calcium using the methods described next.
Calcium measurement. Measurements of [Ca2+]i were determined over the population of cells. A ‘Cermax’ Xenon lamp was used as the excitation light source using the ratioable probe Fura-2AM. The appropriate excitation wavelengths for calcium ratio imaging were selected using a linear variable interference filter with wavelength range 320–420 nm. The position of this filter was adjusted using a computer controlled 4-phase stepper motor. Fura-2 fluorescence in the cells was then reflected back through the mirror assembly and reflected through the microscope optics to the eyepiece or to a cooled CCD (charge coupled device) camera. Images were captured, and processed prior to analysis using ‘Image X’ version 2. After appropriate background subtraction, the 16-bit ratio images were converted to calcium images using a standard curve of calcium. Background fluorescence was removed by capturing images at each desired wavelength, without cells, in conditions identical to the experiment; this fluorescence was subtracted pixel-by-pixel from each of the cell images before further processing.
Alterations in intracellular calcium were determined over a population of cells in the culture layer. After subtraction of background, the [Ca2+]i in the cell population was determined from the ratios of fluorescence intensity as described above. Measurements were taken at intervals of 30 sec, 60 sec or 30 min from separate areas of the image. The areas chosen were random and great care was taken not to measure the same area more than once. This was repeated until a total of ten separate areas were measured at each time point. The calcium concentrations for each treatment were manually recorded, mean values were calculated and any alterations were subject to statistical analysis as described below.
Contribution of Calcium Pools to the Calcium Changes and Time-course of Measurements
To determine the calcium concentration in the cells after each application of dBcAMP and also to determine whether extracellular calcium was important in any rise in intracellular calcium, the calcium levels after each treatment of dBcAMP were measured over different periods of time. The first experimental series measured the effects over minutes and the second series over hours. In each case the last treatment of dBcAMP was applied in buffer, which either contained calcium or did not contain calcium. For some of the short measurement times the dBcAMP stock solutions was added to the cells which had been pre-loaded with Fura-2AM. For some of the longer measurement times (eg 30 or 60 min) the dBcAMP was added together with the Fura-2AM, with recording of calcium levels commencing 1 hr later.
The controls for the cells in the 1×dBcAMP treatment experiments were an average of two sets of ten measurements from two separate sets of cells with no dBcAMP added which had been plated out the previous day. The control for cells (2×dBcAMP) were an average of two sets of measurements of cells (1×dBcAMP) which had been treated with the single dBcAMP pulse 48 hr earlier. The cells were loaded with Fura-2 AM either with or without calcium in the loading buffer and the intracellular calcium levels measured. The control for cells (3×dBcAMP) were also an average of two measurements of cells (1×dBcAMP) which had been treated with dBcAMP 96 hr earlier. The reason for this was that except for the 1×dBcAMP measurements which used 0×dBcAMP as a control, the 2×dBcAMP and the 3×dBcAMP treated cells used 1×dBcAMP as the control in our previous experiments (Pentreath and Mead 1998). The controls for cells in calcium-free buffer were cells incubated in loading buffer which did not contain calcium over the same period of time that the Fura-2AM was being loaded.
In a number of experiments we employed the L-type voltage calcium channel blocker nifedipine (Sigma). A range of concentrations (50nm, 100nm, 1μm, 50μm, 100μm and 500μm) were tested for effectiveness and toxicity. Nifedipine was added together with the different concentrations of antidepressant or toxic substance, 48hr after the different dBcAMP treatments, before the Ca2+ measurements. The calcium changes in cells treated with nifedipine alone or the other test substances were compared with those where both were added to determine for any cross-reactivity of the different compounds which may have altered calcium levels.
Statistics
Data was analysed by comparing independent mean values for control (untreated) against mean antidepressant (treated) values from a population of cells. The results for the different experimental treatments and controls were analysed by Student t-test. All results were obtained from at least two experiments, each comprising at least 10 separate measurements from different culture fields for each parameter tested (i.e. n = 20, minimum value) with standard error of the mean (+/- SEM) values quoted.
RESULTS
The mean [Ca2+]i levels in different cultures of C6 or 1321NI cells which had been plated 48hr previously but received no treatments with dBcAMP or other (non-culture) substances was 210–255nM. Occasional oscillations ranging from 100–400nm were superimposed on the resting levels.
Effects of dBcAMP on [Ca2+]i in C6 Cells
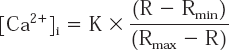
Because our previous studies on activation with the C6 cell line had been made on cultures initially differentiated with dBcAMP, we made these the control cells for most of our experiments. C6 cells treated with 0.5mM dBcAMP, with calcium present in the medium, maintained higher mean resting calcium levels than untreated cells (318 ± 20 nM). The [Ca2+]i also underwent continuous, irregular oscillations (range 150–750 nM Ca2+), with periodicities of 50–250 sec (fig 1a). Because the changes in [Ca2+]i involved both relatively short-interval (min) oscillations, superimposed on longer (hr) basal alterations, for practical purposes we made two types of measurements.
Concentration-response curves to show alterations in intracellular calcium concentration in C6 cells when treated with 1 × dBcAMP (□), 2 × dBcAMP (○) and 3 × dBcAMP (⋄) in loading buffer (a) containing calcium (b) which does not contain calcium, over a period of minutes; (c) in loading buffer containing calcium, and (d) which does not contain calcium, over a period of hours.
First, [Ca2+]i values were recorded at intervals of 30 or 60 sec for 18 min. In these situations serial dBcAMP pulses caused some significant increases in [Ca2+]i which were highest for the second treatment with dBcAMP when calcium was present in the culture medium (Table 1, Fig. 1a). In calcium-free media the [Ca2+]i levels were lower than in the calcium-containing media (Table 1, fig 1b).
Mean [Ca2+]i concentrations (nM) in C6 cells following dBcAMP treatment

[Ca2+]i values are the means ± SEM of the total of 2 sets of 10 measurements from two different experiments, each set taken at 30 or 60 sec intervals over a period of 18 min, or 30 min intervals over a period of 6 hr. The significance following the treatment of the cells with two (2×) or three (3×) pulses of dBcAMP with respect to the single (1×) differentiating pulse were determined by the student's t test. This is denoted by
p < 0.001;
p < 0.005;
p < 0.05. NS= not significant (i.e. p > 0.05).
Second, calcium measurements were made at 30 min intervals for up to 6hr (Table 1, figs 1c, 1d). The [Ca2+]i levels again underwent oscillations following the serial dBcAMP pulses (in both calcium-free and calcium containing buffer), but here the oscillations appeared to have longer periodicities because the measurements were made at intervals which would not resolve the short (min) oscillations described above. The mean basal levels were again increased by the multiple dBcAMP pulses, with the exception of the 3 × dBcAMP in calcium-free medium (fig 1d), where both the oscillations and basal levels were reduced to below control (i.e. 1 × dBcAMP) and non-dBcAMP treated cells.
Therefore dBcAMP can induce significant increases in both the oscillatory and basal [Ca2+]i levels in C6 cells, especially after 2 pulse treatments. The largest alterations occur with calcium present in the medium, but increases also occur in calcium-free medium; thus both external and internal stores appear to be involved in the changes.
Effects of Nifedipine on [Ca2+]i in C6 and 1321NI Cells
Different concentrations of nifedipine were added with the dBcAMP treatments and [Ca2+]i measured at 30 min intervals for 3hr. At concentrations of 100nM, or greater, there were progressive reductions in the mean (basal) levels of calcium, but no apparent perturbation of oscillations. The reductions were maximal at 1–50μM nifedipine when the highest [Ca2+]i level observed was 400nM. However signs of damage to the cells (alteration in shape with progressive detachment) were associated with the calcium changes. At concentrations of nifedipine exceeding 100nM the cytotoxic damage extended to cell death. Thus the apparent toxicity of this substance indicated limited value in this system. Some other studies with nifedipine in relation to other substances are described below.
Effects of Fluoxetine and Amitriptyline on [Ca2+]i
Our previous studies have demonstrated a number of metabolic and activation-type responses, as well as toxic changes (at higher concentrations), caused by several antidepressants in C6 and 1321NI cells (Slamon and Pentreath 1998, 2000). We determined alterations in [Ca2+]i over 15 min (5 min intervals) and up to 4.5 hr (30 min intervals) in the C6 cells (which also received a single, differentiating, dBcAMP treatment), and over 60–120 min (30 min intervals) in the 1321NI cells (not treated with dBcAMP) using concentrations of the antidepressants employed in the previous studies.
Both fluoxetine and amitriptyline caused increases in the calcium oscillations and the mean calcium values over the different time periods (Table 2, Fig. 2). The greatest increases were recorded with the C6 cells after 10 min with 0.02μM fluoxetine (mean [Ca2+]i = 411 ± 35nM; cf. control = 254 + 25nM, p = 0.01), but other more modest increases (10–20%) occurred at several other time points (Table 2, Fig 2). At the higher (non-therapeutic) doses and longer time periods with fluoxetine exposure there were significant reductions in [Ca2+]i (Table 2).
Mean [Ca2+]i concentrations in C6 and 1321N1 cells following antidepressant treatment.

[Ca2+]i values are the means ± SEM of the total of 2 sets of ten measurements from two different experiments. Over the 5–15 min period measurements were taken at 5 min intervals (i.e. at 5, 10, 15 min), over the 60–120 and 150–270 min periods at 30 min intervals (i.e. at times 60, 90, 120 and 150, 180, 210, 240, 270 min). C6 cells had been exposed with a single differentiating treatment with dBcAMP, the 1321NI had received no dBcAMP treatment. The concentrations of the different antidepressants were those employed in our previous studies with antidepressant effects on these cells (Slamon and Pentreath, 1998, 2000). The significance of each value with respect to the control value in each set was determined by student's t test. This is denoted by
p < 0.01;
p < 0.05. NS = not significant (i.e. p > 0.05).

Alterations in intracellular calcium in C6 cells containing dBcAMP after acute fluoxetine exposure.
Nifedipine (50μM) caused modest reductions (10–20%, NS) in the antidepressant-induced [Ca2+]i increases, which were most consistently observed in the amitriptyline-treated 1321NI cells. An exception occurred when C6 cells were exposed to 0.3nM amitriptyline for relatively long time periods (greater than 1.5 hr) when significant elevations occurred (i.e. mean [Ca2+]i 550 ± 16nM; cf. 328 ± 24 nM for amitriptyline-treated without nifedipine).
Effects of Chloroquine and Acrylamide on [Ca2+]i in C6 Cells
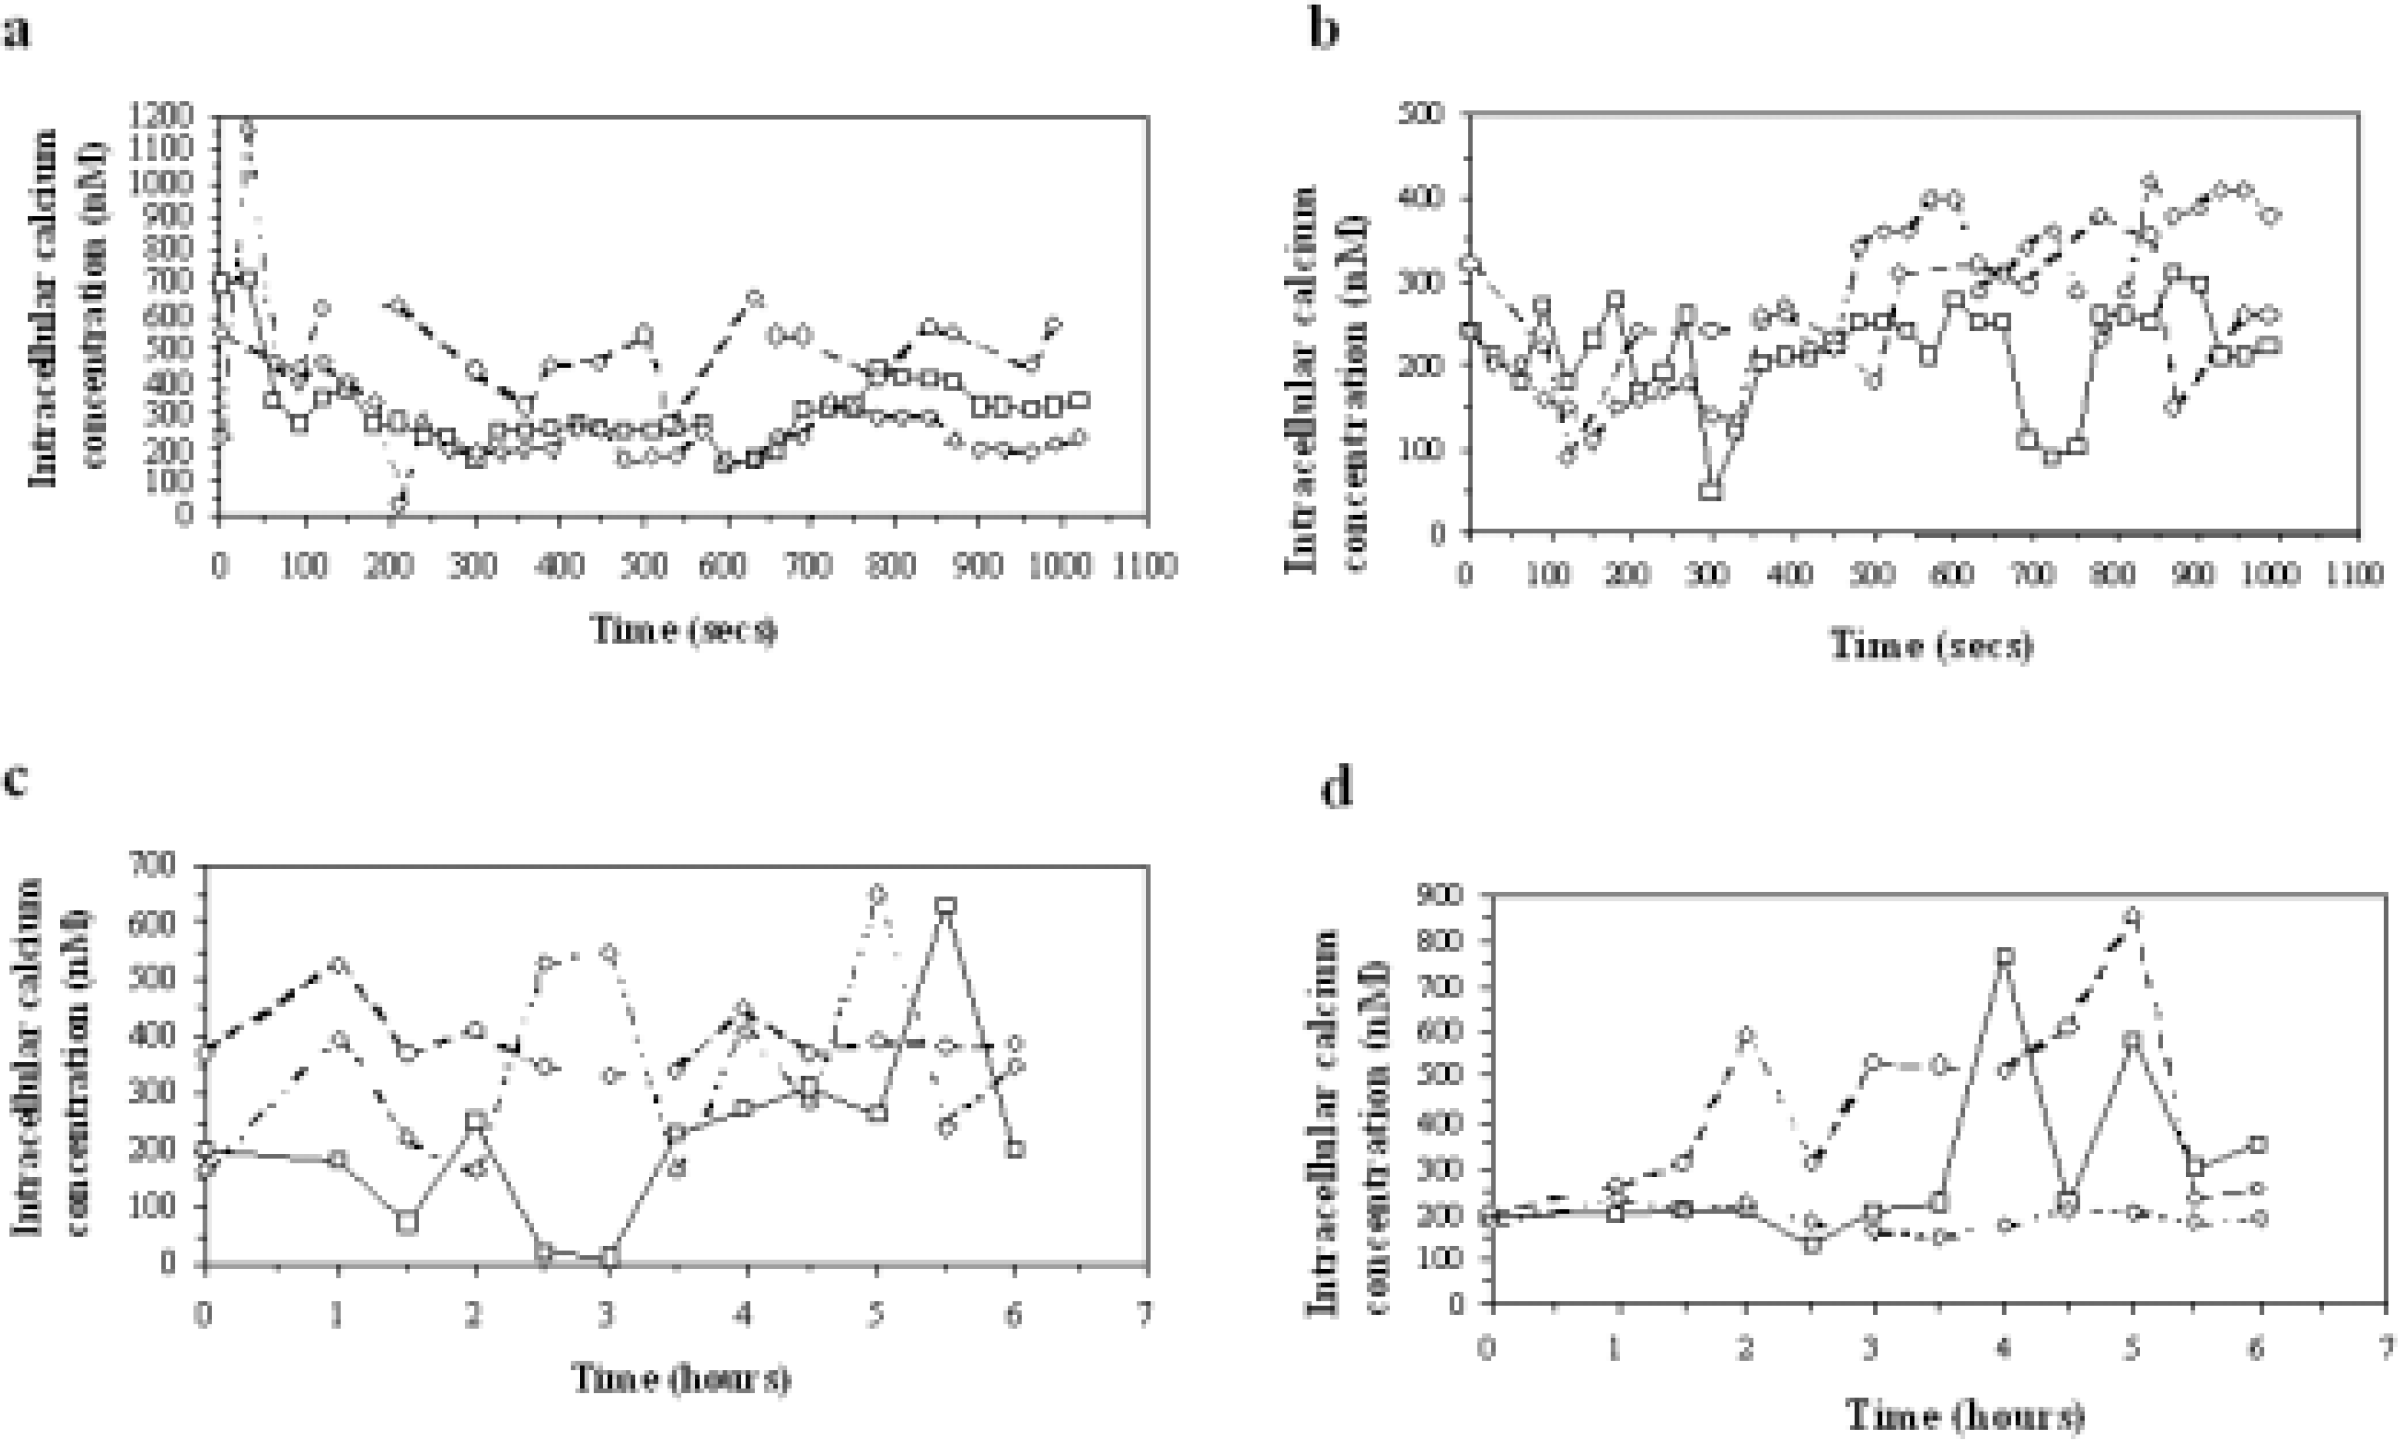
The effects of two glial cell toxicants chloroquine and acrylamide were studied on C6 cells pre-treated with 1–3 dBcAMP pulses. With both substances two dose-dependent patterns of alterations of [Ca2+]i were recorded with the pattern similar at each measurement time-point (30 min intervals from 0.5–7.0 hr exposure). First the lower sub-cytotoxic concentrations caused some marked reductions in [Ca2+]i. Second, the higher concentrations, approaching those previously shown by us to cause cell damage (i.e. 10–100 times lower than EC50 values; approx 60 μg/ml for chloroquine, 400 μg/ml for acrylamide) at these times of exposure, caused some marked increases in [Ca2+]i (maximum 375nM for chloroquine, 385 nM for acrylamide). Some data for chloroquine are shown in Fig. 3. The patterns were similar in cells treated with sequential pulses of dBcAMP, although the overall [Ca2+]i levels were higher in these cells. Nifedipine (60μM) caused some significant reductions in the overall [Ca2+]i changes (data not shown).
Alterations in calcium concentration (nm) inC6 cells after treatment for 1hr (a), 4.75 hr (b) and 7 hr (c). Each point is the mean of seven replicates. The solid line across each part of the figure is the control calcium value.
DISCUSSION
The associations of the [Ca2+]i increases in glial cells with a range of pathological states, including toxic damage have been extensively described (Finkbeiner 1993; Nicotera et al., 1992). According to the ‘calcium hypothesis’, injury to the CNS can cause a massive and prolonged elevation in [Ca2+]i which via multiple pathways can result in neuronal and glial cell death. However the generality of this has been questioned in several reports, with the possibility that Ca2+ may play a dual role in CNS injury and modest intracellular Ca2+ influx be necessary for repair in the initial stages after injury (Rzigalinski et al., 1997). Our work was undertaken to examine the possible contribution of Ca2+ linking the exposure of cells to increased cAMP with the protection conferred against a number of toxicants (Mead and Pentreath 1998a; Slamon and Pentreath 2000). The findings show clearly that treatment of cells with dBcAMP is associated with significant [Ca2+]i increases both as oscillations and baseline levels, with a contribution from both internal and external sources.
The involvement of Ca2+ in the responses of C6 cells to 5-hydroxytryptamine (5-HT) and bradykinin have been studied by Cholewinski and Leslie (1996). Basal levels in single C6 cells were shown to be 190 ± 25nM, slightly lower than the value of 232 ± 23nM in untreated populations of C6 and 1321N1 cells found in the present study. It has also been reported that in resting C6 cells calcium waves do not normally occur (Manor et al., 1994; Cholewinski and Leslie 1996). However our measurements were made in cell populations using different methods from these studies. The 5-HT-induced oscillations were not blocked by nifedipine (Cholewinski and Leslie 1996) which had no effect on the dBcAMP-induced oscillations in the present work. The data suggest that the oscillations are sustained in the absence of any Ca2+ entry via voltage-dependant calcium channels, although our findings also indicate that nifedipine treatment induces damage, and conclusions from its effects may not, therefore, be reliable.
There is little information on the possible involvements of Ca2+ in astrocyte activation, the cross-talk with other messenger systems, or the increased protective (hormetic) capacities. Reactive astrocytes may undergo increases in volume and Ca2+ may have an important role in its control (Verkhratsky et al., 1998). Changes in Ca2+ homeostasis induced by dBcAMP could be responsible for the differences in volume regulation between non-dBcAMP-treated and dBcAMP-treated astrocytes (Bender et al., 1992). It has been suggested that [Ca2+]i regulates the glial cytoskeleton via phosphorylation and assembly or disassembly of GFAP (Yang et al., 1988; see Finkbeiner 1993). The work of MacVicar (1987) has shown the morphological changes following exposure of C6 cells to dBcAMP do not occur when calcium entry into the cells is blocked by cadmium or cobalt. It was suggested that Ca2+ entry could control the altered differentation state of the cells (MacVicar 1987). The altered Ca2+, induced by any external agent, will be very likely linked with other pathways via modulation of glial Ca2+ binding proteins, phospholipases, protein kinases and cyclic nucleotide levels. In turn there may be subsequent alterations in transcription, for example of the immediate early genes c-fos and c-jun in the 1321NI cell line (Trejo and Brown 1991). Again the complex interrelationships between Ca2+ and other signalling systems which could be linked with protective systems in astroglial cells are not yet understood (Eddleston and Mucke 1993; Finkbeiner 1993).
The antidepressants fluoxetine and amitriptyline, and the glial toxicants chloroquine and acrylamide have been previously studied by us in relation to the low dose activation responses and high dose toxic responses in cultured astrocytes (Mead and Pentreath 1998a; Slamon and Pentreath 1998, 2000). The present study shows that the substances induce [Ca2+]i alterations which are commonly bi-phasic, with some relatively large increases in [Ca2+]i at the higher doses and longer exposure times. In relation to this Chen and Hertz (1996) have suggested that Ca2+ homeostasis in astrocytes may be an important target for the chronic action of the antidepressant drugs, which could be related to the lag phase of the actions of these substances in a therapeutic setting. Fluoxetine interacts predominantly with 5-HT receptors, amitriptyline with adrenergic receptors; both receptor types occur in a range of astrocyte preparations where their activation by antidepressants may lead to altered [Ca2+]i via altered second messengers (Chen et al., 1995; Nalepa et al., 1997; Yamaji et al., 1997). The toxic mechanisms of acrylamide and chloroquine in astrocytes are not understood, although in other cell types they interfere with protein synthesis (acrylamide) and lysosomal enzymes (chloroquine). The reductions in [Ca2+]i with low doses of these substances was an unexpected finding, perhaps indicating Ca2+ sequestration, which requires further study. However, the elevations in [Ca2+]i at the higher, toxic doses, could be consistent with the cytotoxic damage which occurs at these concentrations (Cookson and Pentreath 1994).
Overall the data show that the increased protection against toxic chemicals conferred to cultured astroglial cells by dBcAMP treatment is associated with increases in [Ca2+]i. The elevations occur as enhanced oscillations superimposed on an increased basal level with the mean maximum increase not exceeding twofold. Antidepressants and toxic substances also cause Ca2+ increases, which were highest for the toxicants at doses approaching those which cause cytotoxicity, but again [Ca2+]i levels did not exceed twice the controls. We conclude that [Ca2+]i increases may be an important component of the cells capacities for repair, in addition to their possible roles in cell damage.
Footnotes
ACKNOWLEDGMENTS
This work was supported by financial support from the Health and Safety Executive, UK and Salford University Research Fund.