
Abstract
Thermal aging leads to a reduction in the tensile strength of fire protective fabrics, which increases the skin burn risks of the wearer. Standardized test methods are generally destructive. In this study, machine learning was applied to predict the tensile strength after heat exposure. Training data was obtained from published articles, and seven features that affect the tensile strength of the fabric were determined. The results indicated that the average R2 and RMSE of machine learning models was 0.83 and 135.40, respectively, which was better than the traditional statistical model (R2 = 0.45, RMSE = 238.41). Among all the models, GBR produced the best prediction result (R2 = 0.95, RMSE = 77.42). Five features (fiber, weight, testing direction, exposure time, and heat flux density) were sufficient to achieve a better prediction.
Introduction
Fire protective fabrics are widely used in the manufacture of fire service uniforms and high-temperature working uniforms. 1 NFPA 1971 provides various performance requirements for each layer of fire service clothing, such as the mechanical and thermal protective properties of the outer shell fabric, and the water vapor permeability of the moisture barrier layer. During the service life, the outer shell fabric will be directly and intermittently exposed to the fire, which requires excellent thermal protection and mechanical properties. Previous studies revealed that heat exposure had a significant effect on the tensile strength and tear strength of X-fiper fabrics, however, the variation of thermal protective performance was not significant. 2 In addition, the mechanical properties of the fabrics would fall below the standard before the thermal protective performance after various exposures. Generally, the deterioration of mechanical properties of the fabrics and clothing could not be accurately evaluated visually.3-5
Although standardized test methods can accurately assess the changes in mechanical properties of fire protective fabrics after thermal aging, the evaluations performed through aging simulation experiments are destructive and cannot cover all situations in practice. It is of great significance to predict the effects of thermal aging on mechanical strength of the in-use fabrics to predict the service life. Therefore, the regression models were established by investigating the variation in the tensile strength of fabrics used in firefighter protective clothing after heat exposure. Empirical equations were developed to predict the lifetime of firefighters’ protective clothing. 6 A linear equation between the tensile strength and the refection coefficient of the fabric was established by numerical methods and predicted the tensile strength of the fabric after thermal aging. 7
The above methods have inherent limitations when used to predict the tensile strength after aging of fabrics, which is affected by a variety of factors. Establishing the relationship between a single variable and tensile strength cannot fully represent the performance decrease. Besides, statistical regression models require specific input parameters, and the model does not allow addition operations on their respective input parameter sets. In other words, the model needs to be rebuilt for new situations.
Machine learning, which has been widely used in diverse areas, was adopted to predict the tensile strength of fire protective fabrics after thermal aging in this study. In the fields of environmental engineering and human science, an increasing number of studies had attempted to apply various machine learning algorithms, such as support vector machines,8,9 neural networks, 10 fuzzy rules, 11 logistic regression, 12 Gaussian Process, 13 and Bayesian networks,14,15 to predict individual thermal comfort or thermal sensation. The application of machine learning could improve data representation and prediction performance. 16 In the field of clothing science, machine learning was mainly used to predict fabric and clothing performance. Thermal protective performance and thermal physiological comfort of fabrics were predicted by an artificial neural network algorithm (ANN). 17 Research indicated that the ANN model could simulate the actual working conditions of firefight-ers and accurately predict the performance. The suitability of clothing was predicted by the Naive Bayes algorithm, 18 and the prediction accuracy of the machine learning model was significantly improved by 17%–40% compared with the traditional prediction model. In this study, training data were obtained from previous studies. Six machine learning models were used and their applicability was explored to predict the tensile strength of the fabric after heat aging. The study will provide technical suggestions for the selection and maintenance of frefghters’ protective clothing.
Methodology
Experimental Database
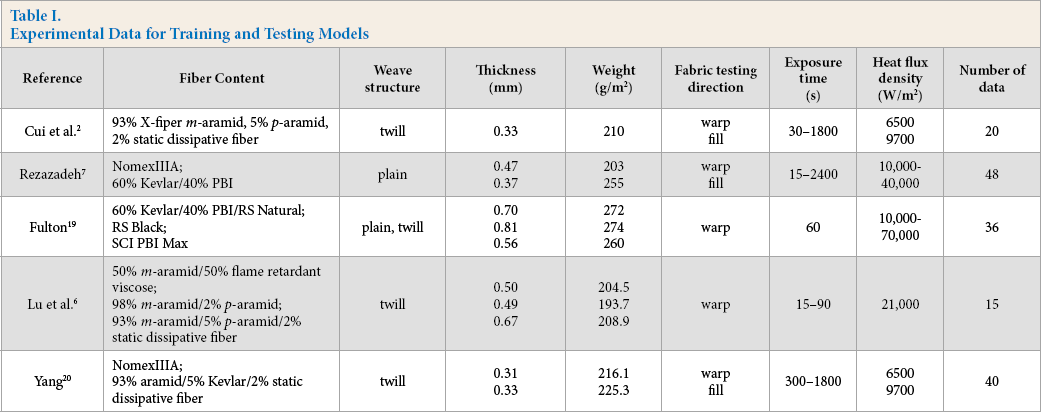
To cover a wide range of fiber content, fabric structure, heat exposure duration, and heat flux density, data from previous experimental studies were collected to train the model. A total of 159 datasets of typical fire protective fabrics were determined. It was noted that the study only considered the strength changes of fire protective fabrics under radiant heat exposure. The literature referred to for extracting the input/ output data used to train and test the machine learning models are shown in Table I.
Experimental Data for Training and Testing Models
Data Preparation and Modeling
The data were cleaned up before modeling and the missing values were replaced by the mean values. Then, the data were merged based on seven features, which are shown in Table II. The category feature was converted to dummy features encoded in a series of zero and one by one-hot coding. All features were standardized to eliminate the effect of dimensions on the results. Too many and/or interdependent input variables might interfere with the model, thereby reducing the prediction accuracy of the model; therefore, the Random Forest Regressor (RFR) was used to calculate the influence degree of features on the result. To select the optimal input variable combination that could make the model achieve the best prediction performance, the features were divided into different groups.
Description of Features Used for Machine Learning Models
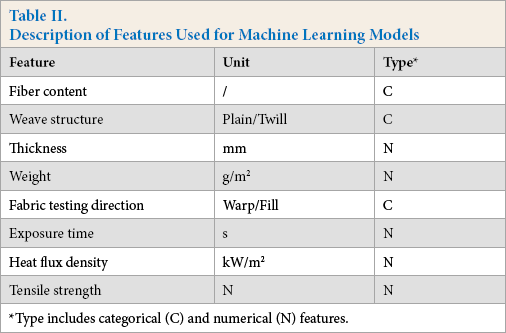
Type includes categorical (C) and numerical (N) features.
Tensile strength of the fire protective fabric after thermal aging was defined as the dependent variable, and other features (fiber content, weave structure, thickness, weight, fabric testing direction, exposure time, and heat flux density) were identified as independent variables. There are various machine learning algorithms, each of which has specific scope of application. For example, deep neural network has high dimensional and strong data requirements. 16 Considering the small data size of this study, six machine learning algorithms that do not require strong data assumptions were chosen: Gradient Boosting Regressor (GBR), Random Forest Regressor (RFR), Extra Trees Regressor (ETR), AdaBoost Regressor (ABR), Lasso Regression (Lasso) and Ridge Regression (Ridge). The above algorithms were implemented through Scikit-learn third-party modules (version 0.19.2). Scikit-learn is a machine learning library provided by Python, providing functions of data preprocessing and model training for classification, regression, and clustering.
The k-fold cross-validation method was used to evaluate the performance of the model on different subsets of data retained at the beginning of model training, thereby evaluating the performance of the developed model on new data. 21 Ten data subsets were used for 10-fold cross-validation (Fig. 1). Machine learning algorithms and cross-validated were run in Jupyter Notebook (version 5.6.0). The entire data set was divided into two parts: 85% of the data was cross-validated to train and verify the model, and the remaining 15% of the data was applied to test the obtained models. Multiple linear regression (MLR) modeling in IBM SPSS Statistics (version 22) was used as the traditional statistical method, which served as a control group.
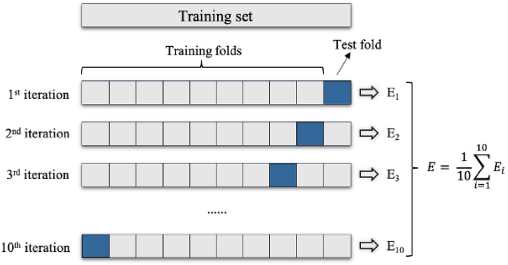
Ten-fold cross-validation schematic diagram.
Performance Evaluation Method
Coefficient of determination R-square (R2) and root mean square error (RMSE) were used as evaluation indicators to evaluate the model performance. R2 characterizes how well the model fits through changes in data, and ranges from 0 to 1. The closer the value is to 1, the stronger that variable has the ability to interpret. 22 RMSE has been widely used to evaluate the performance of prediction models by quantifying the prediction error. 23 A greater RMSE indicates a greater error. Eqs. 1 and 2 represent the mathematical calculation of R2 and RMSE, respectively.
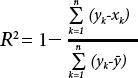
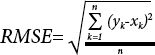
Where yk is the experimental value, xk the predicted value, n is the total number of the experimental values, and
Results and Discussion
Feature Importance
The relative importance of seven features in predicting the tensile strength of fire protective fabrics after thermal aging is presented in Fig. 2. Heat flux density is the most influen-tial factor, followed by exposure time, weight, fiber content, fabric testing direction, thickness, and weave structure.
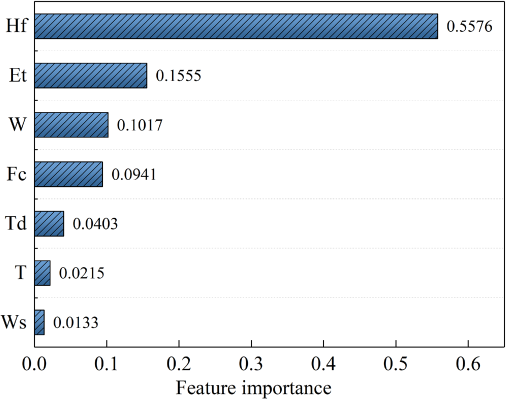
Relative importance of the features used to develop models. Hf-Heat flux density, Et-Exposure time, W-Weight, Fc-Fiber content, Td-Test direction, T-Thickness, and Ws-Weave structure.
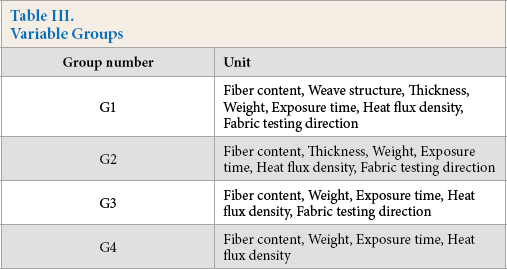
According to the relative importance of features, they were divided into four groups, as shown in Table III. In the following discussion, the four groups were modeled and analyzed using machine learning and MLR models to select the optimal combination of input features.
Variable Groups
Model Prediction Accuracy
The R2 and RMSE of the six machine learning algorithms and the traditional statistical method used to develop the tensile strength prediction model are presented in Fig. 3. Seven features (G1) were used for input parameters. The data were the output results after cross-validation processing.
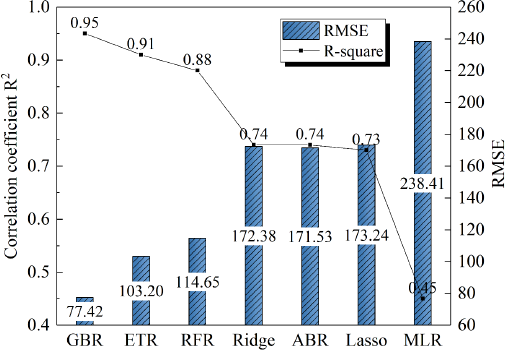
Prediction accuracy of all models.
Among all machine learning algorithms, the best performing model was GBR (R2 = 0.95, RMSE = 77.42), followed by ETR (R2 = 0.91, RMSE = 103.2) and RFR (R2 = 0.88, RMSE = 114.65). The remaining three models with relatively worse prediction accuracy were ABR, Lasso, and Ridge. The differ-ence between these three models was very small (the error difference among them did not exceed 1%). The prediction accuracy of all machine learning models was higher than the MLR model (R2 = 0.45, RMSE = 238.41). The R2 predicted by the machine learning algorithm was between 0.73 and 0.95, and the average R2 was 0.83, which was higher than the traditional statistical model of 0.45. The RMSE predicted by the machine learning algorithm was between 77.42 and 173.24, and the average RMSE was 135.40, which was lower than the traditional statistical model of 238.41.
Fig. 4 shows a comparison between the actual data (15% test data set) and the predicted value. If the predicted value of the model is exactly the same as the actual value, the predicted and actual value of the tensile strength will lie on the diagonal, which is presented by a solid line in the figure.
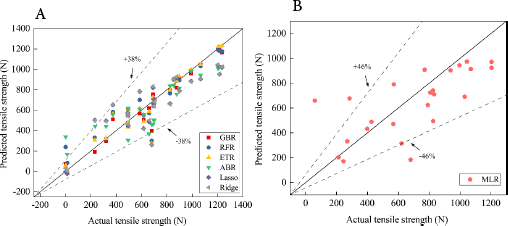
Comparison of predicted data with experimental data for tensile strength. (a) Machine Leaning model; (b) MLR model.
The prediction of the machine learning model is closer to the experimental data. Except for some values with large errors, the predicted value of the machine learning model is within ±38%. This is the predicted value of all machine learning models. For GBR, with the best prediction accuracy, the predicted value is within ±10%. Compared with machine learning models, the prediction results generated by MLR have larger discrepancy from the experimental results, and the predicted value is within ±46%. Therefore, the machine learning method has less error than the traditional statistical modeling method for predicting the tensile strength of the fire protective fabric after thermal aging.
Variable Groups Effects on Model Performance
To further explore the impact of the variable groups on model accuracy, Fig. 5 illustrates the R2 and RMSE of the four groups. With the reduction of feature numbers, the prediction accuracy of ETR, GBR, RFR, and ABR gradually decreases. The prediction accuracy of the above three models drops significantly for G4. As for ETR and GBR, the performance difference between G1, G2, and G3 is not large (within 1%). Although the ABR model showed worse prediction results for G3, overall, the difference of the prediction accuracy for the four variable groups was not significant (within 5%). Therefore, using G3 as the independent variables to develop the models is sufficient to obtain a satisfactory accuracy.
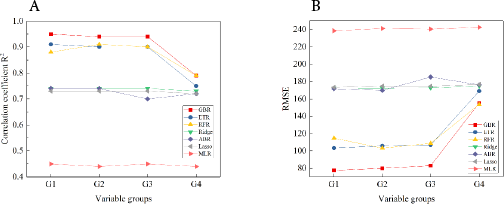
The prediction accuracy of model runs with different variable groups. (a) Correlation coefficient R2; (b) RMSE.
Regarding the regular linear models of Lasso and Ridge, the prediction accuracy shows little difference for these four variable groups. The possible explanation is that Lasso and Ridge are both regular linear model, which is particularly sensitive to the size of the input features. Lasso also automatically performs feature selection and outputs a sparse model, which tends to eliminate completely the weights of the least important features (that is, they are set to zero). 24 Overall, six machine learning model used in this study performed better than MLR on all four variable groups.
Fig. 6 compares the effect of the number of features on the ability of GBR to predict tensile strength. It is apparent that the predicted values of the model developed by G1-G3 are close to the actual values (R2 is between 0.94 and 0.95, RSME is between 77.42 and 83.01). However, the prediction value of the model developed by G4 has a relatively large discrepancy (R2 = 0.79, RMSE = 155.13). For the best performance GBR model, using the G3 variable group also produced relatively better prediction results.
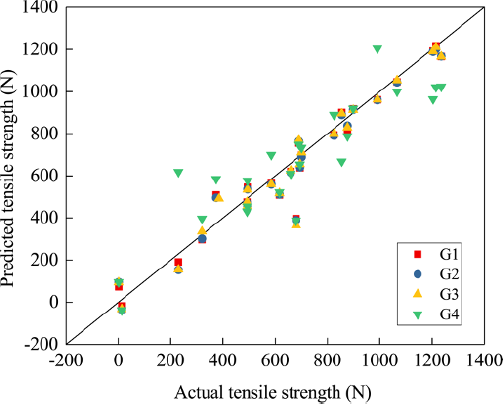
Comparison of predicted data with experimental data for tensile strength on different variable groups.
Understanding the variable contribution to the predictive power of the model can help eliminate invalid variables and reduce the cost of data collection. Six machine learning algorithms and MLR models were used to model and analyze the four groups of features. Ten-fold cross-validation was also used to train the model.
Conclusion
Six machine learning models were used to predict the tensile strength of fire protective fabrics after thermal aging in this study. Results indicated that the fiber content, weave structure, thickness, weight, fabric testing direction, exposure time, and heat flux density could be considered as the input variables. The average R2 and RMSE of the machine learning models was 0.83 and 135.40, respectively, which was higher than that of the traditional algorithm statistical model (R2 = 0.45, RMSE = 238.41), and GBR produced the best prediction results (R2 = 0.95, RMSE = 77.42). The analysis of the importance of the model's features indicated that five features (fiber content, weight, fabric testing direction, exposure time, and heat flux density) were sufficient to achieve a better performance, which would reduce the cost of collecting features. Regarding new fabric types outside the materials in this study, experimental data needs to be added to the model for training, which is a limitation of the current model. However, with the addition of new data, remodeling using machine learning is more convenient than the traditional statistical method. More types of flame-retardant fabrics will be considered to enrich the existing machine learning model and improve its generalization ability in further study.