
Abstract
Accurate object detection and classification has a broad application in industrial tasks, such as fabric defect and invoice detection. Previous state-of-the-art methods such as SSD and Faster-RCNN usually need to carefully adjust anchor box related hyper parameters and have poor performance in special fields with large object size/ratio variations and complex background texture. In this study, we proposed a new accurate, robust, and anchor-free method to handle automatic object detection and classification problems. First, we used the feature pyramid network (FPN), to merge the feature maps of different scales of features extracted from a convolutional neural network (CNN), which allowed easy and robust multi-scale feature fusion. Second, we built two subnets to generate candidate region proposals from the FPN outputs. followed by another CNN that determined the categories of the proposed regions from the two subnets.
Introduction
Detection of an object and identification of its category is an important issue in the field of computer vision and pattern recognition. Object detection and classification is computer technology that deals with the detection of the instances of semantic objects or a certain class (such as humans, buildings, or cars) in digital images. The applications of object detection include face detection and recognition, fabric defect detection, invoice detection, and animal detection. Methods for object detection consist of traditional machine learning-based approaches1,8-12 and deep learning-based approaches.13-18
For machine learning approaches, the bag-of-words (BoW) feature 1 and the histogram of oriented gradients (HOG)2,6,8 are commonly used for feature extraction. The main advantages of the BoW model are its simplicity and invariance under viewpoint changes and background clutter. It has been widely adopted by the community and results in a good performance for object detection. The HOG feature represents an object by the distribution of gradient intensities and orientations in spatially-distributed regions, and it has been widely acknowledged as one of the best features to capture the edge or local shape information of the objects. Although many visual descriptors have been proposed, features from different descriptors generally describe different aspects of visual characteristics of the object. Due to the diversity of object appearances, the fusion of visual features is necessary for high-performance object detection. Feature fusion 3 and dimension reduction4,7 are two common methods to further improve feature representation performance. With features pre-processed by feature extraction, feature fusion, and dimension reduction, a classifier can be trained using a number of possible approaches to minimize the misclassification error.
In practice, many different machine learning approaches can be selected including, but not limited to, the support vector machine (SVM)2,9,12 and AdaBoost. 5 However, these methods are usually unable to handle more complex detection issues (e.g., complex backgrounds and textures in the image), since these methods need a lot of time to compute the features and their performance depends on the quality of the training images.
In recent years, deep learning methods have fundamentally changed object detection and classification19-26 in many visual tasks. Original deep learning methods mainly focused on image classification tasks,20,23 and gradually these deep models were extended to handle other tasks such as object detection14,15,17 and semantic segmentation.13,20 In particular, for object detection tasks, anchor-based convolutional neural networks (CNNs)18,21 are currently popular methods. They rely on a set of pre-defined region proposals (i.e., anchors)16,19 to represent interested areas within the images for feature learning, and then classify and localize these regions at the same time.
Given the ground truths (correctly labeled data), these methods can automatically perform feature learning and representation on different images for conducting both object classification and bounding box regression with powerful performance. It was shown that these techniques have specifically provided a significant improvement in object detection and classification tasks.
Especially, CNNs are able to do end-to-end object detection, classification, and segmentation without specifically-defined features. There are mainly two general object detection methods based on CNNs: 1) two-stage methods, such as Faster RCNN, 16 Mask-RCNN, 17 and PVA-net. 14 These methods first generate region proposals, and second do the classification and 2) one-stage methods that include Single Shot Detector (SSD), 18 Yolo, 20 and RetinaNet. 21 These kinds of methods process object detection and classification at the same time. Two-stage methods usually use more computational resources, but achieve higher accuracy than one-stage methods.
To locate different sizes of objects in an image, the combination of different scales of features (i.e., the feature pyramid network (FPN)) 22 has recently been widely used in computer vision tasks. For example, U-Net 23 and PSEnet 24 can greatly improve the accuracy of object detection based on different scales of image features.
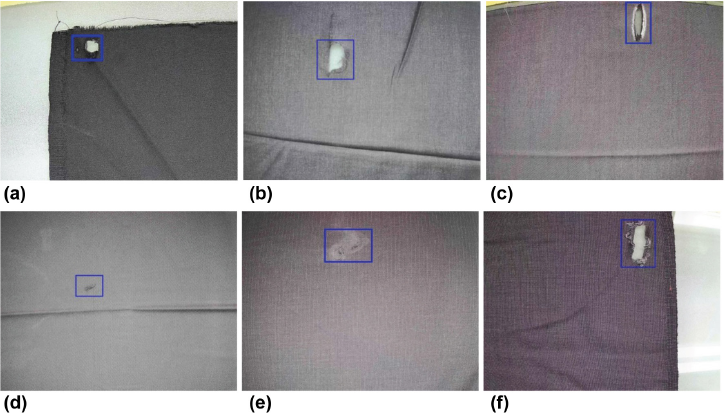
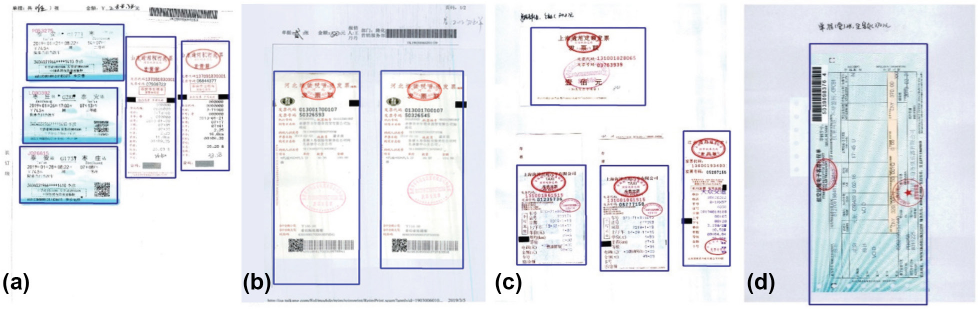
Although some great progress in object detection has been made, it still fails to handle some difficult industrial applications because of low efficiency or accuracy. For example, when some general object detection methods in images with complex texture backgrounds or huge object size/ratio variations, such as fabric defects and financial invoice detection, are applied, the accuracy of detection and classification are relatively low. Fig. 1 shows typical types of fabric defects in textiles. Fabric defects usually include broken holes, needle-punched holes, brush holes, stretched warps, fur spots, and fur holes. Their size, aspect ratio, and appearance greatly vary from image to image. The complex textures of fabrics also incorporate difficulties for object detection. Fig. 2 shows examples of scanned financial invoices. Financial invoice detection is vitally important in automatic invoice recognition and validation since it is the first key node of the full detection-recognition-validation pipeline. The most common financial invoices are roll invoices, train tickets, air tickets, taxi receipts, and quota invoices. For financial invoices, the size of each kind of invoice tremendously varies in different images. In addition, they are usually closely arranged and the boundaries of invoices are blurry within one finance image. Thus, detecting objects from invoice and fabric images is a great challenge, in which it is difficult to achieve both speed and accuracy using current state-of-the-art methods.
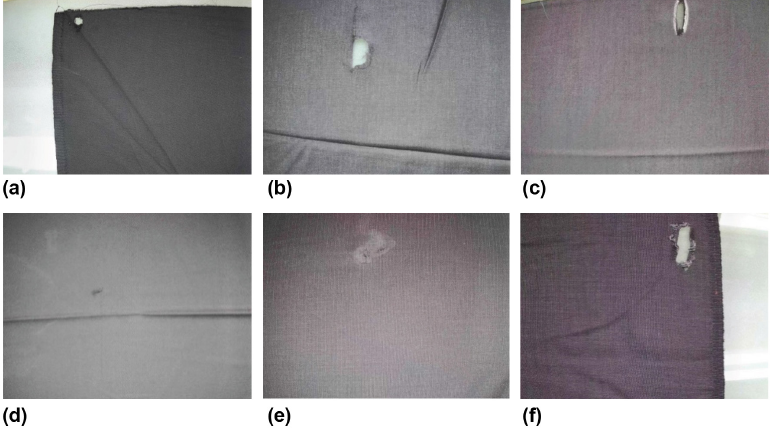
Examples of defective fabrics. (a) Broken hole, (b) needle-punched hole, (c) brush hole, (d) stretched warp, (e) fur spot, and (f) fur hole. Note that the defects in these images tremendously vary in both size, aspect ratio, and appearance.
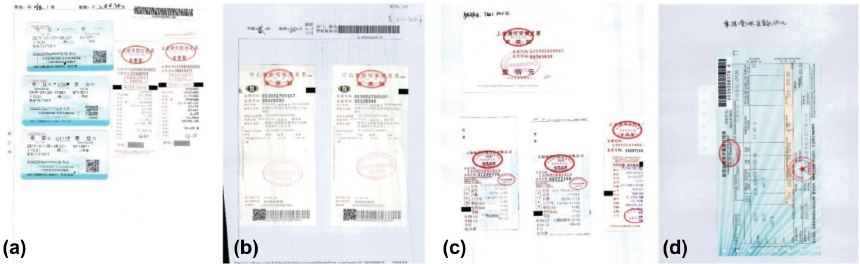
Scanned financial invoice examples. (a) Train tickets and taxi invoices, (b) roll invoices, (c) quota and taxi invoices, and (d) air ticket. Difficulties of object detection included variations of invoice sizes and aspect ratios, blurred boundaries, and closely arranged invoices.
To solve the problem of detecting multi-scales of objects, a novel CNN model was proposed for object detection and classification in this study. Unlike defining a set of features manually, we designed a fully automatic neural-based deep learning framework to extract discriminative features from training samples and subsequently perform the classification task. This method can be used in different industrial cases without extra computing resources. The main contributions are:
To meet industrial needs, the model uses a feature pyramid network to detect objects at a variety of scales and achieves both greater accuracy and efficiency than the prior state-of-the-art models across a wide variety of datasets, which is verified by comparative experiments in object detection and classification.
The proposed model is an anchor-free framework for object detection, while most of the prior state-of-the-art models set predefined anchors to enumerate possible locations. The detection performance of anchor-based methods is sensitive to hyper parameters of anchors. A hyper parameter is a parameter that is set before the learning process begins. By eliminating possible negative impacts on model accuracy and complicated overlapping computation related to anchors, the model can serve as a simple but strong alternative for many industrial level tasks.
The rest of this study is organized as follows. We introduce the proposed CNN-based method for object detection and classification, and then we evaluate the performance of the proposed algorithm.
The Proposed Method
Object detection and classification are difficult in images with multi-scale objects and complex background textures. To solve this problem, we propose a two-stage Efficient and Accurate Scene Text Detector (EAST) 27 style network with FPN as the feature merger that can precisely obtain object location and category. The model is composed of a backbone network which computes feature maps of the input image, and two task-specific subnets, which are used to determine existences and positions of objects. To deal with the problem of enormous size and various aspect ratios of different objects in an image, the model uses FPN to extract different scales of features and generates high-resolution feature maps by feature fusion in the last stage of the pipeline.
The general architecture is shown in Fig. 3, and the whole data flow pipeline is illustrated in Fig. 4. The first step of the pipeline is to obtain feature maps from the input image by a feature extractor (i.e., the backbone network), and then the feature maps are merged by up-sampling and concatenating operations to obtain the fused features. Object score maps and location maps from the fused features are obtained, which indicate both the existence and the locations of the objects in the input image (i.e., candidate region proposals). Finally, the quadrangle regions are cropped from the input images and sent to the classification sub-model to obtain the categories of the objects.
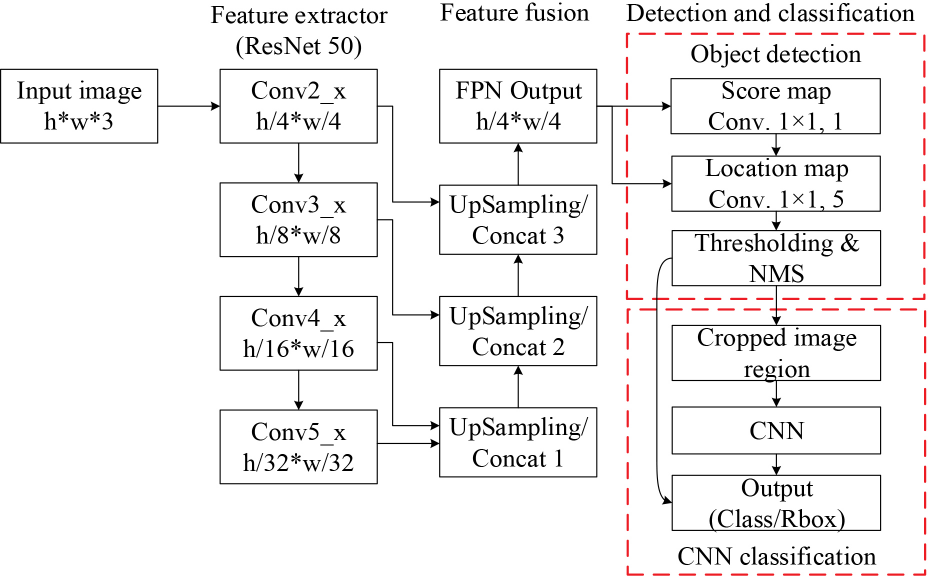
Network architecture of our model.
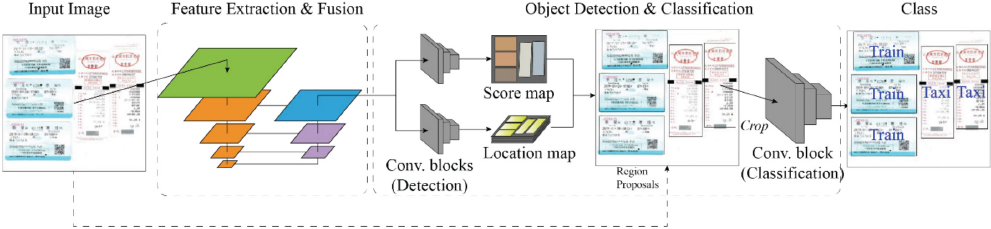
Data flow pipeline of our model.
Label Generation
As described in the references 27 and shown in Fig. 4, for all labeled objects in the image, a rotated rectangle that covers the region with minimal area is first generated. Ten, five layers of a location map and one layer of a score map are generated (i.e., the ground truth). The predicted values of the location map and the score map will be generated by the proposed model, and losses (the values calculated by the loss function) are calculated at each training iteration step (Fig. 5).
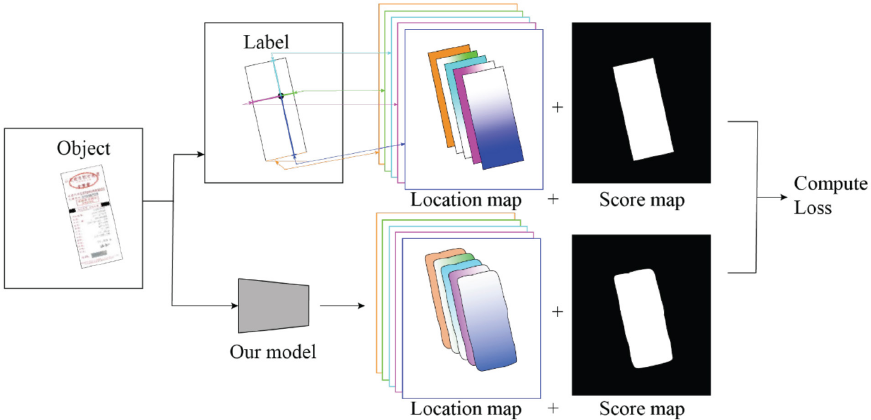
Label generation and loss computation.
Feature Extraction and Fusion
Like many other public one-stage or two-stage detectors, the backbone can be a ResNet 28 or VGG 29 network according to different tasks or dataset, which produce a series of outputs from different convolutional stages (feature map 1, feature map 2…). Each level of the output is used to detect objects on a different scale.
Since the backbone consists of CNN blocks, before being fed into the backbone, the input images need not be resized to a fixed size. For ResNet, we selected outputs from Conv2 to Conv5 blocks as extracted features to build the FPN, and for VGG, we selected Pooling 2 to Pooling 5. The first layer of the feature maps, feature map 1, has 1/4 resolution of the input image and feature map 4 has 1/32 resolution, as Fig. 6 shows. The feature map level selections will cover most object detection situations.
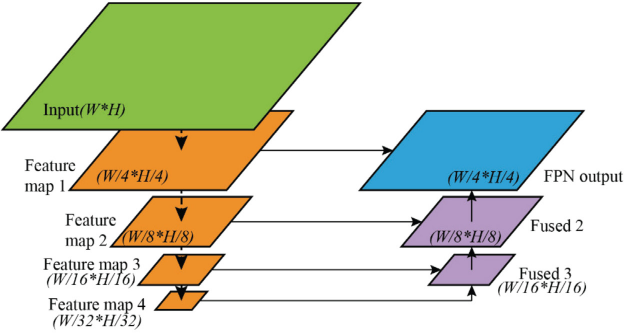
Feature extraction and fusion process.
Fig. 6 also schematically illustrates the layout of the feature fusing operation. The feature fusion module uses up-sampling and concatenation operations to fuse together feature maps of different levels. The concatenation starts from the most abstract layer; feature map 4 in Fig. 6. For fused map 3, feature map 4 passes through an up-sampling layer, to double its size, and then is concatenated with feature map 3, to yield fused map 3. For other fused maps, the n fused feature map is first up-sampled and receives the feature-map of layer n -1, and then they are concatenated together, as shown in Fig. 7. The concatenation is executed along the channel axis. Finally, after the last feature fusion operation is done, the width and height of the fused feature map are 1/4 of the input image (since the feature map 1 from the backbone is 1/4 of the input image).
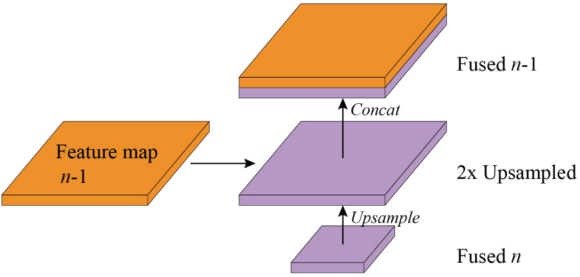
Feature fusion operation.
Object Detection and Classification
On the top of the last feature merging output, our model introduces two subnets: the detection subnet and the classification subnet. They are two fully-convolutional networks. The data of the final fused feature map passes through the two subnets and produces two kinds of outputs. As shown in Fig. 5, one output is called the score map, where the pixel value indicates whether this pixel belongs to a target or background. To be more specific, a 1×1 convoluted layer with K filters, followed by the Sigmoid function, is the final output of the classification subnet. It predicts the probability of objects at each spatial location for K object classes. The other subnet output is the location map. Five channels are used to represent the region proposal, where four of the five channels denote the coordinate shift of four corner vertices from the pixel location to the top, right, bottom, and left boundaries of the rectangle respectively; and the last channel denotes the box rotation angle. 27 The rotated bounding box region of the object can be regressed from the five channel pixels.
Each object region predicted by the detection subnet is filtered by classification score thresholding and non-maximum suppression (NMS), and the surviving region proposals after thresholding and NMS are cropped from the original image and then fed into the classification subnet, as shown in Fig. 3.
The classification subnet is made up of five convoluted layers. At the last stage convolution of the classification subnet, the fully-connected layer is replaced by a 1×1 convoluted layer with K channels plus a sigmoid activation, since the 1×1 convoluted layer has advantages of similar performance and fewer parameters over a fully-connected layer.
The loss function consists of two parts: one is used for generation of the candidate region proposal and the other is for classification. According to the literature, 13 compared with the L2 loss, the IoU (intersection-over-union) loss can converge faster and obtain more accurate results. Thus, the IoU loss is used to calculate the loss in the detection process (Lr) and is described in Eq. 1.
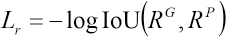
Where RG represents the ground truth of the candidate region and RP represents the predicted region. The IoU in Eq, 1 is represented in Eq. 2.
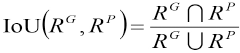
The IoU has been widely used as a metric to evaluate performances of object detection models in the testing stage. Currently, the most commonly-used loss functions to regress the bounding box (e.g., L1 distance or L2 distance) have disadvantages on small objects, since they use the absolute distance metric rather than the relative metric. Use of the area rather than width and height also encodes the relationship of the bounding box parameters, rather than considering them as independent variables as do L1 and L2. The IoU loss is invariant to object scales, and it increases the gradient of the boxes with low IoU and decreases the gradient of boxes with high IoU, which can improve the localization accuracy of the model. Experimental results show that this loss function can efficiently work with different scales of objects.
The other loss function is the classification loss (Lc), which is calculated by the cross entropy (CE), a common loss function in classification tasks. The CE loss measures the performance of a classification model whose output is a probability value between 0 and 1 (Eq. 3). It increases as the predicted probability diverges from the actual label. The Log formula in Eq. 3 penalizes model errors especially when its predictions are wrong.
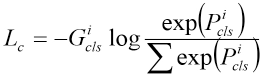
The i in Eq. 3 is s the i-th sample,
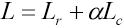
Where α is the weight coefficient to balance the losses. In our method, we set α = 5. We used this form in our experiments as it yields slightly improved accuracy over the non-balanced form.
Experiments
Evaluation Datasets
To verify the effectiveness of our method, we performed experiments on two categories of datasets. One is the public object detection dataset VOC2012. 30 The others were the industrial application, the fabric defect, and the invoice data-sets prepared by the authors.
The fabric defect dataset consisted of 20,000 images (17,000 for training and 3,000 for testing) with six classes of fabric defects. There were 0-4 defects in most images of this dataset.
The invoice dataset consisted of 30,000 scanned images (25,000 for training and 5,000 for testing) with five classes of financial invoices. In each image, there were 1 to 8 same or different kinds of invoices with rotation angles of about 0, 90, 180, and 270 degrees. The invoices were annotated by quadrangles with four ordered vertices.
Implementation Details
Our model was implemented in Python using Tensorflow on an NVIDIA P100 graphics processing unit (GPU). During training, different backbones used as feature extractors, including VGG, 16 ResNet18, and ResNet50 were tested. In addition, we performed a comparison to evaluate the performance of our model with other state-of-the-art object detection models such as SSD and Faster RCNN.
In the experiments of the model on various datasets, hyper parameters including batch size, learning rate, and epoch size were adjusted to meet the hardware specifications and to ensure a steady convergence.
For the VOC2012 dataset, the learning rate was set to 0.001 for the first 50 epochs, and then it was reduced 0.0001 for the remaining epochs. Batch size was set from 4 to 32 based on training progress.
For the fabric defect dataset, data augmentation was necessary to increase the robustness of the model. Some image pre-processing methods, including flipping, cropping, and random rotation, were used in data augmentation. The learning rate of the model in fabric defect training was set to 0.001 in the first 50 epochs and adjusted to 0.0001 in the following steps. The batch size was also set from 4 to 32 based on training progress. Early stopping was applied to monitor the training process to avoid over-fitting.
In the training of the invoice detection model, we divided the 25,000 training images into three classes according to image quality (quality criteria included image noise, blurring, distortion, and wrinkles), and then these were denoted in three categories as poor data, fair data, and good data. All the poor data and a half of the fair data were used at the first training stage of 60 epochs with a batch size of 32. At the second training stage, the other half of the fair data and all the good data were used for another 40 epochs of training. The training process used the Adam optimizer 19 to optimize both the losses for the object detection and classification with an initial learning rate of 0.001 and weight decay of 0.0005. All experiments were performed on a standard Linux server. The primary evaluation criterion of object detection is mean average precision (mAP).
Experimental Analysis
As previously described, hyper parameters and training settings used in the model included use of a pre-trained backbone or not, use of data augmentation or not, and batch size. To investigate impacts of training settings on the performances of the model, we conducted experiments of our model using VGG16 as the backbone. The impact of training settings on the model's mAP can be seen in Table I. It was found that:
Model Performances of Various Training Settings on Various Datasets. a
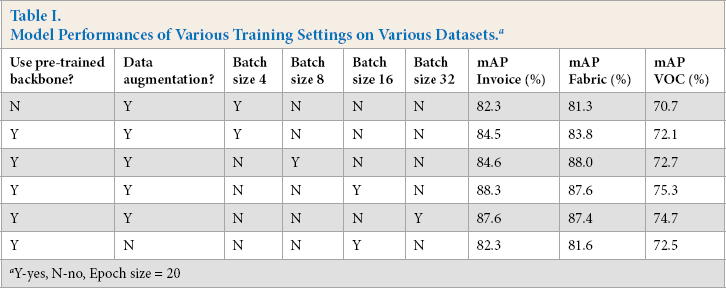
Y-yes, N-no, Epoch size = 20
Use of pre-trained backbone weights improved the performance of the models with limited batch or epoch sizes.
Data augmentation was an important way of improving the accuracy of the model.
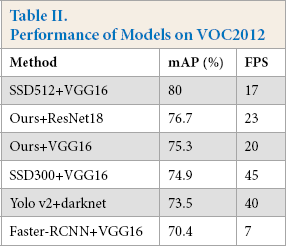
On the VOC2012 dataset, the object detection performances of our model, as well as other models, are listed in Table II. Although our method did not surpass the performance of SSD512 on VOC2012, it is clear that our method with ResNet50 (with 78.3% mAP) performed slightly better than SSD300 (with 74.9% mAP) and Yolo v2 (with 73.5% mAP) since the network was not designed for VOC2012 data.
Performance of Models on VOC2012
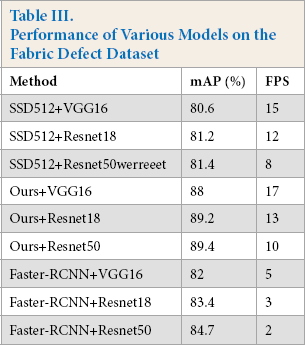
For the fabric defect dataset, Table II shows the experimental results of various models on this dataset. The running times of the models were measured in frames per second (FPS). Our model with Resnet50 outperformed the existing state-of-the-art models, had the highest global mAP (89.4%), and achieved at least a 4.7% improvement over other methods. Some detected examples are shown in Fig. 8. Table III lists the experimental results of the proposed model on test images of the fabric defect dataset. In general, the proposed pipeline can correctly recognize most of the fabric defects of various sizes.
Some results on the fabric defect dataset. (a) Broken hole, (b) needle-punched hole, (c) brush hole, (d) stretched warp, (e) fur spot, and (f) fur hole.
Performance of Various Models on the Fabric Defect Dataset
Compared with the fabric defect dataset, the invoice dataset, consisting of 30K images was much larger, and thus the experimental results were more reliable. We evaluated performances of our method as well as SSD, Faster-RCNN on this dataset. Table IV shows the results of various detection models on the invoice dataset. The results show that our model with ResNet50 as the backbone had the highest mAP (92.5%). For each object class, the model had AP values of 98.0%, 92.5%, 93.5%, 94.6%, and 84.2% on the roll invoice, quota invoice, train ticket, air ticket, and taxi receipt data, respectively. When using VGG16 as a feature extractor, although the model had a slightly lower mAP of 88.3%, it still surpassed the SSD512 and Faster-RCNN methods, which had mAP values of 86.6 and 84.4, respectively. Tat means our model was robust and had enough capacity to detect various objects in one image. The detected invoice examples are shown in Fig. 9.
Some results on the invoice dataset. (a) Train tickets and taxi invoices, (b) roll invoices, (c) quota and taxi invoices, and (d) air ticket.
Performance of Various Models on the Invoice Dataset
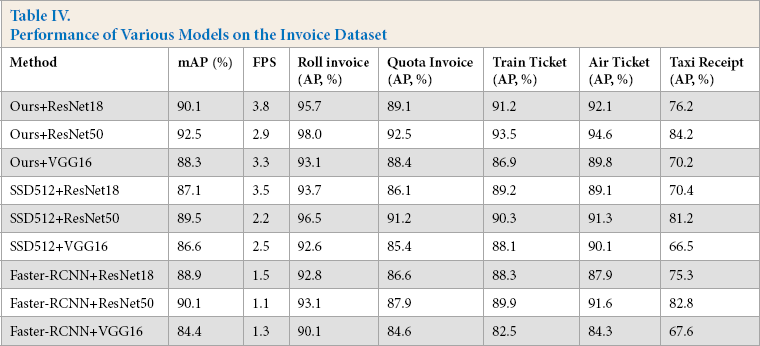
The average inference time costs (including the model I/O time) of a financial image (JPEG image with a resolution of about 1200 × 800 pixels) are listed in Table IV. Due to the simple, but efficient, pipeline architecture, the computation cost was satisfactory. The average inference time of our method confirms that our pipeline can achieve quasi-real-time automatic financial invoice detection and recognition if this model is further connected with a financial invoice optical character recognition (OCR) module. The experimental results can be summarized as follows:
Our method performs well enough not only on the fabric defect dataset and invoice dataset, but also on more general object detection datasets such as the VOC dataset. Therefore, our method possessed a good generation ability that can work well on various types of detection tasks.
Our method is a high-performance and efficient model that may be used in some object detection situations that may not have enough computing capability.
Conclusion
In this work, we present a two-stage detector for image object detection and classification. This detector was composed of a feature pyramid network (FPN)—for feature extraction and feature fusion—connected to two subnets (object detection and classification). The main contributions of this research can be summarized as follows:
The model used an FPN to detect objects at a variety of scales and achieved both greater accuracy and efficiency than the prior state-of-the-art models across a wide variety of datasets, which was verified by comparative experiments in object detection and classification.
The proposed model was an anchor-free framework for object detection, while most of the prior state-of-the-art models set predefined anchors to enumerate possible locations. The detection performance of anchor-based methods is sensitive to the hyper parameters of anchors. By eliminating possible negative impacts on model accuracy and complicated overlapping computation related to anchors, our model can serve as a simple, but strong, alternative for many industrial level tasks.
For future work, this pipeline can be connected to a visual recognition network that can recognize all the desired key values in the image, such as the invoice number and tax amount. This full detect-classify-recognition pipeline will be very promising for automatic visual detection processing.