
Abstract
Classifying categories of fabric defects can greatly help to identify the source of causing fabric defects in the textile manufacturing process. Most existing artificial intelligence based methods focus on identifying and locating defective regions and do not analyze the categories of the defects. On the other hand, as current fabric defect detection methods depend on handcrafted features, they can only handle fabric with specific patterns or textures. In this paper, we propose a novel model which can learn high-level representation from the automatic observations of the input images that can recognize the categories of the defects for various fabric patterns and textures, instead of only locating defects on specific patterns. Experimental results show that the proposed method is superior to the state-of-the-art deep hash methods in terms of fabric defect classification.
Introduction
Fabric defect detection is an important and indispensable process of quality control in the textile manufacturing industry. 1 Traditionally, fabric surface defects are detected by human vision, which is able to discover and repair minor defects immediately. This, however, leads to increased production cost as additional payments for workers are required. Moreover, the efficiency of manual detection or classification cannot be guaranteed, especially when workers keep working for hours and they are fatigued. Therefore, an automatic fabric inspection system is needed to help reduce production cost and at the same time improve fabric quality. Developing efficient fabric defect detection or classification methods for the inspection system are necessary.
Many methods have been proposed to deal with the problem of fabric quality inspection.2,3 These methods can be roughly divided into three categories: statistical, spectral, and model-based methods. 4 Statistical methods aim to locate defects by discovering the distinct statistical texture characteristics of the patches in a given fabric image.5,6
Statistical methods heavily rely on the selected sliding window size as well as the discrimination threshold and they do not consider the global information of the fabric image. 7 Compared to statistical methods, spectral analysis methods take image global information into consideration as they choose a suitable orthogonal basis to transform the image to the spectral domain.8,9
Recently, with the development of deep learning,10–13 many researchers have adopted it to detect fabric defects. This kind of model-based method extracts image features via modeling and decomposing techniques. Compared with the statistical and spectral methods, model-based methods are more robust, as it can discover surface variations of randomly textured fabric.14,15 There were many model-based methods already designed to solve different fabric detection problems.7,16,17 On the other hand, fabric inspection using traditional methods usually contain two stages: feature extraction and feature identification. Designing discriminating features is the key issue in the process of fabric defect detection. These features can be in the spatial domain, as in Local Binary Pattern (LBP) and Histogram of Oriented Gradients (HOG), in the covariance matrix, or in the transform domain as Fourier, wavelet, and Gabor transforms. 18 This kind of feature is “handcrafted” and is manually designed for overcoming specific issues like occlusions and variations in scale and illumination. 19 Designing handcrafted features usually involves finding the trade-off between computational efficiency and accuracy of a specific task. Additionally, deep features learned by convolutional neural networks (CNNs) are considered to be discriminating for recognition and classification tasks in computer vision. Different from handcrafted features, deep features are automatically learned from the observations of the input images. 20 The idea of obtaining deep features is to find a higher-level semantic representation of the data, by which the accuracy and robustness can be improved in detection and classification. 21
With such advantages, CNNs have been applied with great success to detection, 22 segmentation, 23 as well as recognition 24 and classification 25 in the field of computer vision. In the work, 18 the deep learning technique was first applied to the application of fabric defect detection via designing a Fisher criterion-based loss to improve the detection accuracy when limited defective images are available. Also, several methods based on deep learning have been proposed to solve the problem of fabric defect detection.26–28
However, most of the existing methods based on deep learning focus on locating the defective regions of given images and do not consider the defect categories. Actually, recognizing the categories of defects is necessary in applications to textile production, as it can help to trace back to the source of causing the problem. On the other hand, calculation during the training and testing processes is based on continuous values in previous deep learning models, which is more time-consuming than that based on binary codes. Therefore, it is necessary to develop an efficient method that can identify the categories of the fabric defects and at the same time reduce the computing time in the testing stage.
Based on this, in this study, we design an end-to-end CNN for efficient defect classification. The main contributions of this paper are summarized as follows. A deep hashing model is designed to obtain concentrated and compact binary codes for efficient fabric defect classification. The model is less time-consuming than existing methods as the calculation is based on binary codes instead of continuous values in both the training and testing stages. The hashing loss function of the model incorporates the projection matrix together with pointwise similarity-preserving to improve the accuracy of defect classification and simultaneously preserve the discriminability of the hashing code.
The remainder of the paper briefly reviews and analyzes the related works of the proposed method, and introduces the deep neural network framework and the newly proposed loss function of this work. Next, the experimental results and relevant analysis are presented followed by the conclusion.
Related Works
There are many traditional methods for fabric defect detection.7,29 Most existing methods can only work on specific kinds of fabric or locate defective regions for given images. They cannot identify the categories of fabric defects.
Different from the traditional methods, the methods based on CNNs can work better on large-scale image databases. 26 Deep hashing methods is a research hot spot as it has present efficiency in image retrieval and image classification. A deep hashing study typically consist of a new architecture, loss function, or binary inference formulation. The deep hashing network (DHN), proposed in 2016, is the first end-to-end framework that simultaneously preserves similarity of data pairs and minimizes the quantization error of the loss function. 30 HashNet improves DHN by balancing the error between positive and negative data pairs, as well as lowering the quantization error by using continuation technique. 31
The main drawback of previous hashing methods is that they cannot obtain effective hash codes for Hamming space retrieval as the data points that are out of the Hamming radius 2 are discarded early at the testing stage. This is because the loss function cannot effectively penalize the Hamming distance of two similar points into a small radius, and thus the obtained hash codes of a similar data pair may have a distance outside Hamming radius 2.
Such hash codes are not discriminating for the tasks of image classification and image retrieval. To overcome this drawback, Cao et al. proposed deep Cauchy hashing (DCH) 32 for Hamming space retrieval. DCH can preserve similarity of data pairs by using cross-entropy loss and control the quality of hash codes by using quantization loss.
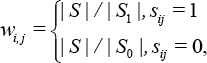
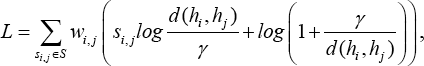
In DCH, 32 Bayesian was used as the basic concept to learn hash codes for data points. Given training images with pairwise similarity labels as {(x i , x j , s i,j ): S i,j ∈ S}, the hash codes H = [h1,h2,…,h N ] for N training images can be defined in Eq. 1 by using the logarithm maximum a posteriori estimation.
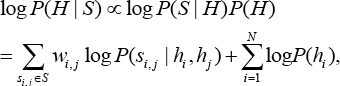
In Eq. 1, P(S i,j | h i , h j ) denotes the conditional probability of s i,j corresponding to hash codes (h i , h j ) and can be naturally defined by the Bernoulli distribution (Eq. 3).
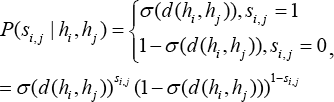
σ(d(h i ,h j )) is the Hamming distance of h i and h j From Eq. 3, the smaller σ(d(h i ,h j )) is, the larger the conditional probability P(1 | h i ,h j ) will be, otherwise, the larger the conditional probability P(0 | h i ,h j ) will be. This indicates that hash codes h i and h j corresponding to data pair x i and x j with a smaller Hamming distance would possibly be considered as similar, while that with a larger Hamming distance would possibly be considered as dissimilar.
Different from previous approaches, we propose a deep model which can learn high-level representation from automatic observations of the input images and obtain hash codes for efficient fabric defect classification.
Proposed Method
In this section, we first introduce the notations used in this paper. Next, we use sentence-level explanations to describe the problem definition. Finally, we present the proposed method in detail.
Notations
Summarily, throughout this paper, scalars are denoted as uppercase letters (e.g., N), while vectors are presented as lowercase italic letters (e.g., x, y). Matrices are denoted as uppercase italic letters (e.g., X, Y). ||X||2 denotes the L2-norm of the matrix X.
The Deep Framework
The designed hashing framework is extended from AlexNet. 25 That is, the first five convolutional layers (conv1-conv5) and the three fully connected layers fc5 -fc8 are used in the proposed method. In addition, the original classifier fc8 in AlexNet is replaced with a new hash layer fch of K bits in the proposed method.
Specifically, for a given input fabric image x., it is transformed to K-dimensional continuous code Z i ∈ R K after classifier layer fc7, and that is used as input in the hash layer fc8. The hash code denoted as h i can be obtained by using the sign thresholding as h i = sgn(z i ).
Unfortunately, the sign function is hard to optimize due to ill-posed gradients. Instead, the hyperbolic tangent (tank) function is used to squash the continuous code z i . after fc7 to be within the area of [-1,1].
By doing so, the gap between the continuous code z i . and the hash code hi. can be reduced, which is helpful to ensure the effectiveness of hash codes for further efficient fabric defect classification. Then, after the hash layer fch, a specific loss function is proposed to learn discriminating projection space and simultaneously preserve the point-wise similarity based on the Cauchy distribution. Since we focused on the specific task, i.e. fabric defects classification, the proposed loss function is mainly designed from the perspective of domain knowledge.
Similarity Preserving and Quantization Loss Minimization
In this section, we introduce the proposed loss function that considers the similarity between each data pair with binary label s i,j as 1, while x i and x j are in the same class and 0 otherwise. Different from most existing hash networks, the ridge regression optimization problem is incorporated into the loss function to minimize the approximation error to obtain effective hash codes for improving the accuracy of classification. The loss function is designed as in Eq. 4.
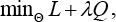
L is Cauchy cross-entropy loss, Q is regression approximation loss, λ is the parameter to balance the two terms and θ is the set of parameters of the network. Similar to the DCH method, 32 the Cauchy cross-entropy loss in Eq. 4 is defined as Eq. 5.
Y ∈ RNxC is the label matrix of N data points within C classes, H ∈ RNxK is the binary presentation of the data points where K is the code length, P ∈ RKxC is the projection matrix and μ is the bias parameter. As in most existing hash methods, we can use continuous relaxation for the hash codes h i . at the stage of training. When testing, the hash codes can be obtained by using the sign function as h = sgn(h), where sgn(h i ) = 1 if h i > 0 and -1, otherwise (i = 1, 2…,K).
As shown in Eq. 4, the first term is able to learn compact hash codes by jointly preserving the similarity of data pairs. The second term can minimize the error between the data distribution and the approximation error in regression form, by which the weights of the neural network are optimal for classification.
By incorporating the minimization problem of ridge regression approximation into hash code learning, the proposed method can learn effective hash code for efficient calculation and improve the accuracy of defect classification. The pairwise similarity loss and regression quantization loss in the objective function (Eq. 4) can be optimized efficiently through a standard back-propagation procedure.
Experiments
In this section, experiments on two fabric databases were conducted to evaluate the efficiency of the proposed method with several state-of-the-art deep hashing methods. These methods included the deep hashing baseline DHN, 30 deep quantization network (DQN), 35 and DCH. 32 For clarity, the following parts are organized as follows. Firstly, we introduce the setup of the conducted experiments. Then, we present the results on the two datasets: XLFabric and HKBU fabric datasets. Finally, we show the quantitative results of classified defects.
Setup
We took a general operation in setup. The parameters in the objective function have been explored and we reported the corresponding optimal values for λ and μ. In all experiments, A was set as 2/3. Meanwhile, μ was set as 0.5. The batch size was fixed at 128, and the learning rate was set as 0.005. Additionally, the Momentum optimizer was adopted for the proposed method. The training iterated 5000 epochs for all methods, which covered all experiments. When the training finished, the testing set was used to evaluate the performance of all the methods by calculating the classification accuracy.
The performance of the proposed method and other compared methods were evaluated by the classification accuracy that is computed by the ridge regression (RR) approximation and k-Nearest Neighbor (KNN) classifier. The k-Nearest Neighbor factor in all experiments was set as 5. For simplicity, the accuracy corresponding to RR and KNN was denoted as Acc1 and Acc2, respectively.
In addition, we followed the standard evaluation methods to evaluate the quality
of the hash code of all methods for Hamming space retrieval.
36
The evaluation
metric is the Mean Average Precision within Hamming Radius 2 (MAP@ H≤ 2).
Meanwhile, the
Experiments on the XLFabric Database
The fabric images collected from the AI Challenge in Xuelang Manufacturing: Visual Computing Assisted Quality Inspection in 2018 (XLFabric Database) 37 were used to evaluate the performance of the proposed method in terms of defect categories classification.
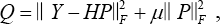
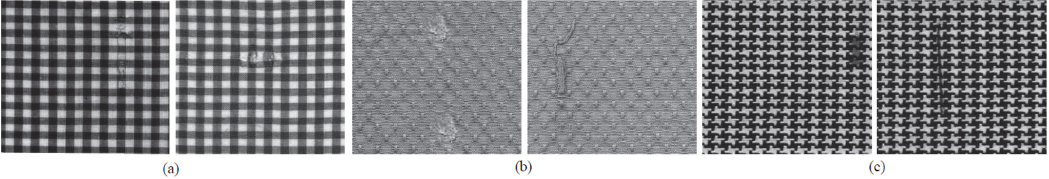
We extracted the annotated regions of the fabric image into seven main categories as hole, float, missing end, missing pick, draw back end, weft crackiness, and normal. The amount of the images were 6246, with 4503 for training, 621 for validation, and 1122 for testing. All the images were converted to gray-level and resized to 256 x 256 pixels. The samples on the XLFabric database are shown in Fig. 1.
Defective images on the XLFabric Database. (a) Hole, (b) Float, (c) Missing End, (d) Missing Pick, (e) Weft Crackiness, and (f) Draw Back End.
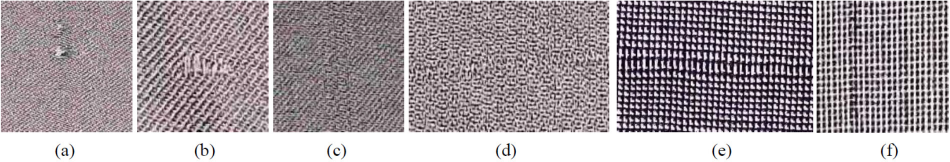
The experimental results, including MAP and accuracy of different methods, are listed in Table I. From Table I, we can clearly see that the proposed method was able to obtain the best classification accuracy; this indicates that the proposed method worked well on identifying different kinds of fabric defects with different gray-levels, patterns, and textures. The precision, recall, and MAP within Hamming Radius 2 of different methods using different hash code lengths are shown in Fig. 2. Generally, the recall within Hamming Radius 2 is considered to be a crucial metric to evaluate the quality of the hash codes of different methods. As shown in Fig. 2b, the recall of the proposed method was the highest on the XLFabric database; this indicates that the proposed method was able to concentrate the data pairs that were similar to be within the Hamming ball of radius 2, by which the performance of recall was satisfactory.
The performance of different methods using 64-bit hash codes on the XLFabric Database. (a) Precision (Prec), (b) Recall (Rec), and (c) Mean Average Precision (MAP) versus different hash bits of different methods.
The Mean Average Precision within Hamming radius 2 (MAP@2%), the classification accuracy using RR (Acc1%) and the classification accuracy using KNN with k = 5 (Acc2 %) of different methods on the XLFabric Database. The classification accuracy of classical AlexNet on this dataset is 0.8458.
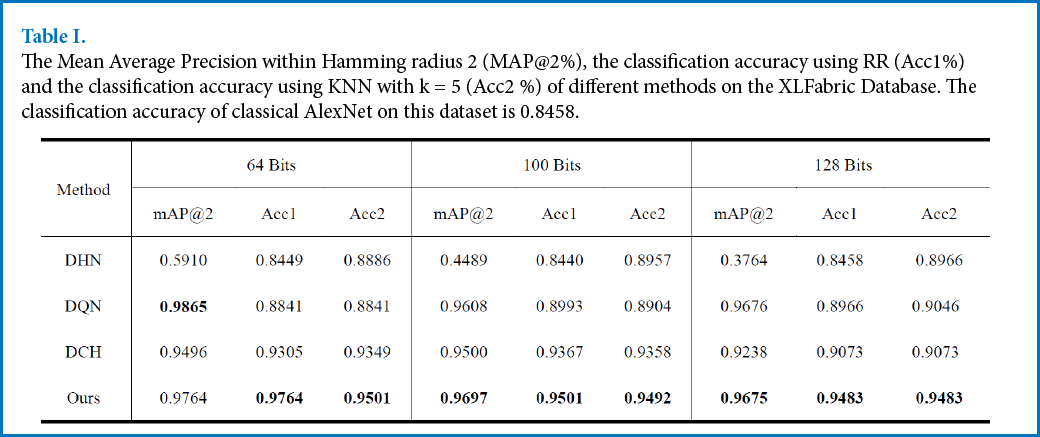
On the other hand, the proposed method is superior to DCH, which is specifically designed for efficient Hamming space retrieval in this database. The potential reason for this phenomenon is that the regression approximation in the proposed objective function can penalize the Hamming space learning to avoid overfitting.
In Figs. 3 and 4, we visualized the learned binary representation of different methods by using t-distributed stochastic neighbor embedding (t-SNE). 34 As we can see from Fig. 3a, the original data points had higher overlap. Figs. 3b and 4a clearly show that the binary embeddings learned by DHN and DQN were not well-separated. From Figs. 4b and c, we saw that even though DCH can separate the data points to some extent, the performance was unsatisfactory. Instead, the proposed method can classify the data in a clearer manner.
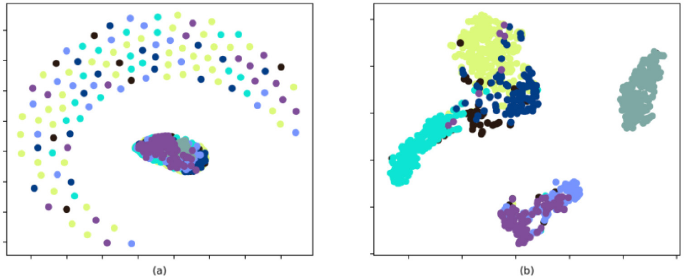
t-SNE 34 visualization of the 64-bit hash codes produced by different methods using testing set on the XLFabric Database (Every point in the figure represents an image in the testing set and the points with the same color belong to the same class). (a) is the results of the original data (Every point represents an image in the testing set) and (b) is the visualization of binary embedding learned by DHN.
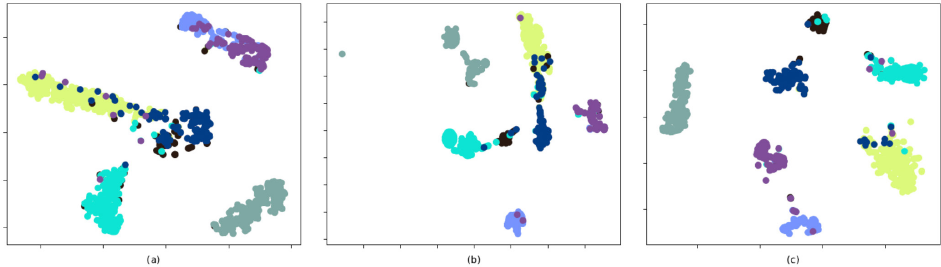
t-SNE 34 visualization of the 64-bit hash codes produced by different methods using testing set on the XLFabric Database (Every point in the figure represents an image in the testing set and the points with the same color belong to the same class). The visualization of binary embedding is learned by (a) DQN, (b) DCH, and (c) Ours.
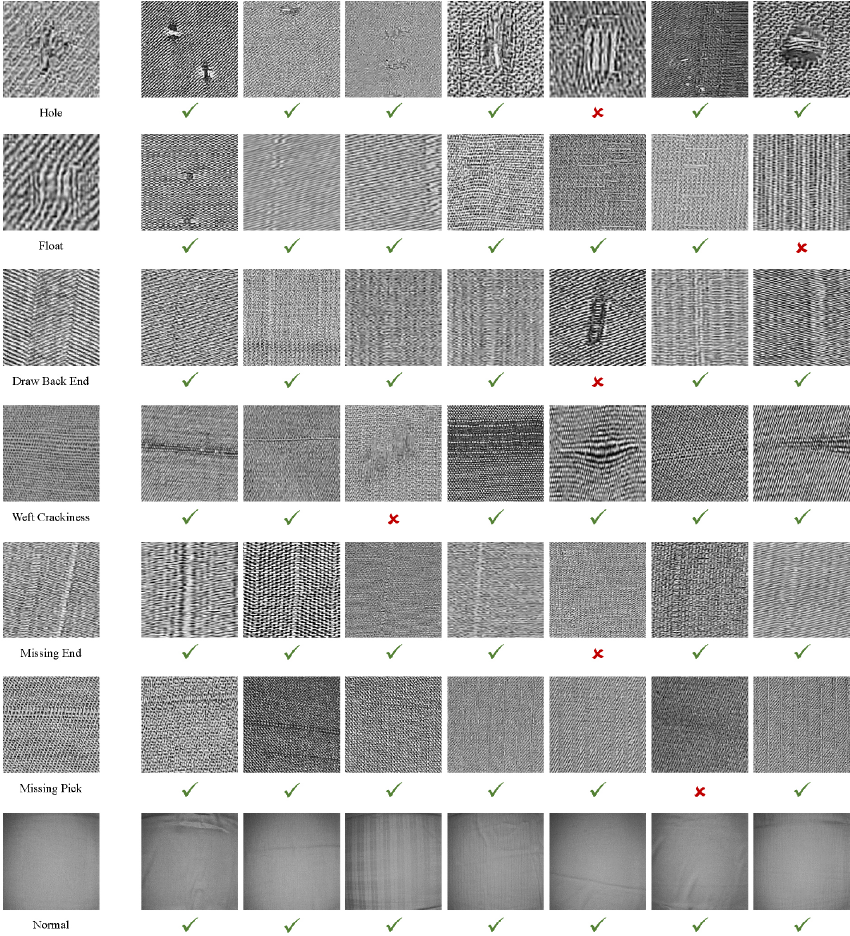
To present how the proposed method performs when classifying different types of fabric defects, we randomly show the prediction results in Fig. 5. Even though some defects looked the same as they present similar textures and structures, our method was able to correctly distinguish all kinds of defects with high accuracy in most cases (e.g., the defects of missing pick). Only one was wrongly recognized, while the other six were all correct.
The prediction results of the proposed method. The fabric defect types from top row to the bottom are Hole, Float, Draw Back End, Weft Crackiness, Missing End, Missing Pick, and Normal, respectively. The black check marks indicate correct predication while the red crosses indicate otherwise.
Experiments on the HKBU Fabric Database
The Hong Kong Baptist University (HKBU) fabric image database is released by the Research Associate of Industrial Automation Research Laboratory at the Hong Kong Baptist University38,39 The database contains three types of fabric images (dot-, box-, and star-patterned fabric). The images were converted to gray-level and resized to 256 x 256 pixels. The total amount of defective images in this database is 83. In this section, we performed experiments on the dot- and box-patterned fabric.
It is obvious that the scale of the data was too small for training deep neural networks. Therefore, we augment the data by two steps. First, we cropped every image to patches using sliding windows of 54 x 54 pixels, or 40 x 32 pixels with half overlapping, depending on the repeating unit. After that, we divided the patches into training and testing sets with equal amounts of images. Then, we augmented the data to be two times the original for the testing set and four times the original for the training set by randomly flipping or changing the illumination of the images. Finally, the amounts of the dot- and box-patterned fabric images were 1726 and 1312, with 1156 and 856 for training, and 570 and 426 for testing, respectively. The sample images of this database are shown in Fig. 6.
Defective images on the HKBU Database. (a) Broken End, (b) Hole, (c) Knots, (d) Netting Multiple, (e) Thick Bar, (f) and Thin Bar.
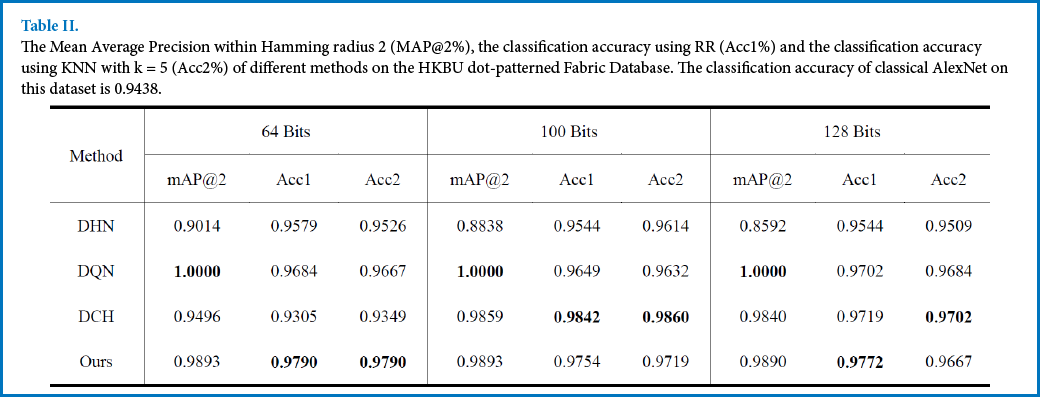
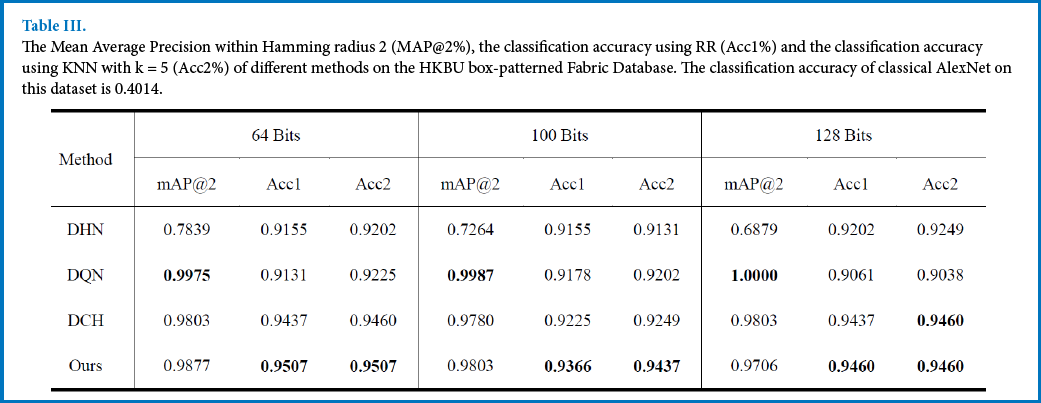
The classification accuracy of the proposed method and the compared methods are shown in Tables II and III. From the results, the proposed method was able to obtain better performance than DCH, which also preserved the pointwise similarity based on the Cauchy distribution.
The Mean Average Precision within Hamming radius 2 (MAP@2%), the classification accuracy using RR (Acc1%) and the classification accuracy using KNN with k = 5 (Acc2%) of different methods on the HKBU dot-patterned Fabric Database. The classification accuracy of classical AlexNet on this dataset is 0.9438.
The Mean Average Precision within Hamming radius 2 (MAP@2%), the classification accuracy using RR (Acc1%) and the classification accuracy using KNN with k = 5 (Acc2%) of different methods on the HKBU box-patterned Fabric Database. The classification accuracy of classical AlexNet on this dataset is 0.4014.
Experiments on the GDFabric Database
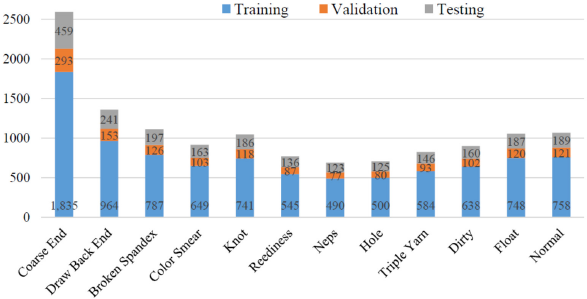
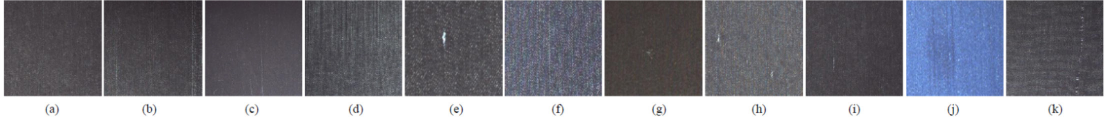
To evaluate the performance of the proposed method for classification on a large-scale fabric defect database, we collected online defect images and created a new defect database. The images were in the competition of the Guangdong Industrial Intelligence Innovation, which was jointly launched by the Guangdong Government and Alibaba Group in 2019. 40 The images were captured from the Textile Workshop in Nanhai, Foshan, Guangdong Province in China, containing 8000 plain and 12,000 color fabric images. In our experiment, we selected 12 main categories from the defective images according to the corresponding labels. The categories included coarse end, draw back end, broken spandex, color smear, knot, reediness, neps, hole, triple yarn, dirty, float, and normal. All the images were converted to gray-level and resized to 256 x 256 pixels. Different from the XLFabric Database, the images recorded the back of the fabric, while the front was shined on by light. There were a total 13,024 images in the GDFabric database, in which each category had a different amount of images. The amount of each category used for training, validation, and testing is listed in Fig. 7 for easy understanding. The sample images in the database are shown in Fig. 8.
The amount of training, validation, and testing samples of each category in our experiment.
Defective images on the GDFabric Database. (a) Coarse End, (b) Draw Back End, (c) Broken Spandex, (d) Color Smear, (e) Knot, (f) Reediness, (g) Neps, (h) Hole, (i) Triple Yarn, (j) Dirty, and (k) Float.
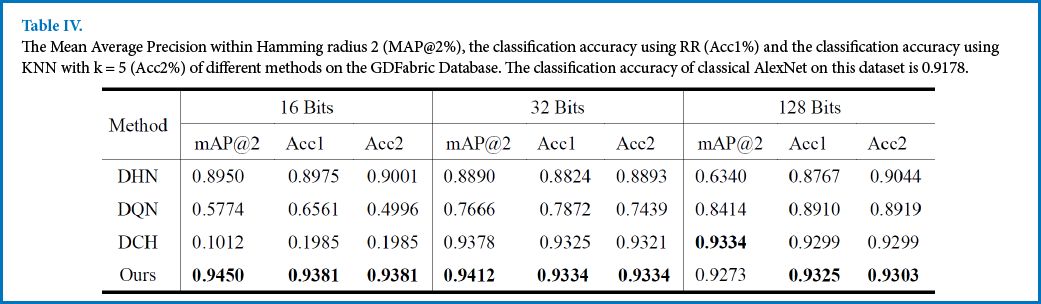
Table IV lists the metrics of MAP and accuracy in this database. The results indicate the effectiveness of the proposed method on large-scale fabric defect classification.
The Mean Average Precision within Hamming radius 2 (MAP@2%), the classification accuracy using RR (Acc1%) and the classification accuracy using KNN with k = 5 (Acc2%) of different methods on the GDFabric Database. The classification accuracy of classical AlexNet on this dataset is 0.9178.
Computing Time Analysis
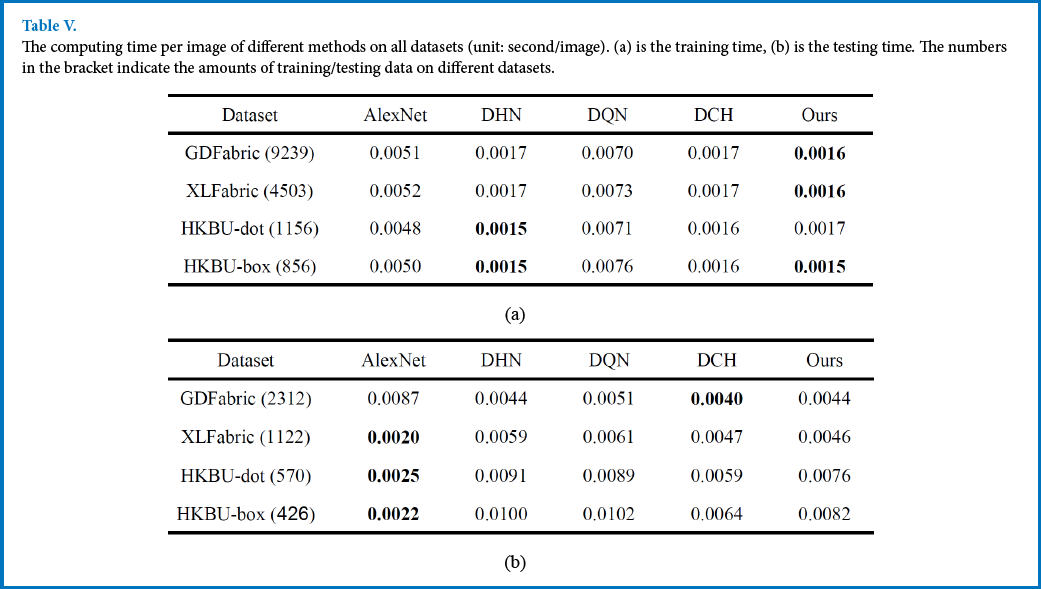
In this section, the computing time of all methods were compared. The training time and testing time of all methods on different datasets are listed in Table V and the average computing time of all methods on different datasets are shown in Fig. 9. From Table Va, most of the hashing methods took less time for training when compared with the classical AlexNet.
The computing time per image of different methods on all datasets (unit: second/image). (a) is the training time, (b) is the testing time. The numbers in the bracket indicate the amounts of training/testing data on different datasets.
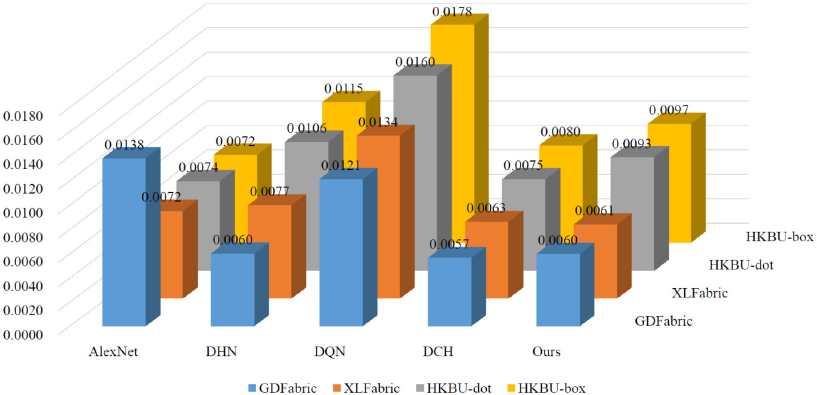
The average computing time of different methods on all datasets (s/image).
In the testing stage, when the dataset was small in size, the difference of computing time between hashing methods and the AlexNet was not obvious. However, the overall computing process of hashing methods became much faster when the dataset was large-scale. This can also be verified by the variation of the computing time in Fig. 9. In addition, the computing time of the proposed method was still competitive when compared with the other hashing methods.
Results and Discussion
From the experimental results on the XLFabric Database and the HKBU Fabric Database, we came to the following conclusions.
(1) The classification accuracy of the proposed method obtained by using the ridge regression approximation was higher than that obtained by using KNN in most cases, while other methods that did not consider the regression approximation error had no such characteristics. This indicates that we can obtain discriminating hash codes for classification by minimizing the loss between the data distribution and the regression approximation during the training procedure.
(2) In Table I, the MAP of DHN was low while its classification accuracy was much higher. DQN obtained high MAP, but the classification accuracy was not so satisfactory. Differently, our method and DCH can both obtain high MAP and high accuracy, but ours performed best. This indicates that using Cauchy cross-entry loss in the objective function can pull the Hamming distance of hash codes of similar data pairs to be smaller, such that the Hamming space was more efficient. The other methods did not have such characteristics and the gap between the learned MAP and accuracy was distinct.
(3) Even though the MAP of DQN in Tables II and III was higher, the classification performance was inferior to the proposed method in most cases. This indicates that considering the classification loss in the objective function was practicable to improve the performance of classification. Another interesting phenomenon is that the MAP and accuracy of DCH in Table IV was low when the length of binary codes was 16, while the proposed method was much better. The potential reason is that DCH was not fit for the case when the length of binary codes was too small in the GDFabric database.
(4) The accuracy of automatic defect classification using our method was satisfactory in most cases. Especially, the results in Fig. 6 show that our method was able to learn discriminating high-level binary representation to correctly predict the category for the testing images in most cases.
(5) Compared to the classical AlexNet, the proposed method can obtain higher classification accuracy in most cases. The results indicated that, for the scenario of gray-level fabric defect classification, the proposed method can represent the input images with compact binary embeddings for classification. Differently, the classical AlexNet represented the input images with high-dimensional vectors that were almost equally spaced, hence it is not easy to use for classification.
Conclusion
In this paper, we proposed a deep hashing method for efficient fabric defect classification. The proposed method is extended from the well-known AlexNet with classifier layer fc8 being an additional hashing layer to transform the deepfeatures to binary interpretation. The proposed loss function incorporated the Cauchy cross-entropy loss and ridge regression to jointly preserve the similarity of data pairs and minimize the quantization error between the data distribution and the regression approximation. By doing so, the convolutional network can guarantee the quality of hash codes and obtain high accuracy for realtime defect classification. The experimental results on three fabric databases show that the proposed method was competitive to the state-of-the-art methods in terms of fabric defect classification.
Footnotes
Acknowledgement
This research is supported by The Hong Kong Polytechnic University (project code: RHR1) and General Research Fund of the Research Grants Council of Hong Kong (Project Code: 15202217).