
Abstract
Single jersey weft knit fabrics include a large portion of knitted products. These fabrics are made using different types of stitches. In this study, several single jersey weft knit fabric samples containing four courses and two wales in the repeating unit of the fabric structure were made by introducing and gradually increasing the number of tuck stitches in the structure, to find out the effect of this stitch on fabric properties. Results showed that tuck stitches could positively affect the areal density, width, and tensile properties of the fabric. For some comfort-related properties, tuck stitches were found to improve wicking and drying properties, reduce water vapor transmission rate, and affect fabric smoothness. The position of tuck stitches in the structure also had some effect, but was not as significant as when the number of tuck stitches was varied.
Introduction
Knit fabrics may have become the most popular source of fashion items worldwide. Weft knits comprise a large number of knit products. Among weft knit products, many are various single jersey knit garments. Knit products have many advantages such as no need for pre-treatment before fabric production, easy handling and care, comfortable to wear, adaptable to the latest fashion trends with modern technologies, comparatively less expensive than woven goods, and so forth. Weft knit fabrics are so named because the loops are formed in the weft (horizontal) direction, whereas in warp knitting, the loops are formed in the warp (vertical) direction. 1 Weft knit fabrics are of two types: single jersey and double jersey. 2 Single jersey weft knit fabrics are made using a single set of needles. Double jersey knits require two sets of needles placed in two-needle beds, which is more complex than the single-needle bed system of single jersey fabrics.2,3 These single jersey weft-knit structures are made using three types of stitches: knit, tuck, and miss stitches. 2 These stitches give various appearances to the fabrics. They can also differ end product properties of the garments to a lesser degree. Since weft-knit fabrics are frequently used in garments, it is essential to control these garment's properties. Among these properties, some are common and need to be controlled during production of fabric or garments, such as fabric width, fabric weight per unit area (GSM), and so forth. The present study looks at the structural impact of tuck stitches on various fabric properties.
Some previous work was done on some common fabric properties resulting from the use of tuck stitches in knits. For example, Asif et al., 4 Uyanik et al., 5 Wasim et al., 6 and Singh 7 stated that the introduction of the tuck stitch in knit structures increases areal density (fabric GSM), thickness, and width, while pilling resistance and resistance against spirality are also improved. Uyanik et al., 5 Kane et al., 8 and Qui 9 also found that use of tuck stitches increase air permeability, water absorbency, thermal insulating property, and tensile properties of the fabrics. The present study includes some of these properties, along with other physical properties related to fabric comfort.
Fabric comfort covers a vast area, with three major factors for consideration: thermal, sensorial, and body comfort. 10 This study is exclusively related to sensorial comfort, related to the sensation a fabric can create when encountering skin contact. It includes water vapor transmission, fabric hand, wicking and drying ability of the fabric, and pilling property. Typical fabric specifications and tensile properties of fabrics containing varying tuck stitches have also been studied here. This focus of the present study is the impact of fabric structure on the previously mentioned physical properties of single jersey weft knit fabrics. In doing so, structural changes in fabrics have been made using tuck and knit stitches in a specific repeating unit structure.
Materials and Methods
This study was done using 32 Ne carded cotton yarn purchased from a local market. All the yarns were from the same batch. The yarns were conditioned in a room 25 ± 2 °C and 65% relative humidity (RH) for about 48 h before use. A total of seven single jersey weft knit fabric samples were made using various fabric structures, comprised of knit and tuck stitches. The designs are shown in Fig. 1.
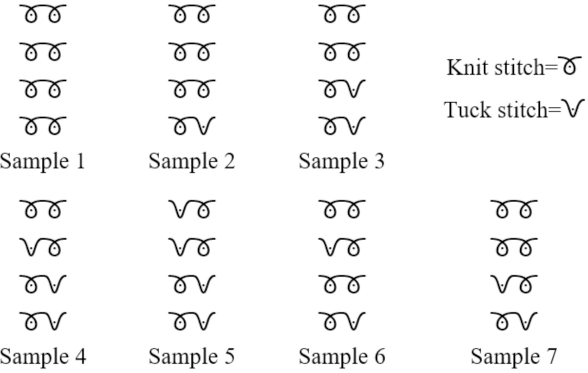
Various weft knitted fabric structures under study.
All of these samples were made on a 10 in. 24G single jersey circular knitting machine (Jiunn Long, Taiwan) having special requirements including a small cylinder and a lower number of feeders. The cylinder diameter of the machine was 10 in. It was set with 24 needles per in. in its cylinder circumference. The machine had 30 feeders for yarn feeding. The same stitch length was maintained for all samples. In the resulting fabrics, the stitch length was 3.0 mm after post-production conditioning (25 ± 2 °C and 65% relative humidity (RH)) for 48 h to relax the fabric. This relaxation helped to flatten the fabric and caused a minimum amount of fabric shrinkage to make it stable in dimension. This type of relaxation is termed as dry relaxation of weft knit fabric. 1 The fabrics underwent several tests after relaxation, including physical and dimensional attributes, pilling resistance, bursting strength, wicking property, drying property, water vapor transmission, and evaluating fabric hand. Testing was performed to determine the effect of tuck stitches on these fabric properties, which can help determine the fabric structures best suited to the end use of the fabric.
The samples were divided into two categories. Samples 1 to 5 had a varied number of tuck stitches in the structure, while samples 3, 6, and 7 had various tuck stitch positions in the structure. Samples were compared in each category separately; only sample 3 was included in both types. For samples 1 to 5, the number of tuck stitches was increased gradually to determine their effect on fabric properties. In the other category, all samples contained two tuck stitches in various positions that were compared to determine their effect on fabric properties. No tuck stitches were stretched to more than two courses to retain better dimensional stability of the fabric.
Materials
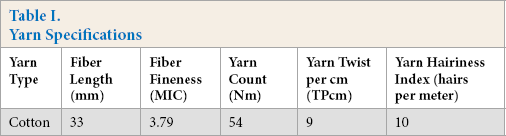
The yarns were collected from the local market. These were greige yarns having no prior pre-treatment. The yarn specification is shown in Table I. The fiber length and fineness were measured using an HVI (high volume instrument, Uster), yarn count was measured using a wrap reel and balance, yarn twist was measured using a yarn twist tester (SDL Atlas), and yarn hairiness index was measured using an Uster evenness tester. The direct red dye obtained from a local market was used for the wicking test, which was also collected from the local market.
Yarn Specifications
Methods
The study was done to determine the effect of tuck stitches on fabric properties. All tests were carried out on fabrics that were yet to undergo any wet treatment. Tat means all fabrics were in a dry-relaxed condition. Wet treatments could cause changes in the fabric specifications and the properties of the raw yarn material. Since this study focused on structural factors of fabric rather than raw materials, no wet treatment was performed.
The fabrics underwent a minimum of 48 h of mandatory relaxation under standard conditions with no pressure applied. After relaxation, prerequisite conditioning was performed based on the ASTM D1776 method. 11 The samples were conditioned in a room where the condition was controlled using an air conditioner. The temperature and relative humidity were checked using a wet and dry bulb hygrometer (Zeal England) placed in the room. All samples were placed freely on wooden shelves and were conditioned for greater than the minimum of 6 h. Conditioning for a more extended period of time was done as required by specific tests.
Measurement of Wale and Course Densities
Wales per cm (WPcm) and courses per cm (CPcm) of the samples were measured by using ASTM D8007-15(2019). For this purpose, a counting glass was used. 12 A counting glass contains a magnifying glass in one part and a rectangular scale at the bottom part. The length of each arm of the rectangle is 1 in. Any material put under this glass shows a 1 square inch area through the magnifying glass. The flattened fabric sample was placed under the scale and wales and courses per cm were counted by calculating the total number of loops in wale and course directions. The numbers were calculated within an inch in each direction, and then were converted to wales and courses per cm. Stitch density was also calculated by using WPcm and CPcm values. Stitch density is the total number of loops in a unit area of the fabric, 2 so it can be calculated using Eq. 1. 13

Measurement of Fabric Width
The fabric width of a weft knitted fabric is the fabric's length on course direction from one end to another. It was measured by using ASTM D3774- 2018 method for this experiment. 14 A measuring tape was used for measuring the width, and the final results were taken from ten values for each sample. The results were taken in cm.
Measurement of Fabric Thickness
Generally, fabrics in daily use are two-dimensional, which means the fabrics have length and width. Fabrics also have depth, but this is often ignored. This depth or height of fabric is termed fabric thickness. Fabric thickness affects warmth, heaviness, or stiffness. 15 For practical purposes, fabric thickness is very rarely used because it is very sensitive to applied pressure during testing. Protruding fibers and yarns can give the fabric a thicker shape, which may not show the fabric's true nature. So, in practice, the measurement using GSM is preferable. 15 In this study, testing was done according to ISO 5084 method using a Shirley Fabric Thickness Tester (Testex, Switzerland). 16 The area of the tester pressure foot was 2000 mm2. The fabric samples were placed under the pressure foot, and then pressure was applied to the fabric. The digital gauge placed above shows the fabric thickness value. The results are expressed in mm for this study.
Measurement of Fabric GSM
GSM of the fabric is also termed as areal density by many researchers. For test purposes, a 100 cm2 of fabric was cut and weighed, from which the GSM was calculated. The test was done according to the ASTM D3776M-09a (2017) test method for this study. 17 The samples were cut by a GSM cutter (James H. Heal, UK), which contains a blade beneath it. The cutter was placed on flattened and wrinkle-free fabric, and the samples were cut from different places for taking average results. The samples were weighed using an electronic balance.
Measurement of Fabric Pilling Resistance
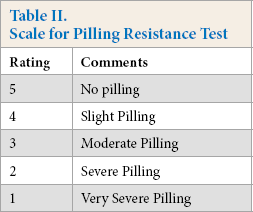
Pilling is the process of pill formation on fabric surfaces formed by twisting of protruding fibers. These pills cling on to the fabric surface for a long time and produce an unwanted surface appearance. 15 Protruding fibers form pills, but they are not found on the fabric surface from the beginning. Instead, these fibers come to the surface due to rubbing action on the fabric surface, which fabrics suffer in daily use, and those smaller and loose fibers are responsible for pill formation. Pills are formed mainly due to heavy wear, and is unavoidable. Thus, pilling resistance is one of the most crucial fabric properties because it is related to fabric aesthetics and comfort. Pilling was measured using the ASTM D4970M-16e3 test method with a Martindale Abrasion and Pilling Tester (SDL International Ltd., UK). 18 The tester contained two holders for two samples. The tester rubbed each and every point of the fabric samples by the same amount. The same fabric was used as an abradant. Amount of pill formation was measured after 125, 500, and 2000 rubbing cycles for all samples. The samples were then compared with standard photographs of rubbed samples for rating according to the standard. Rating was done using a 1 to 5 scale points, where an increase in grading number meant better pilling resistance. The scale is given Table II. 15
Scale for Pilling Resistance Test
Measurement of Fabric Bursting Strength
The bursting strength test is an alternative to the typical tensile test for measuring the tensile properties of a fabric. It is mainly done for more extensible non-woven fabrics, whereas a tensile strength test is done for woven fabrics. This test is essential for those types of fabrics that do not have a maximum or minimum strength in any specific direction in the fabric, unlike woven fabrics, which have maximum strength in the warp direction. 15 Testing is done by inflating the fabric by using a rubber diaphragm, which puts uniform stress on the fabric in all directions at the same time simultaneously. 15 The ISO 13938-1:2019 test method was used as the standard using a Hydraulic Bursting Strength Tester (Laboratory Supply Company Ltd., Germany). 19 The rubber diaphragm was inflated using compressed air. As a result, the mounted fabric sample on top of the diaphragm undergoes the same amount of expansion during the test. This added pressure bursts the fabric. The amount of pressure required to complete the action is the measure of the fabric's bursting strength. Tat pressure and required time for bursting the fabric was calculated by the machine for all samples.
Measurement of Water Vapor Transmission through Fabric
Water vapor permeability is the ability of material to let water vapor pass through it under the action of external forces like pressure between its two opposite faces. 20 It is important because the fabric's ability to let vapor pass through helps the wearer feel comfortable under sweaty conditions. The test was done according to ASTM E96M-16 21 by wrapping the mouth of a water-filled dish of a specific dimension with a fabric sample and then letting the dish stand for a specific time. The amount of water loss from the dish was calculated to determine the vapor transmission rate through the fabric. The dish was kept in a room under standard conditions (25 ± 2 °C and 65% relative humidity (RH)) during the procedure.
Measurement of Fabric Wicking Rate
A liquid can go through pores without the help of any external forces. When a water droplet enters into a pore, other droplets follow that droplet, which causes the water to spread. Most liquids have this behavior. This can cause transport of liquid by spreading through the fabric's pores to a larger surface area. This phenomenon is called capillarity or capillary action or wicking.22,23 This property was measured by a vertical wicking test according to the AATCC TM197-2018 standard. 24 The test procedure involved cutting fabric samples in the direction in which the wicking rate needs to be measured. The bottom part of the cut sample was submerged in liquid, while the top end was clamped so that the sample remained still and straight in a vertical direction. The liquid spread in an upward direction through the pores or gaps in between fabric yarns. After 5 min, the height of the rising level of liquid was measured to calculate the wicking rate. This test is a good indicator of fabric comfort because the wicking rate affects the spreading of body sweat in the fabric.
Measurement of Fabric Drying Rate
The fabric drying rate is the measure of the time required for drying under normal atmospheric conditions. The drying process is driven by evaporation of the liquid to the surroundings from the fabric. A better drying rate means the fabric will take less time to become dry from wet conditions. 22 It was measured using the AATCC TM201-2014 standard. 25 This method required a hot plate at 37 °C. A temperature-controlled heater containing a hot plate was used for this test. The hot plate had temperature controlling options ranging from 30 °C to 100 °C, while a thermometer (Zeal, UK) was used to keep the temperature within range. The process's principle is to determine the drying rate of the fabric samples at body (37 °C) temperature to simulate the drying of body sweat. The wet samples were placed on the plate, one at a time. The test was performed in an open environment.
Evaluation of Fabric Hand
Fabric hand is an indicator of fabric roughness to the touch.26,27 Fabric comfort is heavily dependent on this property. If the fabric is rough, then it becomes difficult for the wearer to feel comfortable. Fabric hand was evaluated according to AATCC EP5-2006. 28 Two recently trained personnel performed the evaluation. A facilitator worked with both of them. They compared the fabrics by taking the fabric containing only knit loops in the structure (sample 1) as the standard. Then, the other samples were evaluated in comparison to that sample. They used one hand to evaluate the fabrics. Both of them evaluated each sample five times separately, once every day, which gave ten results for each sample. All samples were assessed independently. The samples were rated as rough, medium rough, and rougher, but it was difficult to maintain this regimen with a large number of samples. Tat's why a scale from 1-5 was used, where the higher value indicated greater roughness. All samples were tested under the same conditions.
Results and Discussion
All tests were done according to the previously mentioned test procedures under standard conditions. The results were divided into two groups for all tests, as mentioned earlier. Standard deviations (SD%) for all experimental results were less than 5%.
Standard Fabric Specification Test Results
The standard fabric specification test results are quite difficult to maintain 100% accurately as fabric relaxation could unexpectedly cause changes in these specifications. The results were taken several times, and then the average values are shown in the resulting chart to ensure the least amount of error. The two sets of results are shown in Tables III and IV.
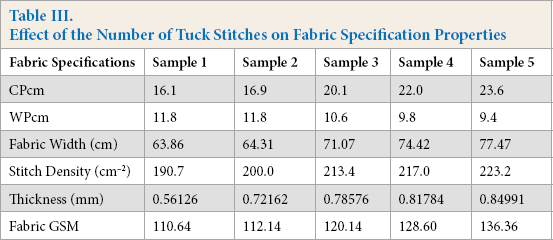
Effect of the Number of Tuck Stitches on Fabric Specification Properties
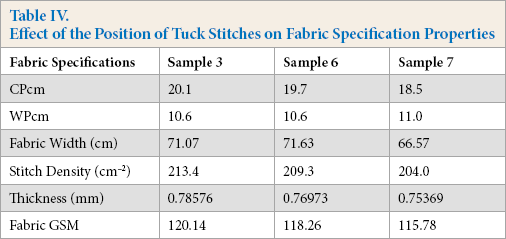
Effect of the Position of Tuck Stitches on Fabric Specification Properties
The results in Table III show that the increment of tuck stitches increased fabric width, stitch density, fabric thickness, and fabric GSM, which was consistent with previous research.5,29,30 The structure of the tuck stitch was mainly responsible for this. Tuck stitches contain knit loops and held loops. 1 Tuck stitches are formed by not clearing the old loop from the needle after a knitting cycle while catching a new yarn. Instead, both loops are kept in the latch of the needle; and then, when a course containing the knit loop arrives in the cycle, the held loop from the previous cycle is released, and due to being held in the needle for more than one knitting cycle, this loop is called held loop.1,2 This process produces a held loop, which has extended legs. Any loop created in knitting undergoes relaxation after being withdrawn from the machine, and generally, changes shape by expanding in a horizontal or vertical direction depending on the tension on the loops.1,3 Held loops also follow this process. Due to being held by the needle for more than one knitting cycle, the held loop withstands more tension than other loops, and it expands in a horizontal direction as the legs of this loop spread in both left and right directions, horizontally. In the studied fabrics, this phenomenon was responsible for bringing the courses closer, and it resulted in an increment in the number of courses per unit area or CPcm. On the other hand, the structure comparatively expanded in the width direction, which caused the wales to move away from each other a bit, resulting in a lower WPcm in the fabric. When a held loop was formed in the structure, it resulted in two loops at one place in the fabric instead of one. When tucking was continued for another course (sample 3, 4, and 5), which meant that there were two consecutive tuck stitches in two adjacent courses in the same wale, two held loops were formed with the last tuck loop, giving three loops at the same place. This made the fabric thicker. 31 These thick places resisted fabric contraction in the width direction because the wales could not come closer as they do in fabrics containing knit loops only, making the fabric wider. But still, the stitch density was greater because of the increment in CPcm with lower WPcm. An increment in CPcm took place because, when the held loop was drug on for another course and another held loop was formed in between, there was greater stretch and greater fabric contraction or shrinkage in the length direction. So, when the number of tuck stitches increased, it resulted in higher CPcm values, while WPcm values decreased. On the other hand, when two held loops were formed in adjacent wales instead of one in consecutive courses, two separate held loops were formed. The drag of two held loops together was a bit greater than two separate held loops. Also, two held loops together had three loops at one place, resulting in a greater thickness than separate held loops. The results of this study confirmed this trend. When just one tuck stitch was introduced, the effect was minimal, but it grew with the increased number of tuck stitches, especially in consecutive courses in the same wales. CPcm and thickness values increased just a small amount with just one tuck stitch, while WPcm values remained about the same. When the number of tuck stitches increased, the CPcm value increased at a higher rate than the WPcm value decreased, resulting in higher fabric stitch density.
Per the above-mentioned results, with a greater number of tuck stitches, the GSM increased as the amount of yarn increased within a unit area. 15 With decreasing WPcm values, the fabrics became wider. Another reason for the increment in fabric width was the dimensional stability of tuck stitches. Due to having two loops in one position, the loops became stiffer, resisting the wale from shrinking to a smaller dimension. Instead, due to being under high tension, the loops robbed yarns from adjacent loops and reduced the extensibility of those loops.2,5,30 This is why the fabric became not only wider, but also less extensible.
Table IV shows the effect of tuck stitch positions. All structures in this table contain two tuck stitches, but at different positions. In sample 3, the tuck stitches were in successive courses in the same wales. For sample 6, the tuck stitches were placed in two wales, but not in consecutive courses, as one course containing only knit loops separated the courses containing the tuck stitches at both ends. Sample 7 contained two tuck stitches in alternate wales in successive courses. Theoretically, sample 3 was expected to show the effect of tuck stitches more prominently, and this was the case. Having tuck stitches in the same wale for consecutive courses, that wale became thicker and resulted in slightly more shrinkage in the length direction, leading to the highest GSM value among these samples. Sample 7 also had tuck stitches in adjacent wales, but it also had two consecutive courses containing only knit stitches after the courses containing tuck stitches, reducing the tuck stitch's effect on the structure. Sample 6 gave very similar results to sample 3. However, it gave slightly lower stitch density, fabric thickness, and GSM values due to having two courses containing knit stitches only in between the courses containing tuck stitches. By not having the held loops in successive courses, the drag or shrinkage was less in samples 6 and 7. Also, due to not having two held loops in successive courses in the same wale, those samples didn't have thick points like sample 3, where three loops were found together. These factors resulted in lower GSM and thickness values in samples 6 and 7. Differences in results for samples 3 and 6 were very small, though, while sample 7 was only slightly greater. It means the position of tuck stitches had some effect on fabric structure. Those effects were still not as significant as the effect of the number of tuck stitches in the fabric structure, unless they were used in successive courses and in the same wale.
Pilling Resistance Test Results
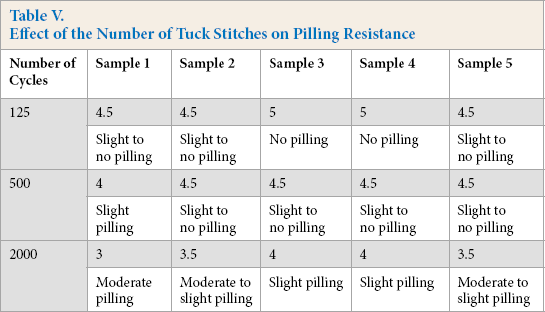
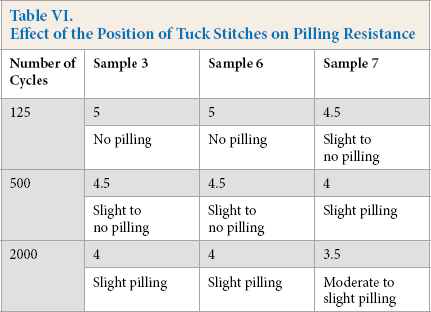
The samples underwent pilling resistance tests for 125, 500, and 2000 cycles. All fabrics were conditioned under the standard atmospheric conditions of the test method before testing. The test results are shown in Tables V and VI.
Effect of the Number of Tuck Stitches on Pilling Resistance
Effect of the Position of Tuck Stitches on Pilling Resistance
Fabric pilling resistance depends on the fabrics yarn density, the twist of the yarn, the compactness of yarn, and other factors. 30 Compact structures show less tendency for pill formation because compactness increases cohesion among the fibers in the yarn and the yarns in the fabric.8,32,33 The pilling resistance was expected to be greater when the fabric became more compact.
Two observations were made from the results of this study. The pilling resistance was nearly similar for two cases; the first one was when there were no tuck stitches. It made the structure compact and extensible due to shrinkage during relaxation, but the yarn density was less than other samples. And with less yarn density, it could not withstand the rubbing for long; the pilling resistance decreased more than other samples after 2000 cycles of rubbing. Pilling resistance improved slightly and gradually with the increasing number of tuck stitches in the structure, but when four tuck stitches were introduced (sample 5), another result was found. Sample 5 was slightly vulnerable to rubbing due to the involvement of more yarn in rubbing action due to very high yarn density, causing slightly worse pilling in sample 5 than in other samples.
Changing the position of tuck stitches did not have much impact as the results were similar for all samples. This was perhaps due to the structure having two tuck stitches in successive courses but at alternative wales, as well as two courses of knit loops only. Due to having only one tuck stitch in a wale, the held loop was extended for only one course, which could neither match the drag of further extended held loops (sample 3), nor the shrinking ability of the structure having fully knitted courses (sample 6) in between the courses containing tuck stitches. This is why sample 7 shrunk neither in the length direction like the other two samples, nor in the width direction as in sample 1. It remained as a slightly loose structure that became more vulnerable to rubbing.
Bursting Strength Test Results
Bursting strength was measured on all samples under standard conditions. The machine was calibrated before the test. The results are shown in Figs. 2 and 3.
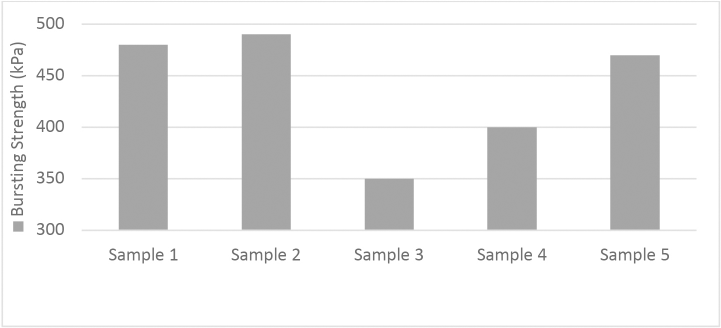
Effect of the number of tuck stitches on bursting strength.
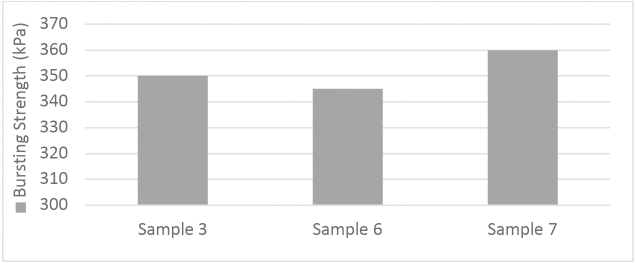
Effect of the position of tuck stitches on bursting strength.
Theoretically, fabric bursting strength depends heavily on yarn density, fabric GSM, and fabric extensibility. Fabrics with higher yarn density, GSM, and extensibility show better bursting strength.30,34-36 When a fabric has high yarn density and GSM, there would be a greater number of yarns to withstand the pressure during testing, helping to distribute the pressure on a greater number of yarns. Fabrics with greater extensibility also show better bursting strength because the pressure during testing would have to overcome the extension before putting pressure leading to bursting on the fabric yarns.5,15,29 In this study, the increment of the number of tuck stitches resulted in an increment of stitch density in the fabric and fabric GSM. Extensibility was expected to be at a maximum in sample 1 due to having knit loops only, while it was expected to be least in sample 5 due to having the most number of tuck loops. 29 This was confirmed by the results of the current study. The bursting strength increased slightly in sample 2 from sample 1 because the extensible structure of sample 1 had more stability due to the addition of one tuck stitch, with the stitch density increasing as well. However, in sample 3, the bursting strength decreased significantly due to the reduction of the sample's extensibility, which had a more significant effect than stitch density and fabric GSM. The bursting strength increased again as the stitch density and fabric GSM increased significantly in these samples. The impact of these two factors overcame the reduction in fabric extensibility.
In another comparison, the tuck stitch's position had some effect on bursting strength, as shown in Fig. 3. Sample 6 was found to have the least strength, followed by sample 3 and then sample 7. Stitch density and fabric GSM were nearly similar in these samples, with sample 3 > sample 6 > sample 7. Comparing samples 3 and 6, sample 3 showed slightly better performance due to having more yarn density and GSM than sample 6. Sample 3 was slightly bulkier due to having extended held loops. It was also a little more extensible in the length direction than samples 6 and 7 due to having two tuck stitches in successive courses, which resulted in more contraction in the length direction as discussed previously. On the other hand, sample 7 was slightly more extensible in the width direction due to having a greater WPcm value than the other two samples (the reasons behind this were discussed previously). This gave sample 7 a slightly greater bursting strength than the other two samples. In contrast, sample 3 showed better results than sample 6 due to having slightly greater yarn density and extensibility in the length direction (and because it had a somewhat greater CPcm value than sample 6).
Evaluation of Fabric Hand
Selected evaluators evaluated fabric hand. The samples for this test were kept under standard conditions before testing. According to a predetermined scale of 1-5, the evaluation was performed. The higher the value, the rougher the surface. The results are shown in Tables VII and VIII.
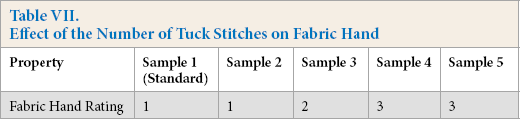
Effect of the Number of Tuck Stitches on Fabric Hand
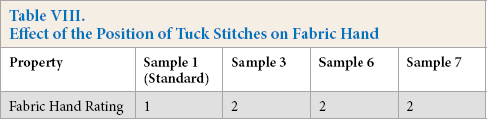
Effect of the Position of Tuck Stitches on Fabric Hand
Here, sample 1 was taken as the standard, having the smoothest surface. Theoretically, fabric hand depends on various factors, including flexibility, extensibility, density, GSM, and the frictional property of the surface according to ASTM D123-2003.10,37 The evaluation was performed by considering the sensory factors. 27 The introduction of tuck stitches produced a thick place in the area where more than one loop was created in one place.
Fabric hand depends heavily on the quality of the fabric surface. The surfaces of sample 1 and sample 5 are shown in Fig. 4. These two samples were selected because sample 1 had no tuck stitches, while sample 5 had the maximum number of tuck stitches in the structure. The figure shows the effect of tuck stitching on the fabric surface.
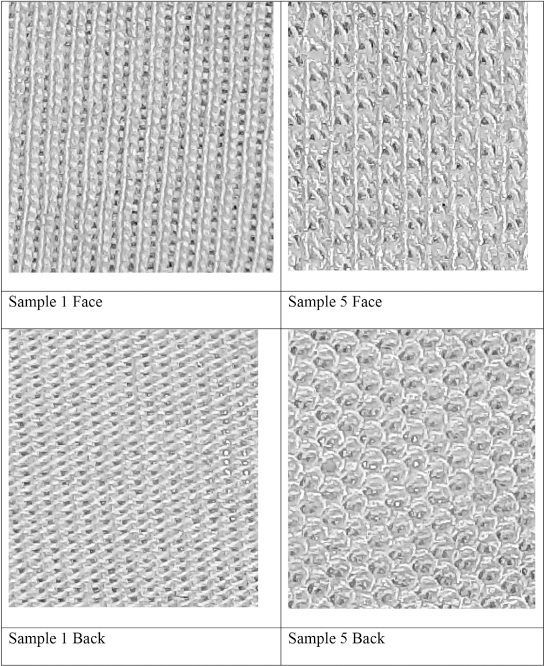
Face and back of samples 1 and 5.
Fig. 4 shows that the maximum number of tuck loops contained in sample 5 had a wider vertical wales line distribution on the face side than sample 1, the latter having no tuck loops in its structure. On the back side of sample 5, voids were produced due to having tuck loops and held loops in the structure.
Tuck stitches made the fabrics thicker with less extensibility due to accommodating a greater amount of yarns (two in the tuck loop in a single course and three in the case of tuck loop in two consecutive courses) in the structure. It made the fabric wider, and widthwise shrinkage could not take place in these cases. This created a very thin vertical shaped gap between two wales where one wale contained a tuck loop and a held loop, while the other contained only knit loops. The heads of these loops created the opening. When two tuck loops were created in consecutive courses in the same wale, the gap became more expansive. This occurred due to accommodating the heads of two held loops and a tuck loop at the same place where only the head of a single knit loop was found in the case of wales containing only knit loops. This structure made the fabrics wider. But shrinkage took place in these fabrics as well, taking place in the length direction where the held loops brought the courses much closer than for the knit loops by their legs. It even made the courses overlap each other slightly, which resulted in a comparatively thicker and heavier fabric. The tuck loops also contributed to roughness. The wales containing held loops and tuck loops were comparatively thicker than wales containing knit loops only. So, the thickness of adjacent wales differed from each other due to tuck stitches. This structure made the surface slightly uneven, and as a result, the fabrics became a little rougher. Again, when held loops were created, a void was created in the course where the held loop started (can be seen from back side of the fabric) because a knit loop would have its head and legs in that course.
In contrast, a held loop could only have its extended legs in that course, and the head was found in the next or later course where the loop was cleared through a newly formed knit loop. The extended legs of held loops were also responsible for giving a slightly fuller shape to those wales, which affected both fabric thickness and roughness. All these effects made the fabrics slightly rougher than fabrics containing only knit loops.
So, the increment of the number of tuck stitches gradually made the fabrics rougher. This is why the hand rating went up with an increased number of tuck stitches in the fabric. Sample 2 felt almost like sample 1 though, due to having just one tuck stitch in the structure. In sample 5, the greater amount of tuck stitches made the fabric more rigid and wider, the least flexible, and rougher. On the other hand, when the tuck stitch's position was changed, as shown in Table VIII, the results were all the same, except that sample 7 was slightly different, although negligible. The extensibility and effect of tuck stitches on fabric structure were affected slightly in those structures, but in the case of fabric hand, the difference in results could not be discerned.
Water Vapor Transmission Test Results
Water vapor transmission rate through the fabrics was calculated under standard conditions, as stated in the test procedure. The results are shown in Figs. 5 and 6.
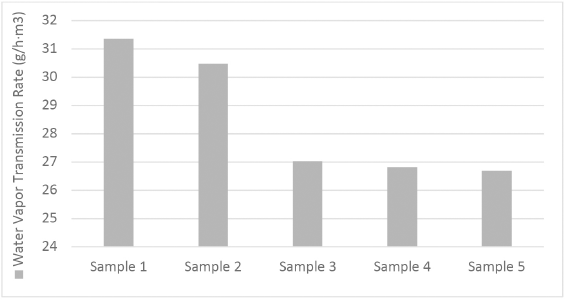
Effect of the number of tuck stitches on water vapor transmission rate.
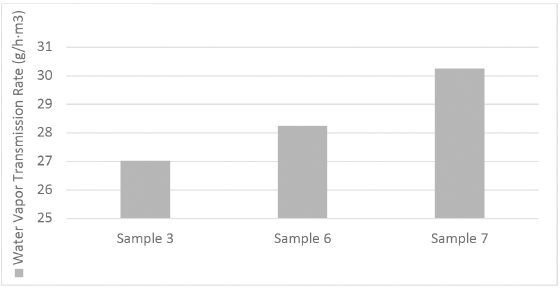
Effect of the position of tuck stitches on water vapor transmission rate.
Water vapor transmission through a fabric affects the physiological comfort of a fabric. 38 This property depends on heat transferability, air permeability, and the amount and size of pores in the fabric structure.20,39 This property is heavily affected by the fabric's raw material, but since all samples were made by using the same cotton yarn, this factor was not considered for this study. The same holds true for the heat transferring ability of the fabric, therefore, the only factor considered here was the number of pores in the fabric structure.
Porosity depends on yarn density, fabric GSM, and fabric structure, among other factors.5,40,41 When the fabric became denser, the porosity decreased, reducing the amount of air passing through the fabric. But when tuck stitches were included, pores were created. When there are pores, air can pass through the fabric with relative ease.5,9 Since air is an excellent insulator, the pores helped to give the fabric better thermal insulation properties as these pores could retain air. But due to increased fabric thickness resulting from an increased number of tuck stitches, the air circulation decreased, restricting water evaporation and water passing through the fabric, as shown by the results. So, even though the increment in the number of tuck stitches increased the porosity, the fabrics become heavier with tuck stitches, resulting in a decreased water vapor transmission rate due to a loss of fabric heat transferring ability. In addition, tuck stitches made the fabrics rougher. The rough surface was better suited to holding air and improving the fabric's insulating property, which might have played a role in their lower water vapor transmission rate.8,42 On the other hand, the second comparison shown in Fig. 6 among fabrics containing the same number of tuck stitches at various positions showed that sample 7 had the lowest stitch density. It also had the least number of pores while also having the lowest fabric GSM and thickness among those samples. As a result, sample 7 had a greater water vapor transmission rate as expected, while the difference between samples 3 and 6 was almost negligible.
Wicking and Drying Rate Test Results
The wicking test was done using a direct dye solution, while the drying test was done using a hot plate. All samples were conditioned according to the standard. The results are shown in Figs. 7 and 8.
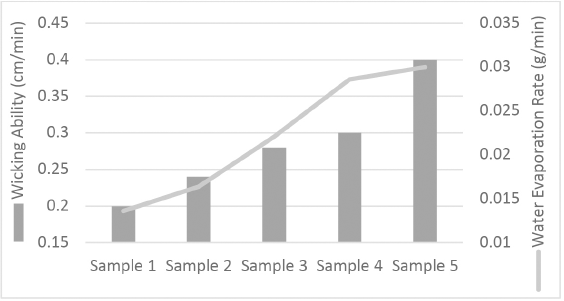
Effect of the number of tuck stitches on wicking and drying rate.
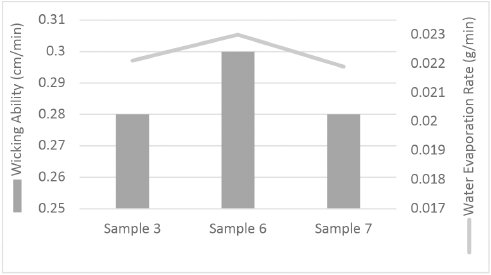
Effect of the position of tuck stitches on wicking and drying rate.
The wicking rate of a fabric depends on various factors, such as capillary pore distribution and pathways. 43 Double jersey rib fabrics are known for better wicking properties because they have a capillary path in the wales-wise direction called the ribbed effect. 22 Tuck stitches also form a slight ribbed effect in the fabric as the fabrics show more wales prominence as a result.5,44 On the other hand, the drying rate is also helped by a greater wicking rate as the liquid absorbed by the fabric is quickly spread over larger areas in the fabric.43,45
Evaporation of a liquid from a larger area of fabric is more manageable than from smaller areas for the same amount of liquid. Therefore, the increment of tuck stitches in the structure was expected to result in an improved wicking and drying rate in the fabric, and this was confirmed by the present study. When tuck stitches were introduced to the structure, having more than one loop in the same spot made that place a little thicker, which created vertical lines in the wales direction. When the effect was made more prominent by using more tuck stitches, thick lines were created, and in between the lines, a capillary pathway was formed as well. Sample 5 had the most regular shaped lines, and the wicking and drying rate was greatest for that structure. Also, due to the high stitch density created by the tuck stitches, the yarns came closer together. This helped to quickly absorb and transfer water from one yarn to the other, while structures containing fewer tuck stitches did not. 8
On the other hand, sample 6 showed better wicking and drying properties than samples 3 and 7. When comparing Samples 3 and 6, both had similar yarn density, but sample 3 had a slightly greater yarn density and GSM, with identical WPcm values. The liquid had similar types of vertical gaps, but in sample 3, the liquid had to go through slightly more yarns than sample 6. This is why sample 6 had better wicking and drying properties. Between samples 3 and 7, the difference in wicking and drying rates was almost non-existent, even though sample 7 was expected to show better performance, according to the previously mentioned concept. This occurred because sample 7's yarn density was less than sample 3, which could improve the wicking and drying rate. However, sample 3 had more capillary gaps in between wales, with a lower WPcm value. These slightly more significant capillary gaps allowed the wicking and drying of the fabric. On the other hand, sample 7 had a lower CPcm value than sample 3 due to previously described structural effects. This provided a slightly smaller amount of yarn for the liquid to go through. But having a greater WPcm value actually nullified the advantage of having a smaller amount of yarn in the structure and made the results between the two structures almost similar.
Conclusion
This study was done to determine the effect of tuck stitch on some common physical properties of single jersey weft cotton knit fabrics. Along with some very common properties like fabric GSM, fabric width, and bursting strength, their fabric comfort properties were also studied, including pilling properties, water vapor transmission rate, wicking and drying rates, and fabric hand. The results showed that the number of tuck stitches in the fabric structure increased the yarn density, fabric GSM, fabric width, fabric roughness and wicking, and drying rate, while the pilling properties were slightly improved. The water vapor transmission rate decreased accordingly. On the other hand, the tuck stitch's position had a slight effect, but not as significant as the number of tuck stitches. Having a fewer number of courses of full knit stitches in consecutive sequence helped in matching the above trend, while having a tuck stitch in all wales of the fabric also helped in matching that trend. Therefore from this study, the number of tuck stitches in the fabric structure had a significant effect on fabric properties. However, this study was performed using structures containing only four courses and two wales in the repeating unit, which is a relatively small number. More research should use larger repeating units of the fabric structure. Additional tests should be performed to establish a standard, especially fabric comfort-related tests. Garments made from these fabrics should be tested as well.
Wet treatments were not used here to focus on the effect of greige fabric structure only. Otherwise, the test results of water vapor transmission, wicking, drying, and others would differ from the results found in this study. To summarize, the introduction of tuck stitches in the greige fabric structure had some significant effects on the physical properties of the fabrics according to the test results in this study.