
Abstract
Durable press (DP) finishing process of cotton fabric with 1,2,3,4-butanetetracarboxylic acid (BTCA) was investigated and optimized using the Box-Behnken design (BBD) with a response surface methodology (RSM). BBD experimental data were fitted to create the response surface regression models describing wrinkle recovery angle (WRA) and breaking strength of the finished cotton fabric. Analysis of variance (ANOVA) revealed that the concentration of BTCA was the most significant variable affecting the WRA, followed by the curing time, curing temperature, and concentration of sodium hypophosphite (SHP). Regarding breaking strength, curing time was the most significant variable, followed by the curing temperature, concentration of BTCA, and concentration of SHP. After optimal treatment, the WRA of the finished fabric was 252°, while the retention rate of breaking strength was 69%.
Introduction
Cotton is one of the natural textile materials with a long history and of wide application. It has many excellent properties, such as soft handle, good absorbency, and permeability. However, cotton fabrics are vulnerable to wrinkling and deformation due to the external forces in the process of wearing and washing, which affects the beauty of the fabrics and its convenience to consumers. Therefore, it is of great importance to provide cotton fabrics with anti-wrinkling properties by using durable press (DP) finishing to obtain the desired properties.
DP properties could be imparted to a cellulosic fabric through the formation of crosslinks between the adjacent cellulose chains.1,2 Traditional resin crosslinking agents, such as N-methylol regents and their derivatives, had long served as industrial DP finishing agents for cotton fabrics.3,4 However, fabrics treated with resin agents have the drawback of releasing carcinogenic formaldehyde, which endangers human health, so it can't be used in close fitting and children's clothing. To protect individuals from the release of formaldehyde, great efforts were made to replace the traditional resin with non-formaldehyde agents.
In recent years, formaldehyde-free polycarboxylic acids have attracted a great deal of attention. Research has shown that polycarboxylic acids, particularly 1,2,3,4- butanetetra-carboxylic acid (BTCA), can allow the finished fabrics to meet the requirements of the DP performance and washing durability.5,6 BTCA is considered to be the most promising non-formaldehyde crosslinking agent for cotton fabrics.3,7 According to Šauperl et al., 8 polycarboxylic acids can form stable crosslinks in cotton fabrics when certain salts (e.g., sodium hypophosphite (SHP)) are used as catalysts.4,9 The reaction mechanisms are proposed in Fig. 1.
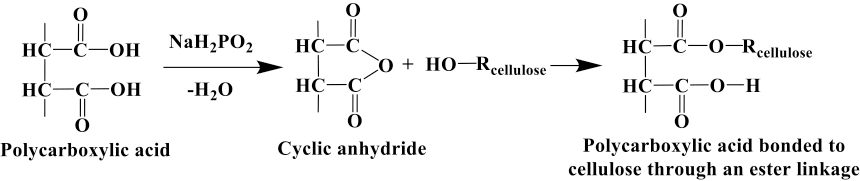
Mechanism of grafting reaction between polycarboxylic acids and cellulose.
Polycarboxylic acids are prepared in two steps to crosslink with the cellulose. In the first step, a five-membered cyclic anhydride intermediate was formed by the dehydration of two adjacent carboxyl groups at an elevated temperature. In the second step, the ester linkage was formed through the reaction between the cellulose hydroxyl and anhydride intermediate. The ester crosslinks were formed by the multiple ester linkages, which can restrict the molecular movement of the cellulose and impart DP's properties to the fabric. 3 In spite of this favorable performance, fabrics treated with BTCA lose considerable strength, resulting in poor industrial applications. In addition, the high cost of BTCA is also a factor. To reduce the cost and to improve the strength of the BTCA finished fabric, researchers often mix other poly-carboxylic acid with BTCA, such as citric acid, malic acid, or tartaric acid, to solve this problem.10–12
There have been many studies on the DP finishing of poly-carboxylic acids, most of which are focused on the finishing process and reaction mechanism. For example, Orhan et al. 13 combined the BTCA, Ca, and an antibacterial agent to obtain an antibacterial-DP finishing agent. Kim et al. 14 used maleic acid and BTCA to finish cotton fabric. The effects of catalyst concentration, pH value of finishing solution, and curing temperature on the degree of crosslinking was analyzed. Schramm et al. 15 systematically studied the washing fastness of cotton fabric finished with BTCA in different washing environments. Lam et al. 16 treated the cotton fabric with nano titanium dioxide and then treated it with BTCA, which produced fabric with anti-UV and DP properties. Conventionally, these studies were carried out using a single factor experimental method, which cannot describe the interaction between factors in depth.
Response surface methodology (RSM) is a powerful tool for quantifying the relationship between the design variables and responses, and thus can be used to evaluate the main and interactive effects of design variables on the process performance. Box-Behnken design (BBD) is the most commonly used type of RSM, in which each design variable has three levels permitting the design to generate sufficient data to ft a response surface regression model. BBD has been successfully used in analytical chemistry, chemical engineering, and other fields.
In this study, the DP-finishing process of BTCA was optimized and investigated using RSM. Based on this method, the effect of finishing parameters like BTCA and SHP concentration, curing temperature, and curing time was investigated on the wrinkle recovery angle (WRA) and the breaking strength. The model was used to analyze the interaction between the factors and to optimize the finishing process. Application of the model may reduce the workload and improve the value of the experiment.
Experimental
Materials
The materials used in this study were desized, scoured, bleached, and mercerized cotton plain woven fabrics (weight: 140 g/m2, warp density: 52.4 ends/cm, weft density: 28.3 picks/cm, yarn count: 14.75 tex × 14.76 tex), which were supplied by Weifang Qirong Textile Co. Ltd. Other chemicals were chemically pure. BTCA and SHP were obtained from China National Pharmaceutical Group Co. Ltd., Shanghai, China. DA-26 silicon oil (solid content: 40%) was used as a fabric softener and purchased from Shanghai Xingzhou Chemical Industry Co. Ltd., Shanghai, China. All chemicals were used as received unless otherwise stated.
Fabric Treatment
The fabrics were finished by the pad-dry-cure method. The finishing solution contained BTCA and SHP, as well as 20 g/L of the DA-26 silicon oil. The sample was impregnated with the solution and padded with a laboratory padder with two dips and two nips. The wet pickup of the padded sample was approximately 80%. Padded samples were dried at 100 °C for 2 min, and then cured at a desired temperature for a certain period of time. Then, the cured fabrics were rinsed with water at 50 °C for 30 min to remove any unreacted agents, and dried at 80 °C for 5 min. Finally, the fabrics were conditioned at 21 ± 1 °C and 65 ± 5% relative humidity (RH) for 24 h before any further treatment.
Measurements
Determination of Wrinkle Recovery
The wrinkle recovery angle (WRA) of finished fabric was measured on an LFY-1 fabric wrinkle recovery tester (Shandong Textile Science Research Institute) according to AATCC TM66-2003. 17 Each sample was measured twelve times in both warp and weft directions to obtain the average value.1,18
Breaking Strength
The breaking strength was measured using a YG026 electronic fabric strength tester (Laizhou Yuanjun Electronic Instrument Co. Ltd.) according to the ASTM D5035-11. 19 The loss of the weft strength of the finished fabric is normally greater than that of the warp strength.20,21 All measurements were performed in the weft direction only and calculated using Eq. 1.

Rb is the breaking strength (N) of the finished fabric and Ra is the breaking strength (N) of the fabric before finishing.
RSM Experimental Design
This article aims to develop a two-dimensional numerical model for investigation and optimization of the cotton fabric DP-finishing process with BTCA. Generally, a regression equation may be calculated by using the RSM and the model was conveyed as Eq. 2. 22

y is the response value, xi and x are various operating variables, k is the number of variables; β0, β, βii, and βi (i = 0, 1, 2, … k; j = 0, 1, 2, … k) are the regression coefficients of the intercept, linear, quadratic and interaction terms, respectively, and ∑ is the statistical error. 23
The relationship between the actual and coded values is defined by Eq. 3.
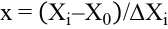
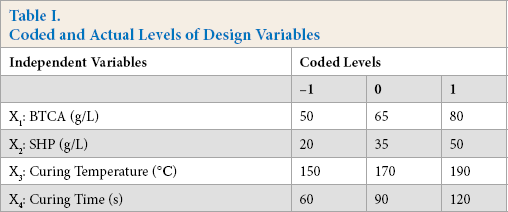
x was a coded value of the variable, Xi was the real value of the independent variable, X0 was the real value of an independent variable at the central point, and ΔXi was the step change value. In the optimization procedure, WRA and the breaking strength were selected as the responses, while four operating parameters, including concentration of BTCA (X1), concentration of SHP (X2), curing temperature (X3), and curing time (X4), were chosen as the variable factors. According to the actual finishing process, the effective domains of the four factors were determined. The four-factor and three-level experimental matrix shown in Table I was designed and generated by the BBD using the Design Expert 8.0.6 (Stat-Ease Inc., USA) software.
Coded and Actual Levels of Design Variables
Results and Discussion
RSM Experimental Results
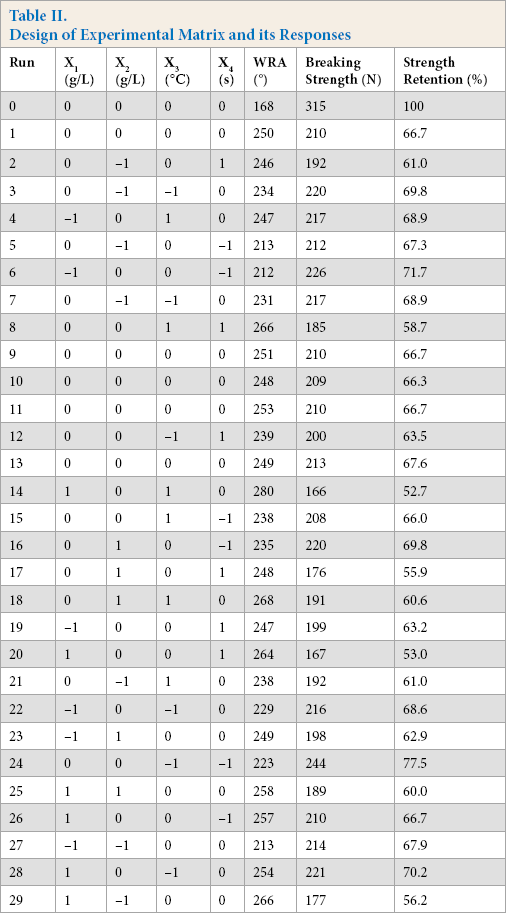
According to the design matrix arranged by the BBD, the experimental design and results of the BBD response surface are shown in Table II. The first column of the table shows the number of conducted experiments. The next four columns represent the actual conditions of the runs, while the last three columns represent the results of the experiments. The total number of conducted experiments was 29, including 25 factorial points (coded as -1 or +1) and four replicates in the central point (coded as 0). The four replicates at the central point were used to estimate the pure error. 24 Each experiment was performed randomly according to the run number to minimize the effect of the various sources of error on treatment results. The response variable was monitored by measuring the WRA and breaking strength of the finished cotton fabric.
Design of Experimental Matrix and its Responses
Analysis of Variance
Analysis of variance (ANOVA) was performed to assess the significance and adequacy of the regression models.22,24,25 The ANOVA results for the regression model of the WRA and breaking strength are shown in Table III.
ANOVA Results of Regression Model
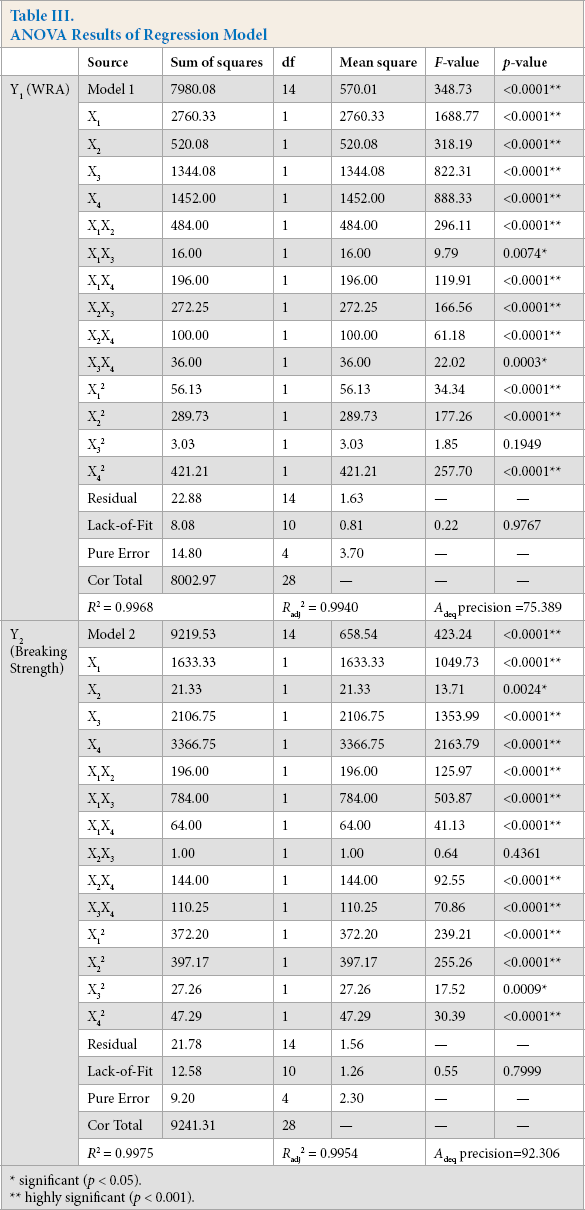
significant (p < 0.05).
highly significant (p < 0.001).
The lower p-value combined with the greater F-value of the variable indicated the greater influence of the factor on the model. 26 The model terms with p-values less than 0.05 were retained in the regression model because they were statistically significant at 95% confidence levels.27,28 The model terms with p-values less than 0.0001 indicated that the variable had a great significant effect on the model.27,28 The correlation coefficient (R 2 ) and signal-to-noise (S/N) ratio reflect the accuracy of the model.29,30 The correlation coefficient of the model must be greater than 0.90, and the S/N ratio must be greater than 4 before it can be accepted. 31
The regression model of the WRA was found to have a p-value less than 0.0001, indicating that the model was significant. According to the p-value size, the linear terms X1, X2, X3, and X4, the quadratic terms X1 2 , X2 2 , and X4 2 , and the interaction terms X1X2, X1X3, X1X4, X2X3, X2X4, and X3X4 showed the significant effects on the WRA. Other terms such as X3 2 showed a minor influence on the WRA due to the higher p-values. According to the F-value, 25 the concentration of BTCA (X1) was the most significant variable affecting the WRA of the finished fabric, followed by the curing time (X4), the curing temperature (X3), and the concentration of the SHP (X2). The rationality of the model can be further tested by the correlation coefficient (R 2 ), the adjusted correlation coefficient (Radj 2 ), the predicted correlation coefficient, (Rpred 2 ), and the S/N ratio of the model. A high value of R 2 (0.9968) indicated that the predicted model was rational and only 0.32% of the experimental data were not in agreement with the predicted values. The value of Rpred 2 (0.9909) was close to that of the Radj 2 (0.9940), and the S/N ratio (75.389) of the model was much greater than 4. All of these factors indicated that the regression model was reliable. In addition, the lack-of-ft's p-value for the model was found to be 0.9767, which exceeded the 0.05 threshold value, indicating that the lack-of-fit of the model was insignificant.
Similarly, the regression model of the breaking strength was found to have a p-value less than 0.0001, indicating that the model was significant. The linear terms X1, X2, X3, and X4, the quadratic terms X1 2 , X2 2 , X3 2 , and X4 2 , and the interaction terms X1X2, X1X3, X1X4, X2X4, and X3X4 showed significant effects on the breaking strength. Other terms, such as X2X3, might be considered to have minor influence on the breaking strength due to the higher p-values. According to the F-value, the curing time (X4) was the most significant variable affecting the breaking strength of finished fabric, followed by the curing temperature (X3), the concentration of BTCA (X1), and the concentration of SHP (X2). A high value of R 2 (0.9975) indicates that the predicted model was rational, while only 0.25% of the experimental data were not in agreement with the predicted values. Moreover, the value of Rpred 2 (0.9908) was close to that of the Radj 2 (0.9954), and the S/N ratio (92.306) of the model was much greater than 4. The lack-off t's p-value for the model was found to be 0.7999, which exceeded the 0.05 threshold value. All these results indicated that the regression model of breaking strength was fully reasonable.
Based on the presented results, it can be concluded that two regression models could be applied for prediction of the WRA and breaking strength of the DP-finished cotton fabric with the BTCA. According to the results of ANOVA, the significant terms are retained and the insignificant terms are excluded. The accurate models which describe the relationship between the coded levels of design variables and responses are given in Eqs. 4 and 5.
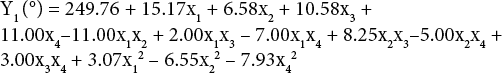
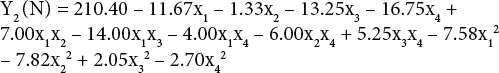
It also can be seen from Eqs. 4 and 5 that increasing the WRA of finished fabric will inevitably be accompanied by decreased breaking strength.
Analysis of Regression Formula
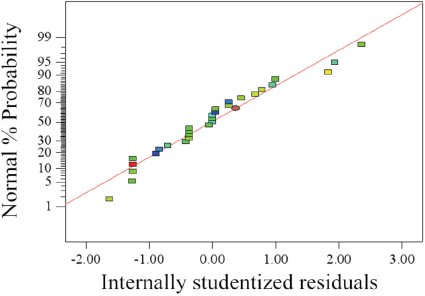
The normal probability plot of the WRA model is shown in Fig. 2, while the breaking strength is shown in Fig. 3. The normal probability plot was almost distributed along a straight line. Virtually all of the internal residuals were approximately near zero, which demonstrated that model was suitable.
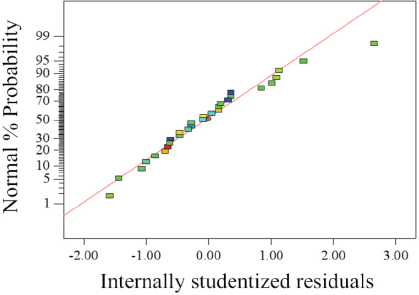
Normal probability plot of residuals for WRA.
Normal probability plot of residuals for breaking strength.
The relationship between the actual results obtained experimentally and the predicted values derived from the regression model of the WRA and weft strength are separately illustrated in Figs. 4 and 5. These graphs indicate that the model matched quite well with the experimental data, because the error between the actual results and the predicted values was negligible.
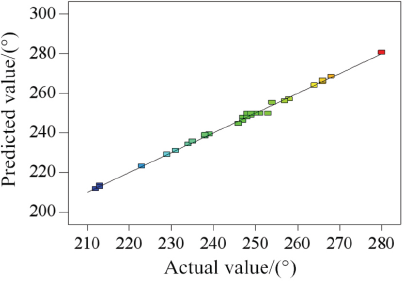
Comparison between the predicted values and actual values for WRA.
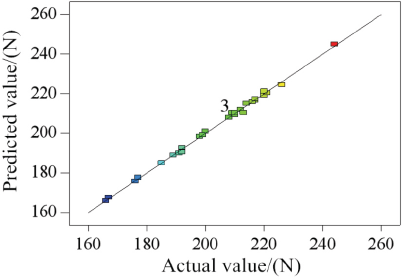
Comparison between the predicted values and actual values for breaking strength.
Verification of the Optimized Parameters
In the above model, although the WRA and breaking strength might be respectively optimized to the corresponding target value, the two response values cannot be improved at the same time. To achieve higher WRA values and retain a higher breaking strength of the finished fabric, optimal finishing parameters with the desirability of 1.000 were obtained by taking the WRA of 255° and the breaking strength of 210 N as response values based on the actual demand: BTCA of 73 g/L, SHP of 38 g/L, and curing at 167 °C for 83 s. Confirmation experiments were carried out and the testing results of the WRA and breaking strength under this finishing process were 252° and 217 N, respectively. The strength retention rate was 69%. The actual value was close to the predicted value, which suggested that the model could be used in actual production.
Effect of Interaction between BTCA and SHP Concentrations
The interaction effects between the concentration of BTCA and that of SHP on the WRA and the breaking strength are separately shown in Figs. 6 and 7.
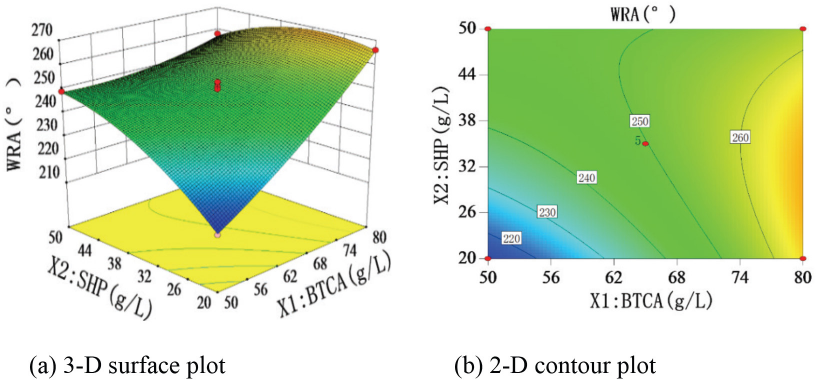
Effect of concentration of BTCA and SHP on WRA. Other variables take place at zero coded level (X3 = 170 °C, X4 = 90 s).
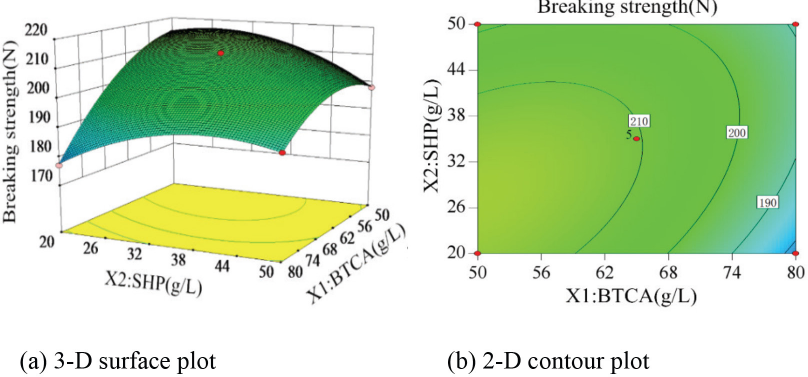
Effect of concentration of BTCA and SHP on the breaking strength. Other variables take place at zero coded level (X3 = 170 °C, X4 = 90 s).
Fig. 6 shows that WRA values increased with increased BTCA concentration. It is speculated that the increased BTCA concentration promotes more extensive crosslinking of the finished fabrics. There was also a steady increase in the concentration of SHP in the concentration range of BTCA from 50 g/L to 70 g/L. SHP is an alkalescent cross-linking catalyst, which can promote the formation of cyclic anhydrides from the BTCA, thus accelerating the esterification between anhydrides and cellulose.20,32 However, at high BTCA concentrations, the increase in the SHP concentration had little effect on increased WRA values. On the contrary, excessive SHP concentrations led to inadequate acidity of the finishing solution, which hindered the crosslinking reaction and reduced the WRA value.
Fig. 7 shows that breaking strength decreased as the BTCA concentration increased. BTCA is a strong acid, and the pH value of the finishing solution was about 1–2. 18 Under acidic conditions, cotton fibers undergo irreversible catalytic depolymerization, resulting in a major decrease in the breaking strength. At the same time, the increase in the crosslinking degree of the fabrics will also lead to the decrease in the breaking strength. As we know, cellulose molecules can crosslink with the carboxylic acids containing three or more carboxylic groups, 9 A molecule of BTCA has four carboxyl groups, which can form at most three ester linkages by esterifying and crosslinking with the cellulose. Therefore, the higher the BTCA concentration, the lower the breaking strength of the finished fabrics. In addition, it can be seen from Fig. 7 that SHP (weakly alkaline) had a certain protective effect on the breaking strength of the finished fabrics, but this protective effect was weaker than the acidolysis of finished fabrics by the finishing solution.
Effect of Interaction between Curing Time and Curing Temperature
The interaction effects between curing time and curing temperature on the WRA and the breaking strength is separately shown in Figs. 8 and 9.
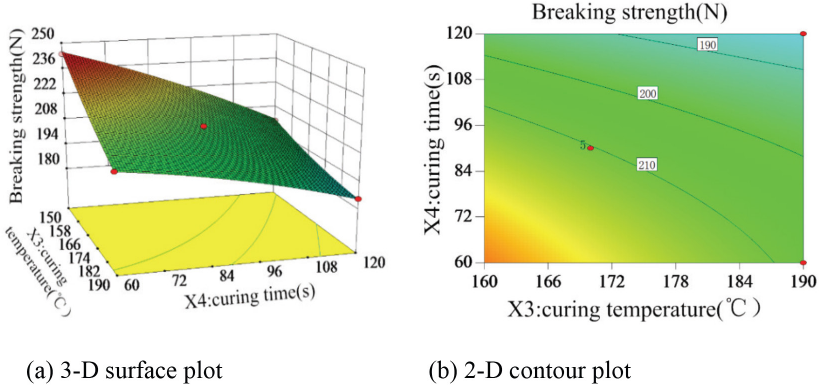
Effect of curing temperature and curing time on the breaking strength. Other variables take place at zero coded level (X1 = 70 g/L, X2 = 35 g/L).
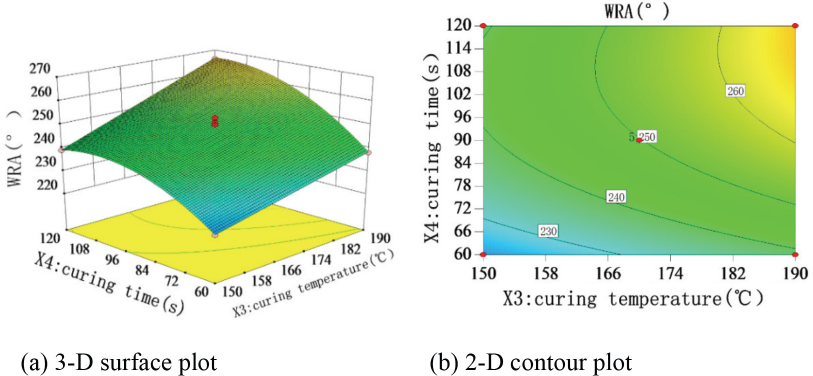
Effect of the curing temperature and curing time on the WRA. Other variables take place at zero coded level (X1 = 70 g/L, X2 = 35 g/L
Fig. 8 shows that the breaking strength of the finished fabrics decreased with increased curing temperature and time. It was speculated that higher curing temperature and time would promote the acidification and brittleness of the fibers. Fig. 9 shows that WRA values of the finished fabrics increased with increased curing temperature and time. It was speculated that the increased curing temperature and time promoted a higher degree of crosslinking between BTCA and fibers. The contour distribution density in the 2-D contour plot shows that the influence of the curing time on finishing effect was more intense than that of the curing temperature, which was consistent with the obtained ANOVA results.
Conclusion
BBD combined with RSM was used for investigating and optimizing the DP-finishing process of cotton fabrics with BTCA. The BBD experimental data were fitted to create the regression models, which successfully described the WRA and breaking strength of the finished cotton fabric. The ANOVA for the regression model revealed that the concentration of BTCA was the most significant variable affecting the WRA, followed by the curing time, the curing temperature, and the concentration of SHP. The curing time was the most significant variable affecting the breaking strength, followed by the curing temperature, the concentration of BTCA, and the concentration of SHP. The optimal finishing conditions were as follows: BTCA of 73 g/L, SHP of 38 g/L, and curing at 167 °C for 83 s. The WRA of the finished fabric was 252° and the retention rate of breaking strength was 69%.