
Abstract
Mixture design method of experiments was used to determine the compositions of wood-plastic composite samples manufactured from recycled polypropylene (rPP), rubberwood flour (RWF), and calcium carbonate (CC). Factors were determined the mixture compositions rPP, RWF, CC, maleic anhydride-grafted polypropylene (MAPP), ultraviolet (UV) stabilizer, and lubricant (Lub) on properties of the samples, namely tension, compression, surface roughness, water absorption (WA), thickness swelling (TS), and thermogravimetric analysis (TGA). The specimens were produced by extrusion and compression molding methods. The analysis of variance and response surface methodology were employed for the analysis and optimization of the compositions. Optimal composition for overall response was 51.8 wt% rPP, 35.9 wt% RWF, 7.2 wt% CC, 3.9 wt% MAPP, 0.2 wt% UV stabilizer, and 1.0 wt% Lub with desirability score combining their output value of 0.757. The addition of CC content increased the mechanical properties but decreased the WA and TS. A high RWF content increased WA and TS with longer immersion times. The TGA of composites mainly depends on the chemical components of RWF and rPP types. The scanning electron microscope morphology in the composites with different amount of CC increased their densities due to good dispersion of CC as filler and good contact between the RWF reinforcement and rPP matrix.
Keywords
Introduction
Wood–plastic composites (WPCs) are value-added products manufactured from a mixture of wood particles, flour, or fiber and a thermoplastic matrix, together with varying amounts of additives. Demand of WPCs has been increasing due to their various advantages. 1 The WPCs are used for different applications for both outdoor and indoor including decking, landscape timbers, fencing, docks, railing, and automobile industries. 2 The production of WPCs has increased by 83% between 2003 and 2013 and such increase was US$1300 million in 2013 and it is expected that 20% annual growth will take place within the next 7–8 years. 3 WPCs reinforced such as wood flour (WF) has shown great demand due to the major advantages including low cost, maintenance, density, and biodegradability. Additionally, their manufacturing process is cost-effective and environmentally friendly.2–4 The results from a previous work showed that the polymer matrix from the waste stream can be used to manufacture WPCs with excellent properties. 5 However, most of the research in this area has been concentrated on the use of either a single plastic from the waste stream or a simulated waste plastic fraction to produce composites reinforced with WF. 6 Also, with the rapid development of the market and customer demands for enhanced properties of the final product, traditional WPCs have failed to deliver on specific quality requirements, such as enhanced mechanical properties and lower water absorption (WA).7,8
The plastic materials produced from petroleum are relatively easy to recycle. Thus governments in many countries have focused their efforts on recycling these waste plastics to reduce the volume of material going into landfills. 9 The properties of some plastics are similar to those produced from virgin materials such as polypropylene (PP) and polyethylene, having insignificant variation in their mechanical properties as compared to those manufactured from recycled polypropylene (rPP).10,11 Demand for products manufactured from waste plastics are increasing for various outdoor utilization such as flower vases, waste paper baskets, park benches, picnic tables, and plastic lumber. 12 In addition, PP and High Density Polyethylene compounds have widely been used for building and construction, transportation, packaging, automotive, and medical applications.10,13 In general, the primary characteristics of WF such as surface quality, size, and shape have a significant influence on both mechanical and physical properties of the final product. They are used as a reinforcing agent improving the mechanical, physical, creep behavior, and thermal characteristics of the composites.3,8,9 It is a well-known fact that WF is readily available, relatively inexpensive, improves stiffness, and plays an important role in sustainability and environmental friendliness.14,15 Rubberwood flour (RWF) waste as reinforcement in plastic composites has great interest from the point of environmental and for economical aspects. RWF is a cheap and renewable resource that can be added as a reinforcement to PP in order to decrease the overall cost and to modify some of the properties. 16 RWF results in composites with lower density and nonabrasive to the cutting equipment as compared to that of commonly used mineral fillers. 17 Therefore, the increased use of recycled plastics and waste wood offers the prospect of reducing solid waste disposals and reducing the costs of making the WPCs.2,8,15
The main disadvantage of using WF and fiber in the polymer matrix is its poor compatibility to the polymer.8,16,18 Therefore, the coupling agent and additives including maleic anhydride-grafted polypropylene (MAPP), lubricant (Lub), ultraviolet (UV) stabilizer, and chemical fillers are important elements and widely used to improve the overall properties of the WPCs 19 acting bridging agent between the two interfaces.18,20 Surfactants also play an important role in this function by their morphological structures as well as chemical reactions and therefore affect the mechanical, thermal properties, and morphological of composites reinforced with nanoclay and calcium carbonate (CC) particles. 21 Using the nanoclay and CC fillers in WPCs have been reported in several studies.4,6 It was found that these fillers caused better dispersion of the particles in the polymerized matrix and improved the mechanical and WA properties of the WPCs due to their exfoliated structures.5,22 The use of filler contents as reinforcement in WPCs received a wide interest as innovative material because of their potentials to enhance the overall properties of the final product, while reducing costs compared to other types of reinforcing materials.20,23
Experimental design on the formulation of composites is still conducted by changing the contents of each component at a time and keeping the other variables constant in order to investigate the effects of such specific parameters. 24 The mixed experimental design was carried out with D-optimal design method on the dependent component of research and the fitted models were used to find the optimal formulation of composite materials. 25 The analysis of variance (ANOVA) and response surface methodology (RSM) are excellent tools to determine which variables influence significantly the overall properties of the product. In addition, the D-optimal design can considerably reduce the number of experiments needed for accurate information on the component ratio. 26 Therefore, the objective of this work was to employ a mixture experimental design to model selected mechanical, physical, and thermal characteristics of laboratory-manufactured WPC samples. The ultimate goal was to evaluate the effects of parameters in the component formulation of WPCs made from rPP, RWF, and CC as filler so that optimal combination of these ingredients can be determined resulting in the excellent properties of the final product.
Materials and method
Materials
rPP with a density of 0.83 g cm− 3 having a melt flow index of 12 g/10 min at 230°C was used as a matrix for the experiment and was obtained from a local plastic recycling company, Withaya Intertrade Inc. Ltd, Samutprakarn, Thailand. RWF was supplied by a local furniture company in Trang, Thailand, and used as a reinforcing material. The RWF was screened on a sieve to classify at a particle size of 80 mesh and then dried in an oven at a temperature of 110°C for 8 h to reduce the moisture content. CC surface modified was purchased from Sand and Soy Industry Company Ltd in Lopburi, Thailand, used as fillers in the WPC samples. MAPP with a rate of 8–10% maleic anhydride provided by Sigma-Aldrich in St. Louis, Missouri, USA, was used as a coupling agent to the interfacial adhesion between rPP and RWF. The UV stabilizer with MEUV008 coding was purchased from TH Color Company Ltd, Samutprakarn, Thailand. The paraffin wax as a Lub was also supplied by Nippon Seiro Company Ltd in Yamaguchi, Japan.
Manufacture of WPC samples
Initially, WPC pellets were produced with formulations including contents of rPP, RWF, CC as filler, MAPP, UV stabilizer, and Lub. These components were mixed and melt-blended into WPC materials using a twin-screw extruder, Model EMT-36, from En Mach Company, Ltd, Nonthaburi, Thailand. The compounding with seven temperature zones of extruder was determined at 170°C, 175°C, 180°C, 185°C, 190°C, 190°C, and 200°C to remove the degradation of the compositions, while the screw rotation speed was set to 50 r min−1. The extruder strand pass gone through a cutting pellet machine. Before, WPC panels were produced. Prior to compressing, the WPC pellets were dried in an oven at a temperature of 110°C for 8 h to reduce moisture content, Subsequently, the composite pellets were then molded in a compression molding machine (hot-press). The mixtures were then pressed at a temperature of 190°C under a pressure of 870 lbf in−2 for 30 min with processes of preheating, compressing, and cooling, respectively, and reduced the probability of the formation of internal air voids in the compressing process. The final composite panel size was 16 (width) × 24 (length) × 4.8 cm3 (thickness) from a rectangular mold. Finally, the specimens were cut into specific dimensions for each type of test based on the American Society for Testing and Materials (ASTM) standard.
Characterizations of WPC samples
Mechanical properties
The tensile and compressive properties of these samples were carried out using an Instron Universal Testing Machine, Model 5582, (Norwood, Massachusetts, USA). Before testing, the WPC samples were dried in an oven at a temperature of 50°C for 24 h. The tensile tests were carried out based on ASTM D 638-91 at a crosshead speed of 5 mm min−1 while the overall length of the samples was 75 mm (type IV). For the compression test, the dimension of specimen was 4.8 (width) × 9.6 (length) × 4.8 mm3 (thickness). The composites test for the samples was performed according to ASTM D 6108-97 at a constant displacement rate of 0.5 mm min−1. Five replications of both properties were tested at a room temperature of 25°C and their average values were reported.
Surface roughness properties
Surface roughness characteristics of WPCs were determined by using a fine stylus profilometer SRT-6200 unit equipped with a TK-300 skidless type pickup. The surface roughness parameters were, namely average roughness (Ra) and mean peak-to-valley height (Rz), were used to evaluate the surface property of WPC samples. The rectangular specimen with dimensions of 30 (width) × 30 (length) × 4.8 mm3 (thickness) was used for the roughness test. All the WPC samples were dried before to perform a roughness test in a convection oven at a temperature of 50°C for 24 h. The test was characterized at room temperature (25°C). Average of five specimens was measured and calculated from the surface of each sample at the dry condition and after the samples were immersed into water for 720 h.
Water absorption and thickness swelling properties
WA and thickness swelling (TS) tests were conducted in accordance with ASTM D 570-88. The WPC samples with dimensions of 10 (width) × 20 (length) × 4.8 mm3 (thickness) were cut from the panels and dried in an oven at a temperature of 50°C for 24 h until they reach a constant weight. Before testing, the weight and thickness of all samples were measured. Five replications of each formulation of composites were submerged in distilled water at room temperature (25°C) for sequential time spans of 720 h. For each exposure, the samples were removed from the water tank, wiped, weighted, and immediately returned at each test period. The percentages of WA and TS of the specimens were calculated based on the value at the initial weight and after they were saturated.
Thermal degradation behavior
Thermogravimetric analysis (TGA) was employed to observe the thermal degradation behavior of the compositions on the TGA7, PerkinElmer, Massachusetts, USA. The temperature range was from 25°C to 800°C at a heating rate of 10°C min−1 under pure nitrogen. The equipment was accurately calibrated for this condition, and the samples had an approximate weight of 10 mg.
Scanning electron microscopy
Morphologies of rPP and RWF as a matrix and dispersion of the CC contents in the samples were observed regarding the fractured surface, interfacial, interlayer structure, and distribution phase by scanning electron microscope (SEM), FEI Quant 400 (FEI Company, Hillsboro, Oregon, USA) having an accelerating voltage of 20 kV. All of the samples were dried in a convection oven at a temperature of 50°C for 24 h prior to the SEM analysis. The surfaces of the samples were coated with gold to prevent electrical charging and micrographs were taken at magnification levels of 150× and 1500×.
Experimental design and statistical analysis
D-optimal design of experiments was carried out with Design-Expert software (version 8.0.6, Stat Inc.). The results of WPC samples were statistically optimized the formulation and a function of compositions influencing their mechanical, physical, and thermal properties. The experimental design of WPC materials was determined in the component factors of rPP (x1), RWF (x2), CC (x3), MAPP (x4), UV stabilizer (x5), and Lub (x6). The ranges of rPP (45–55 wt%), RWF (32–42 wt%), and CC (5–9 wt%) contents obtained from a previous study4 and the constants of MAPP (3.9 wt%), UV stabilizer (0.2 wt%), and Lub (1.0 wt%) were defined following the literature review. The compositions of the samples are 100% in the mixture and 16 runs for the experimental design as displayed in Tables 1 and 2. Five replications of each sample were tested and the average results were determined.
Formulations and measured responses of composite samples with D-optimal experimental design for mechanical and thermal properties.
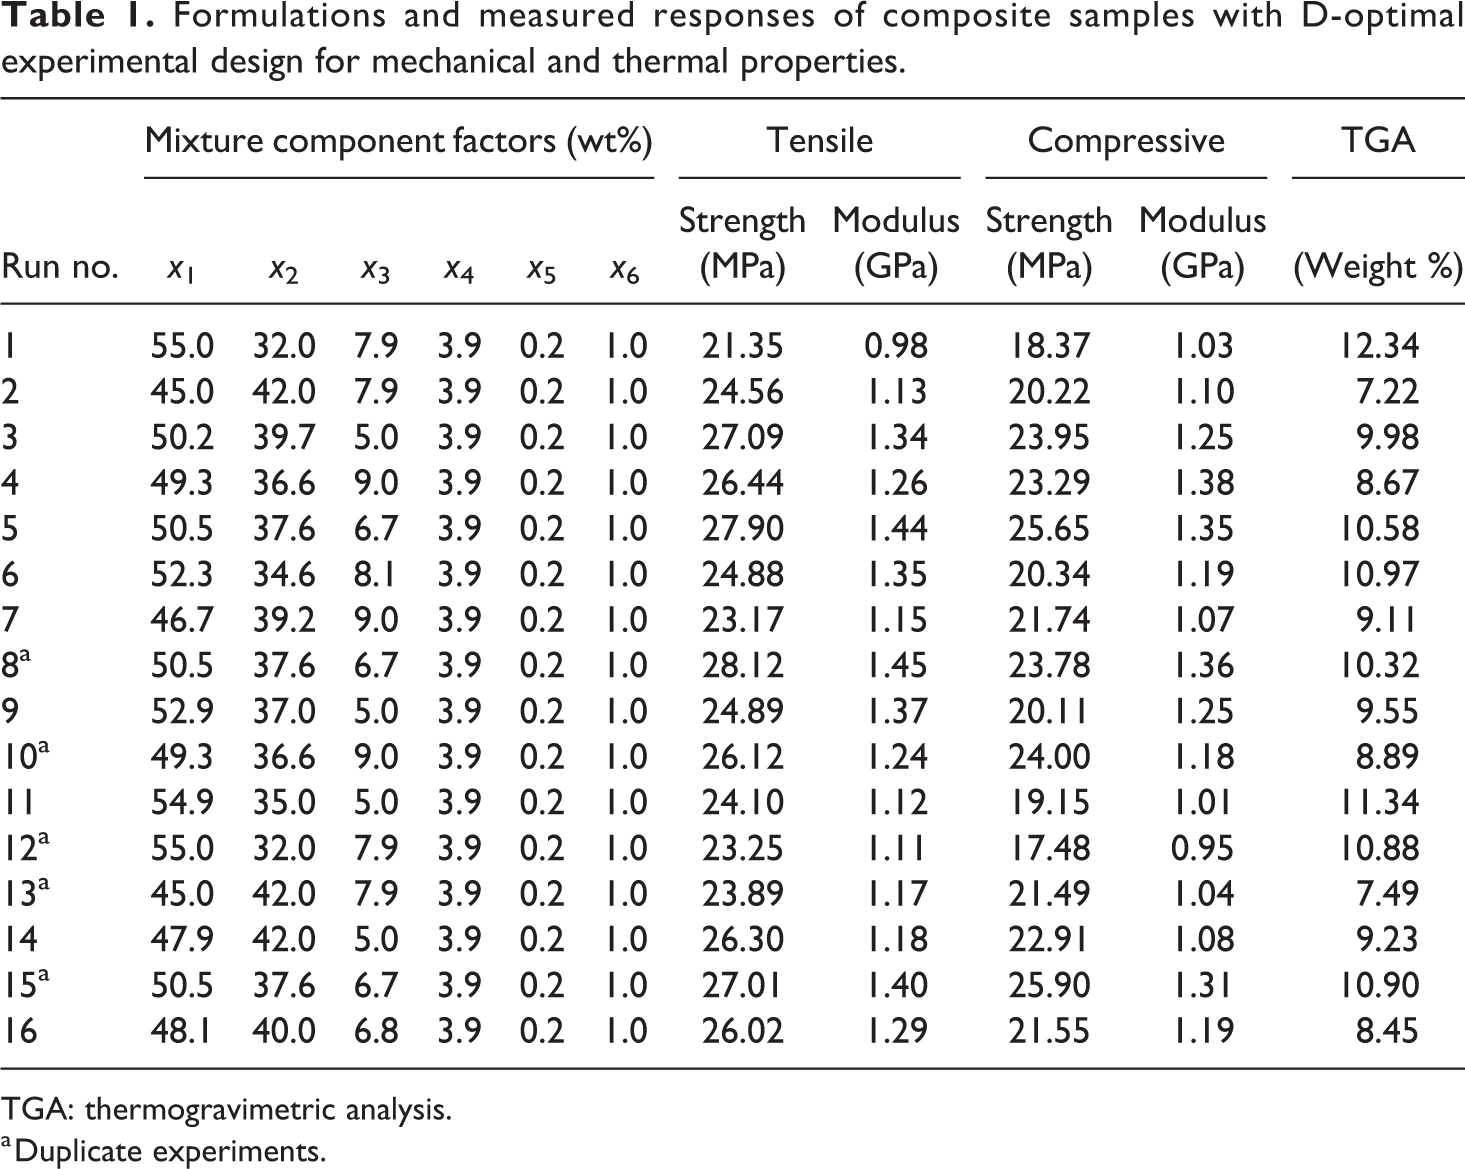
TGA: thermogravimetric analysis.
a Duplicate experiments.
Formulations and measured responses of composite samples with D-optimal experimental design for physical properties.
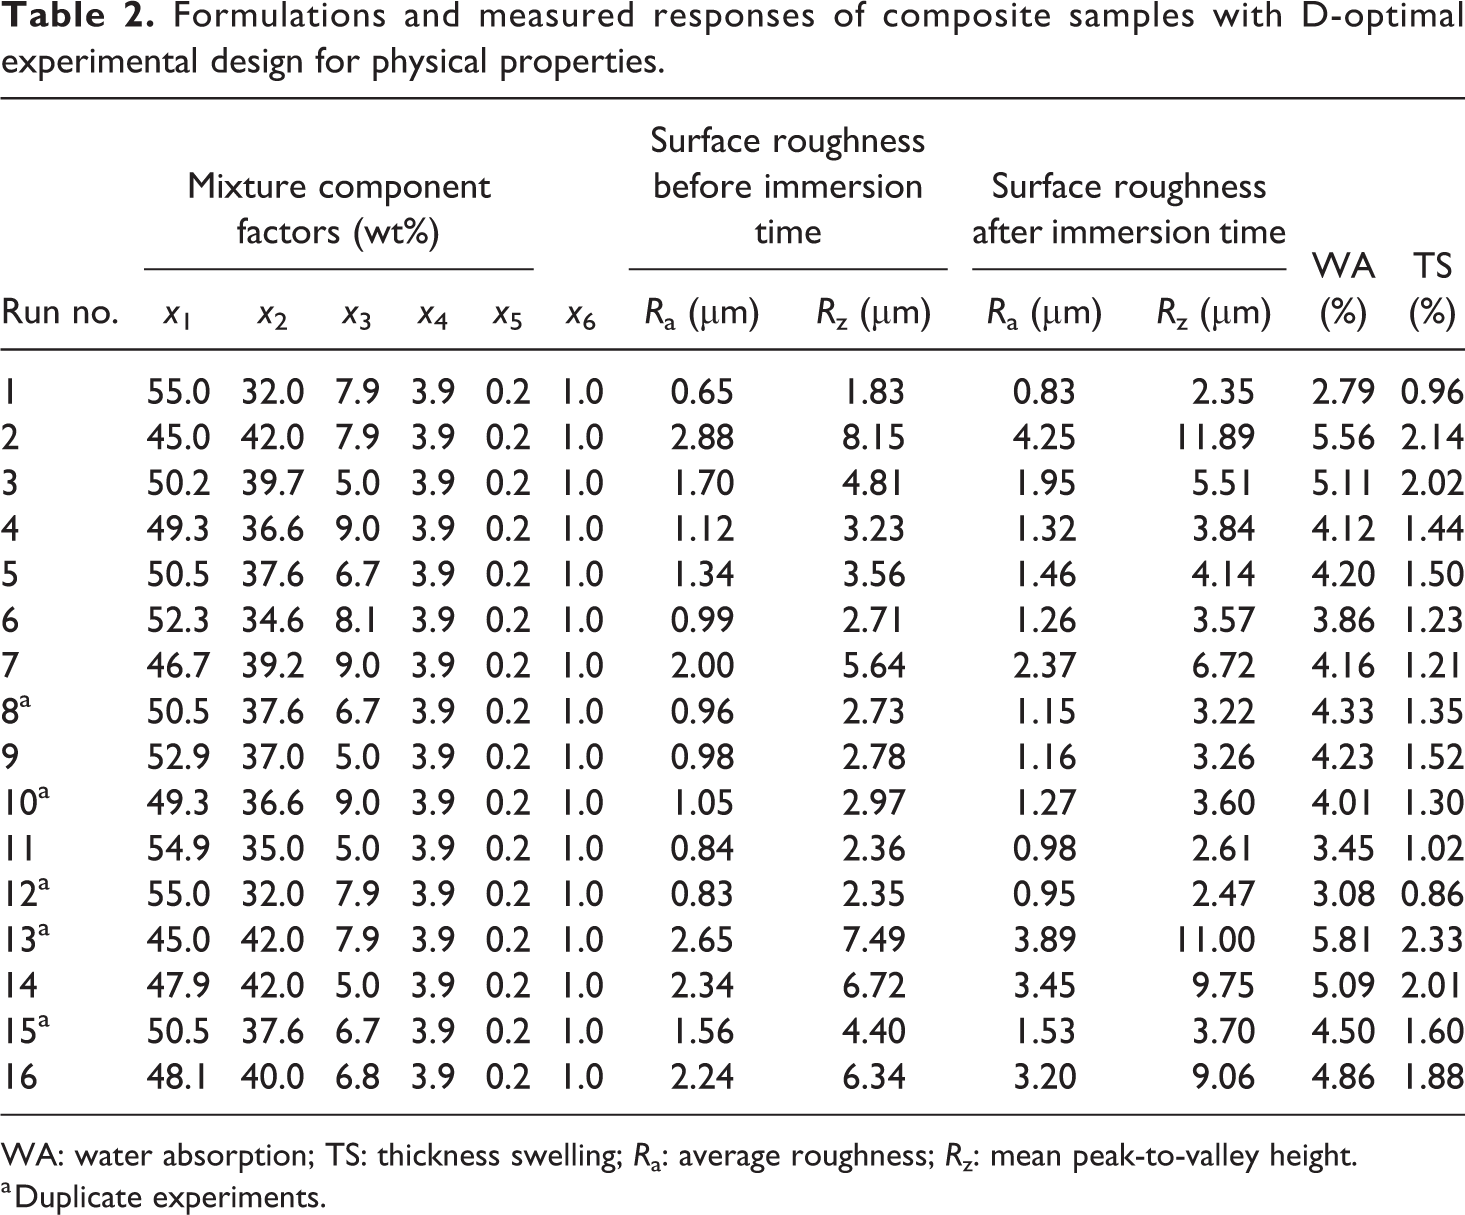
WA: water absorption; TS: thickness swelling; Ra: average roughness; Rz: mean peak-to-valley height.
a Duplicate experiments.
The ANOVA and RSM were used to optimize the overall formulation of the samples. The properties of WPC samples were analyzed with linear and quadratic models. The experimental results were used to evaluate the effect of composition factors on tensile strength and modulus, compressive strength and modulus, surface roughness (Ra and Rz), WA, TS, and TGA properties, respectively. The results were statistically analyzed for five samples from testing with a 5% significance level (p value less than 0.05). Additionally, the RSM is a collection of statistical techniques and mathematical based on the fit of the model equations to the experimental data, which describe the characteristic of a data set with the objective of making statistical previsions. 27 RSM was employed to assess the relationship between responses, namely tension, compression, surface roughness, WA, TS, and TGA properties and three dependent variables of rPP, RWF, and CC. Regression coefficients of responses were generated by the linear and quadratic models as follow:
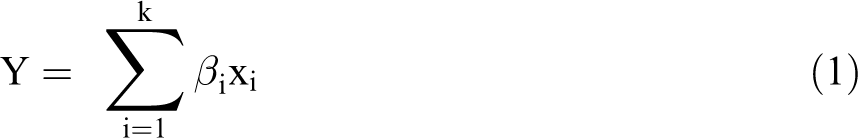
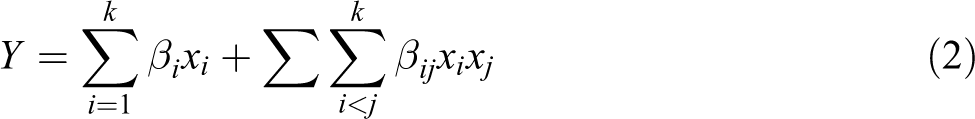
where Y is a response factor (tension, compression, surface roughness, WA, TS, and TGA properties); βi and βij are coefficients of the first order and interaction terms, respectively; xi is the dependent variable; and xixj is the quadratic interaction term of the factors.
Results and discussion
The response models data on properties of the samples, namely tensile strength and modulus, compressive strength and modulus, surface roughness, WA, TS, and TGA are displayed in Tables 1 and 2.
Model fitting and ANOVA analysis
The ANOVA analysis is a statistical model based on the F test or p value, which can be used to evaluate the significance of response models. The experimental results were further analyzed using ANOVA analysis with p values less than 0.05 (p < 0.05). The determination of factor for optimal composition was the contents of rPP, RWF, CC, MAPP, UV stabilizer, and Lub in any experimental work. Analysis of the alternative types of response models presented that tensile strength and modulus, compressive strength and modulus, and surface roughness (Ra and Rz) fitted in the quadratic models, while WA, TS, and TGA fitted in the linear models. The best-fitting model summary for surface roughness (Ra) with a quadratic model is presented as an example in Table 3. The sequential model sum of square for quadratic model value of <0.0005 is significant (p <0.05) based on the fitted model of Ra. Furthermore, the lack-of-fit value of 0.0856 is clearly insignificant (p > 0.05) for the quadratic model. Also, the adjusted R2 was found to be 0.9423 and the predicted R2 value of 0.9213 also indicated the significance of the model, thus suggesting that such model performs well.
Fitted model summary for surface roughness (Ra) property.
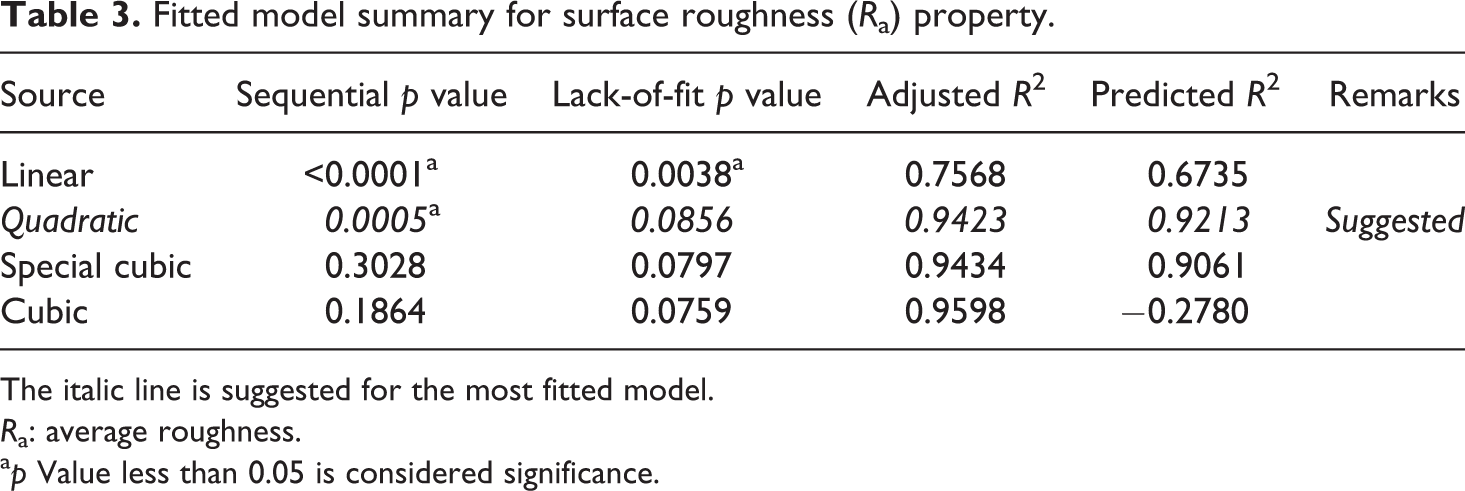
The italic line is suggested for the most fitted model.
Ra: average roughness.
ap Value less than 0.05 is considered significance.
Table 4 shows the ANOVA analysis for the linear and quadratic models from the experimental results. It was observed that the ANOVA displayed an acceptable value and the statistical significance of these terms supplementing linear models for all the responses, except the tensile and compressive modulus with insignificance. It appears that the response models had significant interactions, as in the case of between rPP and RWF, and rPP and CC for tensile strength and between rPP and RWF for compressive strength. However, no interaction terms for response were significant in certain models, such as between RWF and CC for tensile strength and between rPP and CC, and RWF and CC for compressive strength. The findings in this study also emphasized the fact that the interaction of rPP and RWF reacted chemically with the other compositions.
ANOVA based on the fitted quadratic and linear response models for all the properties.
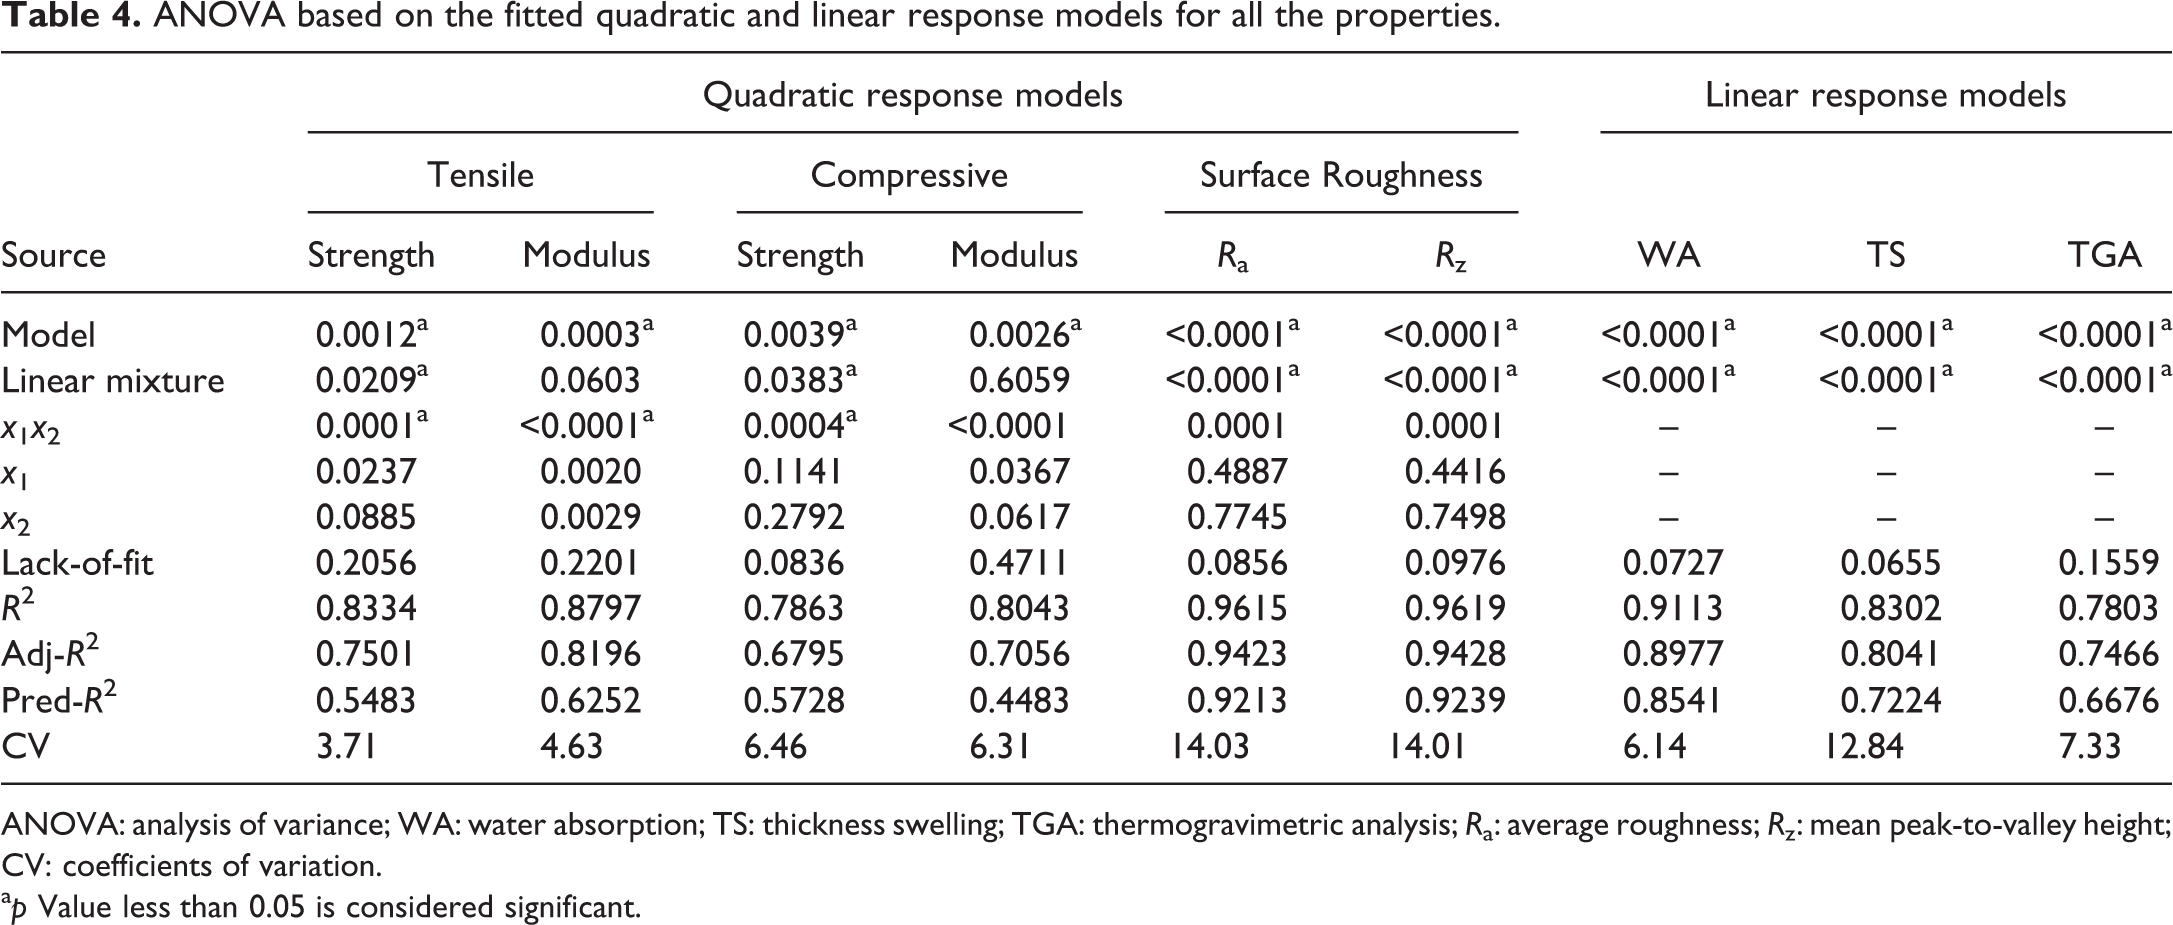
ANOVA: analysis of variance; WA: water absorption; TS: thickness swelling; TGA: thermogravimetric analysis; Ra: average roughness; Rz: mean peak-to-valley height; CV: coefficients of variation.
ap Value less than 0.05 is considered significant.
Additionally, the ANOVA analysis also displayed the lack-of-fit, coefficients of determination (R2), adjusted R2, predicted R2, and coefficients of variation (CV) were used to determine the performance of developed response model, as given in Table 4. For example, the quadratic model for the surface roughness (Rz) had insignificant lack-of-fit with p value = 0.0976, and also coefficient of determination being high R2 = 0.9619, adjusted R2 = 0.9428, and predicted R2 = 0.9239. The R2 for each of response was higher than 0.75 referred to the good correlation among the process factors and properties of composite samples. The R2 values of response models in the range of 0.7803–0.9619 referred the good fits and reliability of the experimental results. The R2 value of 0.9619 for surface roughness (Rz) is in reasonable agreement with the experimental results, meaning that this regression model could explain about 96.19% of the variability in the data. The regression analysis clearly displays statistical significant (p < 0.05) regression models for all the responses with the high R2 and p values for the lack-of-fit was insignificant (p > 0.05) thereby confirming the validity of the model. The adjusted R2 was used to compare the explanatory power of response models with different numbers of predictors, when a new term of factors is added. The adjusted R2 of regression analysis is in the range of 0.6795–0.9428 as can be seen in Table 4. The predicted R2 is used in regression analysis to indicate how well the model predicts response models for new observations. 28 The predicted R2 value of 0.9239 was determined for roughness (Rz) properties, meaning that the full model is estimated to explain about 92.39% of the variability in new term data. Finally, the CV of each response model based on the replications of experiment results display the values in the range of 3.71–14.03%, as given in Table 4. Generally, the CV values are used to measure the residual variation in the response data and should not be more than 10%. Therefore, the value of the CV was 3.71% for tensile strength, indicating the highest degree of precision and reliability of the experimental results.
Diagnostic verification of the models
The adequacy of the response models was checked via various diagnostic plots such as normal probability plot of the residuals, plots of residuals versus predicted response, and plots of predicted response versus actual value. For example, the model adequacy checking for tensile strength is shown in Figure 1. However, observation of fitted response surface model may produce poor or misleading results, unless the model shows a good fit, which is important to check the model adequacy.28,29 Figure1(a) illustrates the normal probability plot of residuals, meaning the normal plots distribution of the residuals for response models. It was found that the data points on this plot lay reasonably close to the straight line, such finding explains the normal probability plot of residuals was normally distributed and no large deviation of the variance happened in the response model. Additionally, Figure1(b) displays the relationship between internally studentized residuals and predicted response obtained from models. The plot of residuals and predicted response for this case indicated that the existence of linear patterns gives the experimental values. Likewise, these residuals plots were presented the normal distribution and the residuals of the response randomly scatter. Finally, Figure1(c) exhibits the plot collections around the diagonal line for predicted response and actual values. Similar adequacy checking of the other modeled responses gave no indications of problems with the fitted models either. The predicted responses were relatively close to the experimental results and lay near the straight line at an acceptable level, which indicated that the predicted response illustrated adequate agreement with actual value.
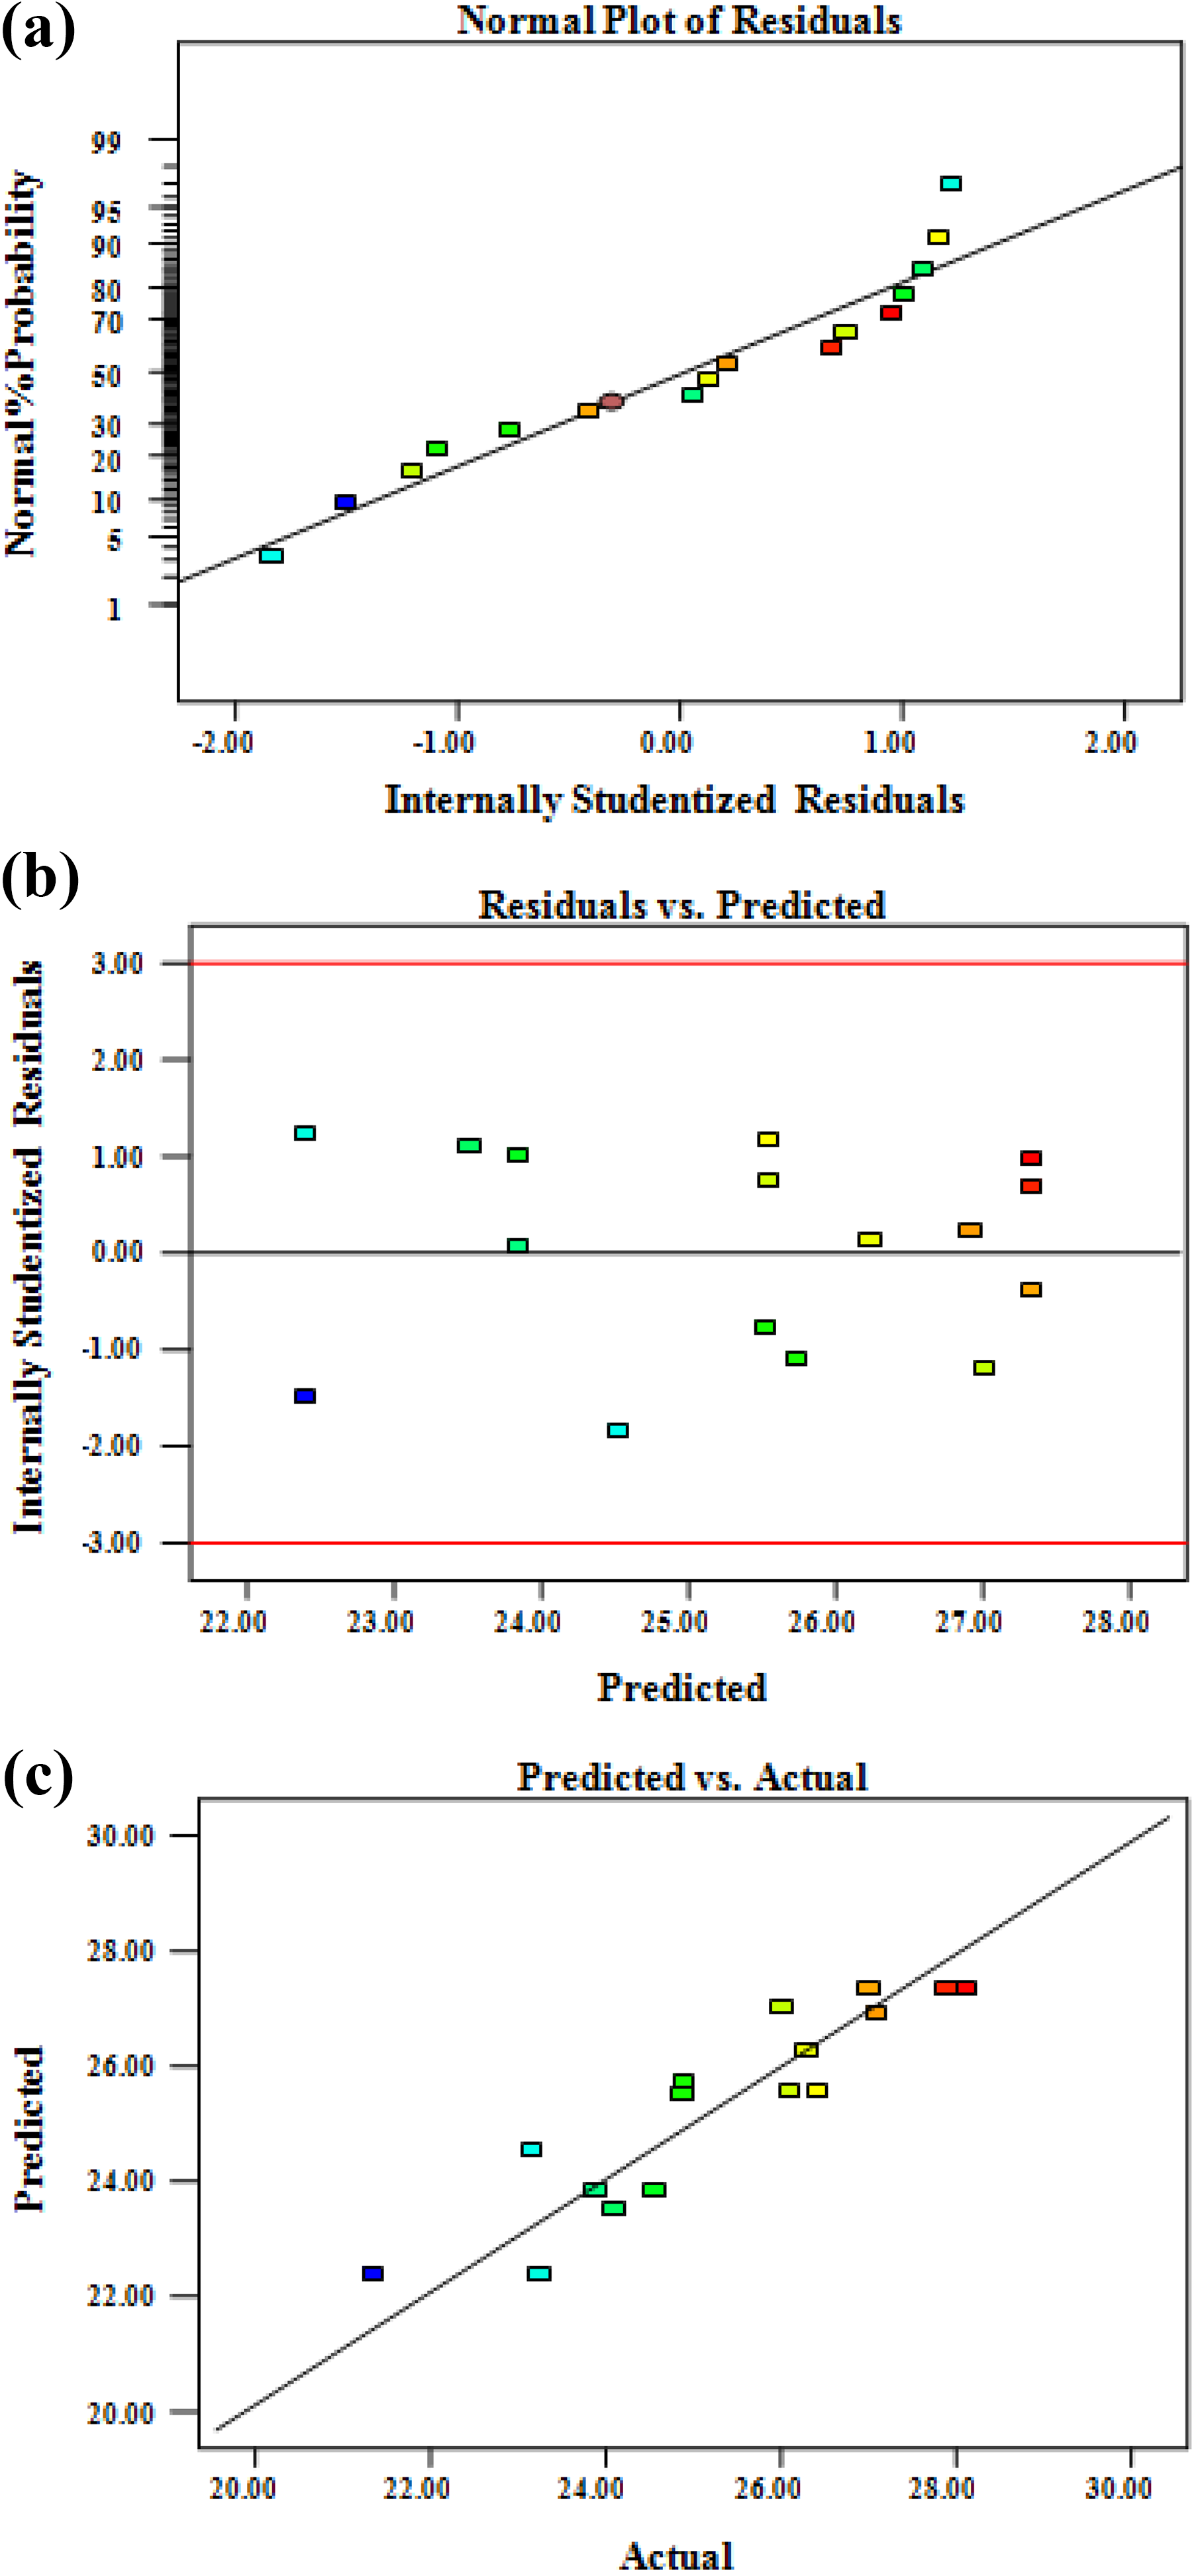
Model verification for tensile strength: (a) normal probability plot of the residuals, (b) plots of residuals versus predicted response, and (c) plots of predicted response versus actual values.
Optimization and effects of compositions on tensile properties
The tensile strength and modulus of the WPC samples containing different amounts of rPP, RWF, and CC as filler are presented in Table 1. It is generally known that the tensile modulus gradually increased with an increased proportion of WF in the polymer matrix. Such an increase is a result of the system being miscible causing excellent dispersion and adhesion of the wood fiber in the composites. 29 The data of each response was analyzed by ANOVA and these compositions were optimized using the RSM method. The regression equations in terms of factors to predict the effects of compositions on tensile strength and modulus were expressed by the quadratic models as follows:


The relation between the tensile response and the three factors, namely rPP (x1), RWF (x2), and CC (x3), in the generalized quadratic model are shown in equations (3) and (4). These regression equations of tensile strength and modulus responses display negative coefficients for main effects and positive coefficient for interaction terms. It was observed that the CC as filler had the highest negative coefficients for tensile strength and modulus values of 24.59 and 2.73, respectively. This implies that the CC content had a significant effect on compositions for tensile properties. Additionally, the RWF content resulted in significantly higher negative coefficients than rPP due to the tensile strength and modulus of the composites increases with an increase in RWF fraction.5,18
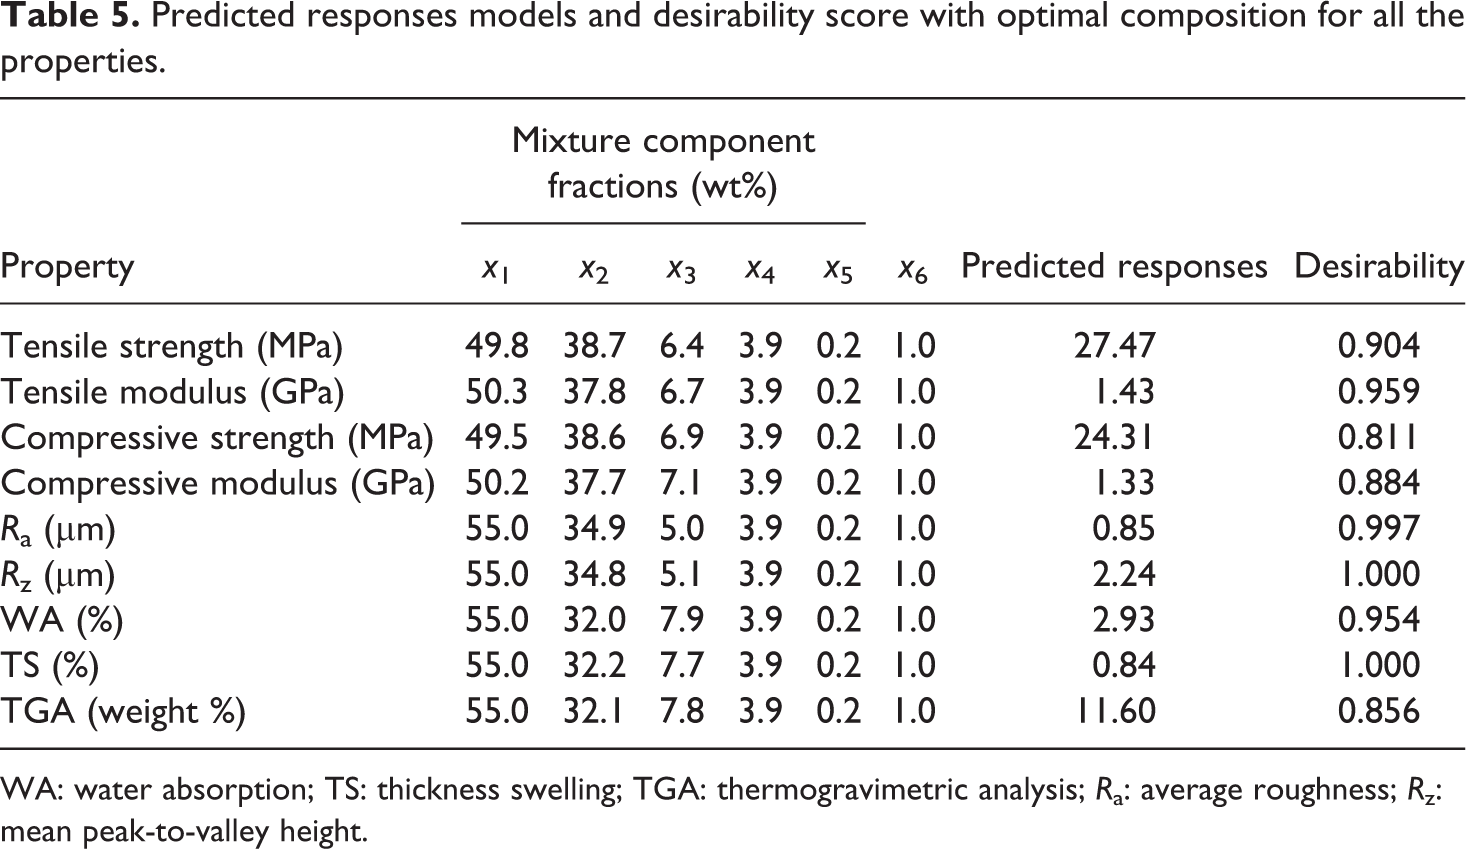
The contour plots of response model for tensile strength and modulus are exhibited in Figure 2(a) and (b), respectively. The average tensile responses of composites samples ranged from 21.35 MPa to 28.12 MPa for tensile strength and 0.98 GPa to 1.45 GPa for tensile modulus. These values fall in the similar as those of the recycle PP, RWF, and filler contents composites reported in previous work.4,12 The optimization of tensile strength and modulus based on these regression models is illustrated numerically in Table 5. It can be seen that the optimum content of CC as a filler about 6–7 wt% resulted in high tensile strength and modulus. This is because CC content can be distributed in the voids between wood fiber and polymer matrix, resulting in enhanced tensile properties of the WPCs.The SEM micrographs in Figure 3 show that the composites samples with 5–9 wt% of CC as filler increased their densities due to good dispersion of RWF and CC contents, good contact between the RWF and the rPP matrix and uniformly distributed in the WPCs with the stable morphology. However, the content of RWF at 38.7 and 37.8 wt% showed the best values for tensile strength and modulus. The compositions in Figure 2 display tensile properties increase with the RWF and CC as filler contents. Moreover, the predicted response values of 27.47 MPa and 1.43 GPa were determined for tensile strength and modulus, respectively. Also, the high-desirability scores for tensile strength and modulus are in reasonable agreement with the values of 0.904 and 0.959, respectively. The predicted response and desirability score combining their outputs of tensile properties are also included in Table 5.
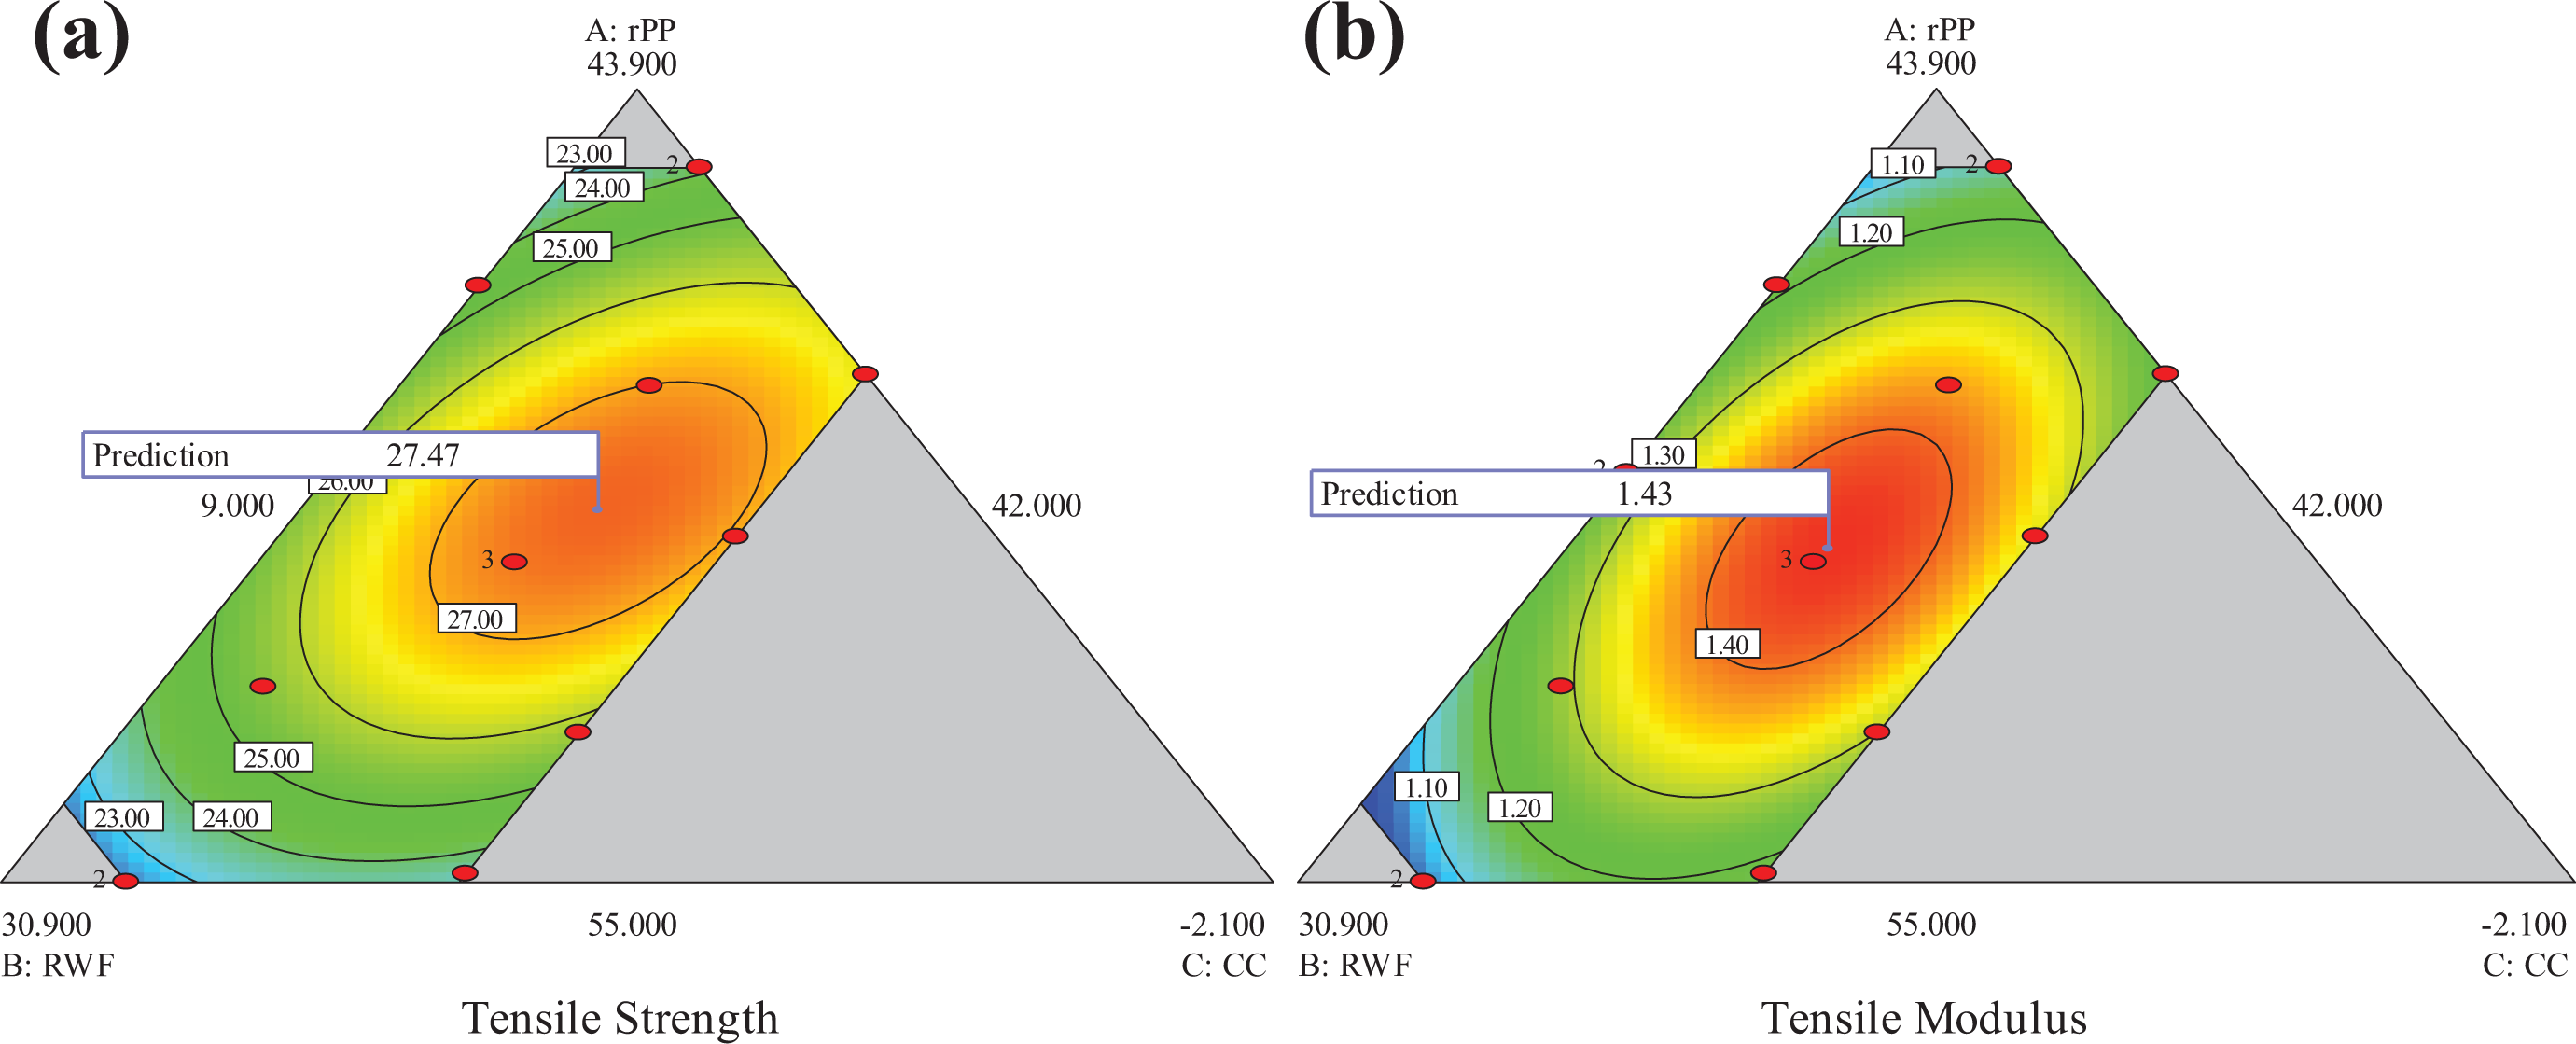
Effects of composition and response surface contour plots on tensile properties: (a) tensile strength and (b) tensile modulus.
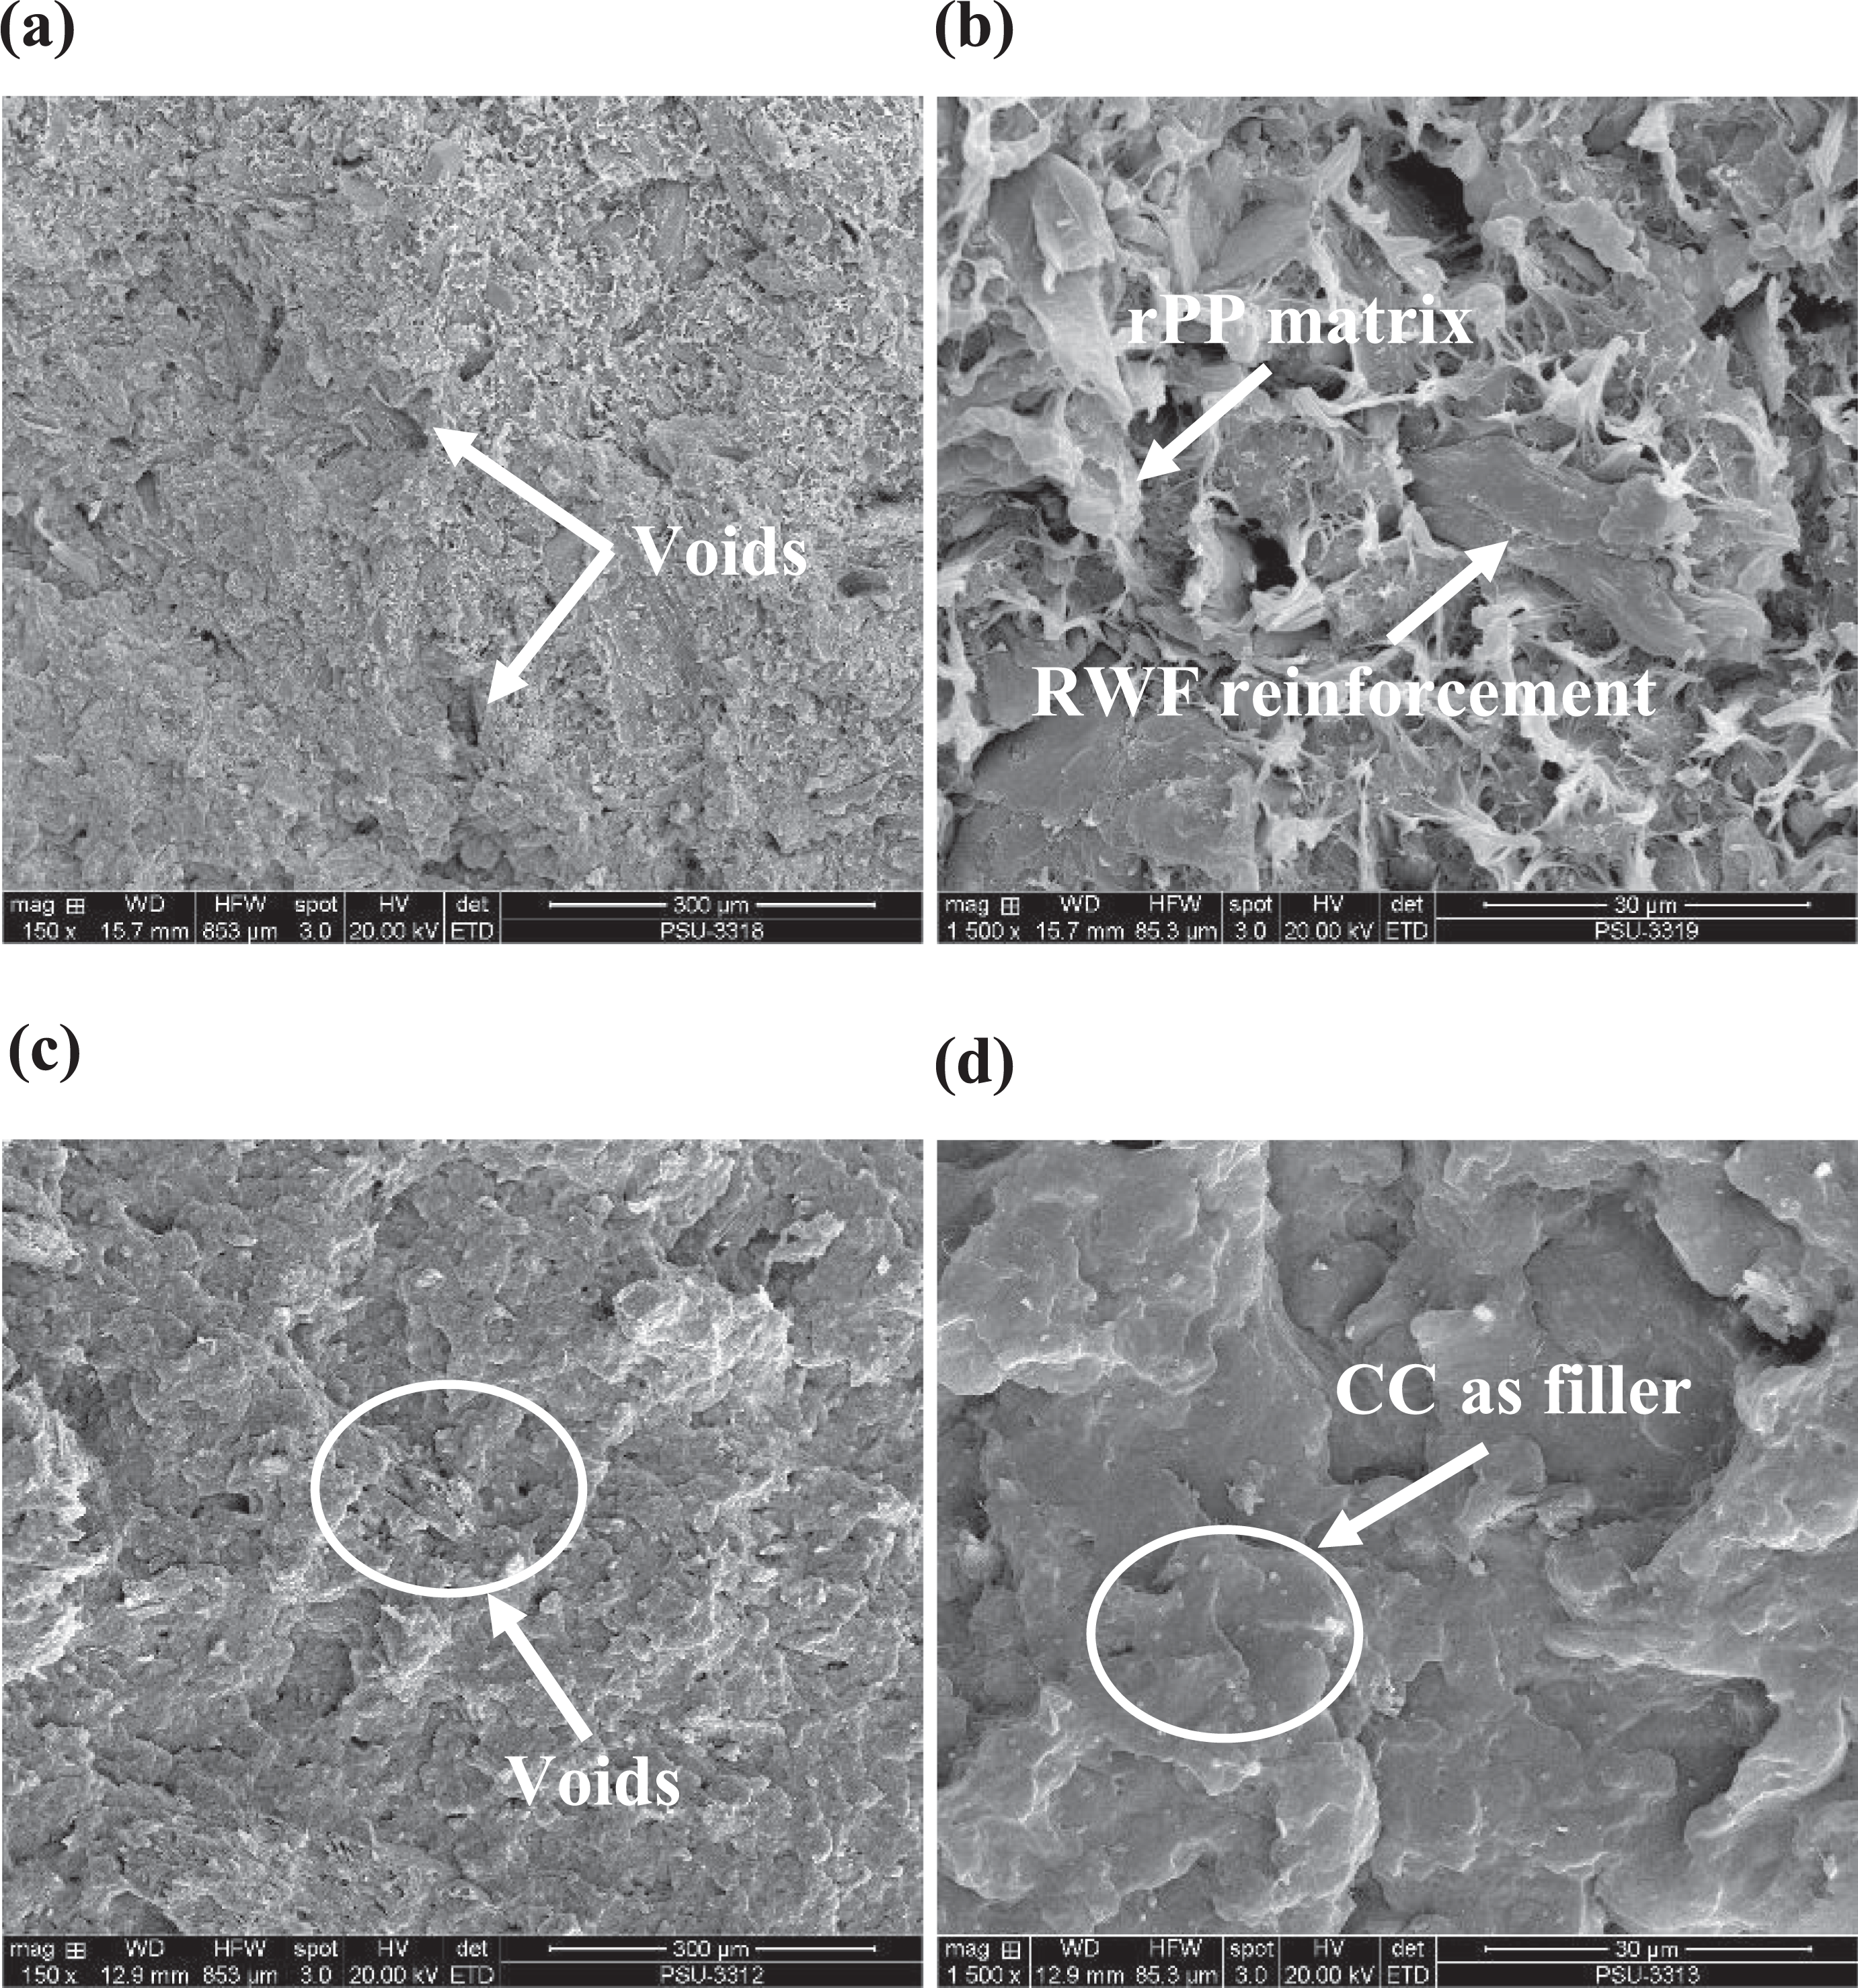
SEM micrographs taken from cross-section of WPC samples: (a) and (b) WPCs with 5% of CC and (c) and (d) WPCs with 9% of CC. Magnifications were 150× and 1500× from left to right.
Predicted responses models and desirability score with optimal composition for all the properties.
WA: water absorption; TS: thickness swelling; TGA: thermogravimetric analysis; Ra: average roughness; Rz: mean peak-to-valley height.
Finally, the composition optimized based on tensile properties (both strength and modulus) is depicted in Figure 4. The plot shows the factors that were considered optimal, along with the contours of the desirability score. The optimal formulation for tensile properties was 50.1 wt% rPP, 38.2 wt% RWF, 6.6 wt% CC, 3.9 wt% MAPP, 0.2 wt% UV stabilizer, and 1.0 wt% Lub with a desirability score value of 0.927. This formulation of the WPC samples can be used for most suitable applications based on the tensile properties.
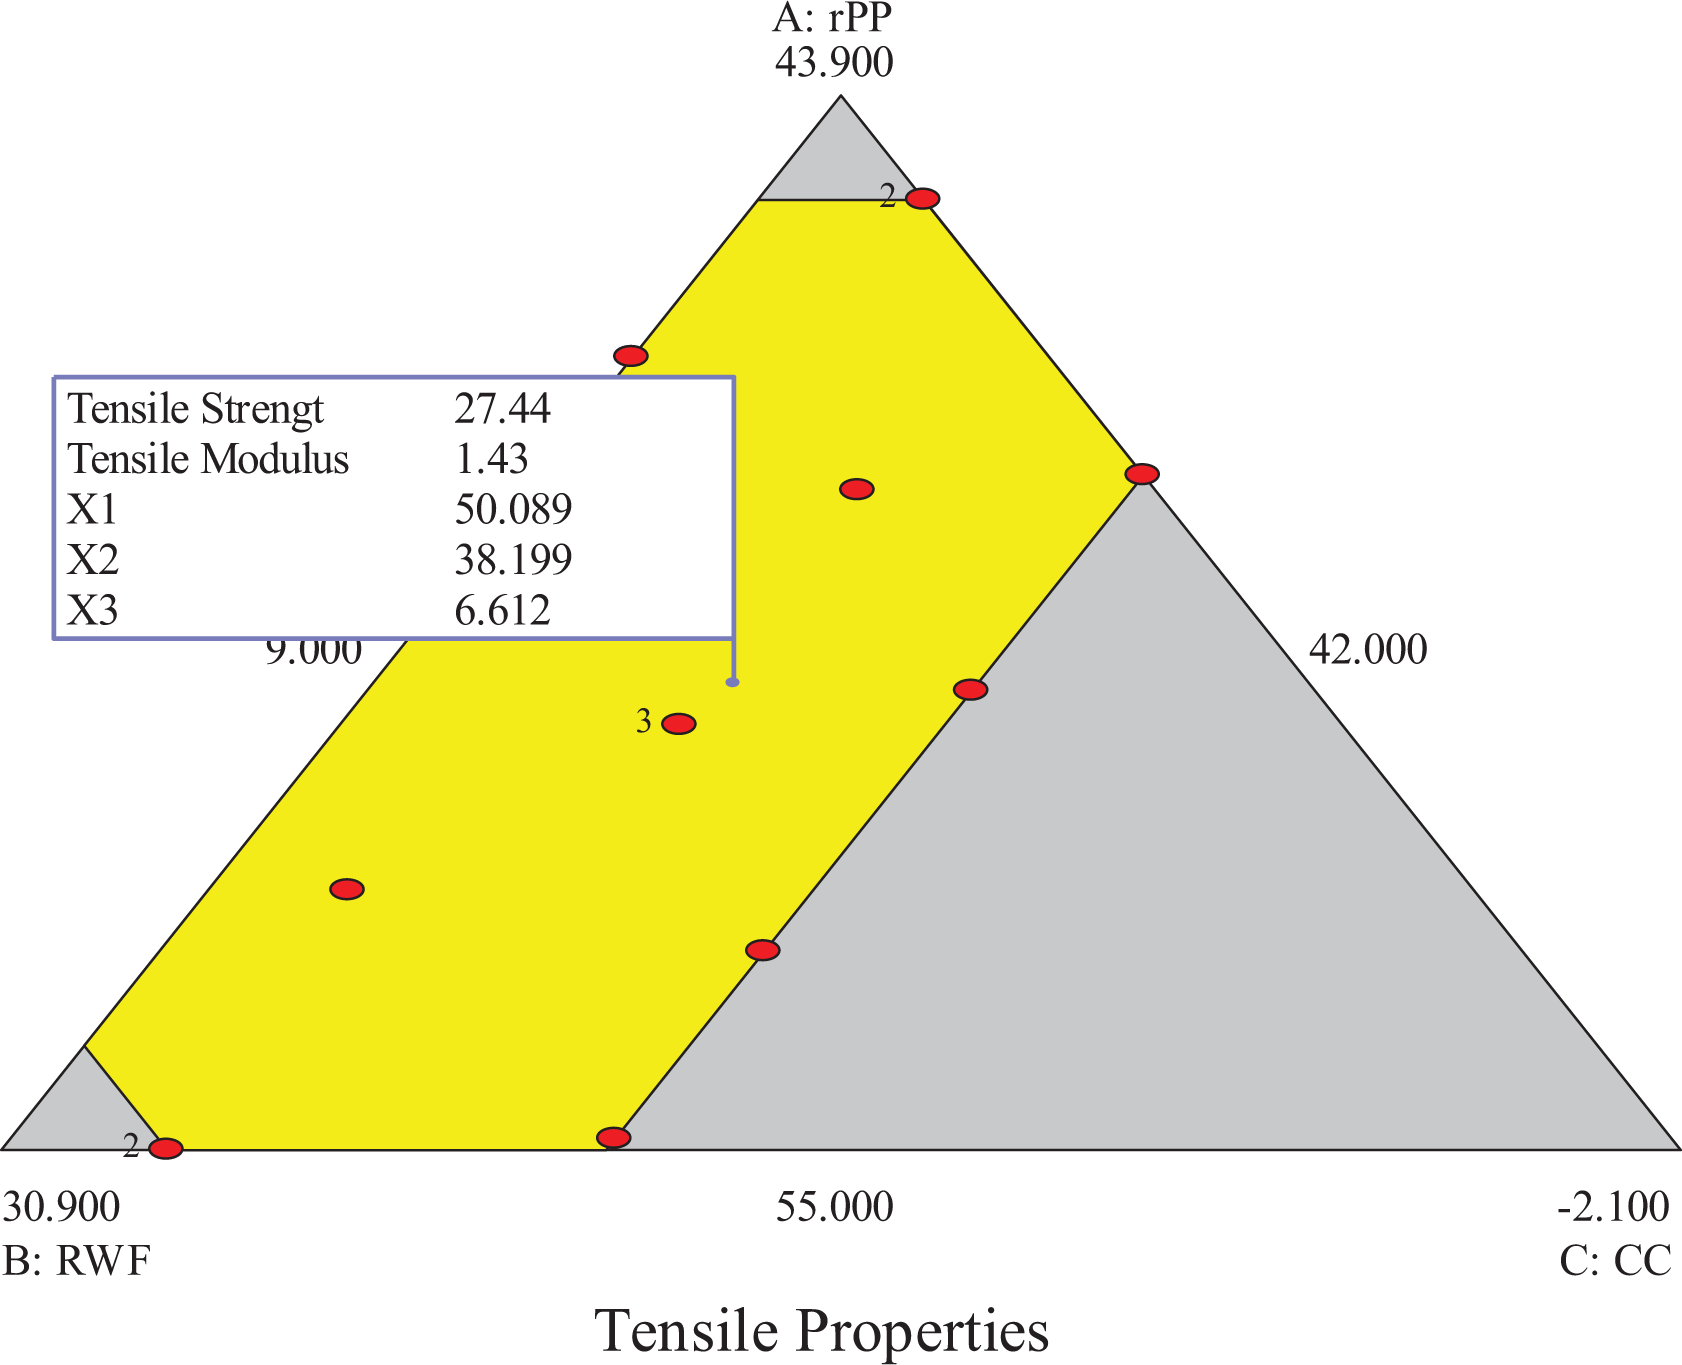
The optimal composition of WPC samples for tensile properties.
Optimization and effects of compositions on compressive properties
The values of compressive properties and experimental results of WPC samples are summarized in Table 1. The compressive response models were selected which generated a total of 16 design experiments covering different amounts for three input variables, namely, rPP, RWF, and CC. The compressive strength and modulus of the response models were considered in this work. The maximum values of compressive strength and modulus were presented for the quadratic model for all the responses. The mean regression equation for compressive strength and modulus could be obtained based on the quadratic model:


The models of composites samples in equations (5) and (6) show the regression analysis of the responses with correlation coefficients. As can be seen from both equations, the negative coefficient of CC as a filler has the largest in the model fits, values of 22.16 and 1.87, respectively. It is found that the values were further improved after the addition of CC as a filler. This was because of improvement in the interfacial adhesion of polymer matrix. Furthermore, the RWF reinforcement had significantly higher correlation coefficients than the rPP matrix, due to the interfacial adhesion increased by the WF improved the mechanical properties of composite samples. 30 The higher coefficients between RWF and rPP matrix confirm the suitability of the regression models and correctness of the calculated equations. Response contour plots of compressive strength and modulus are shown in Figure 5(a) and (b).
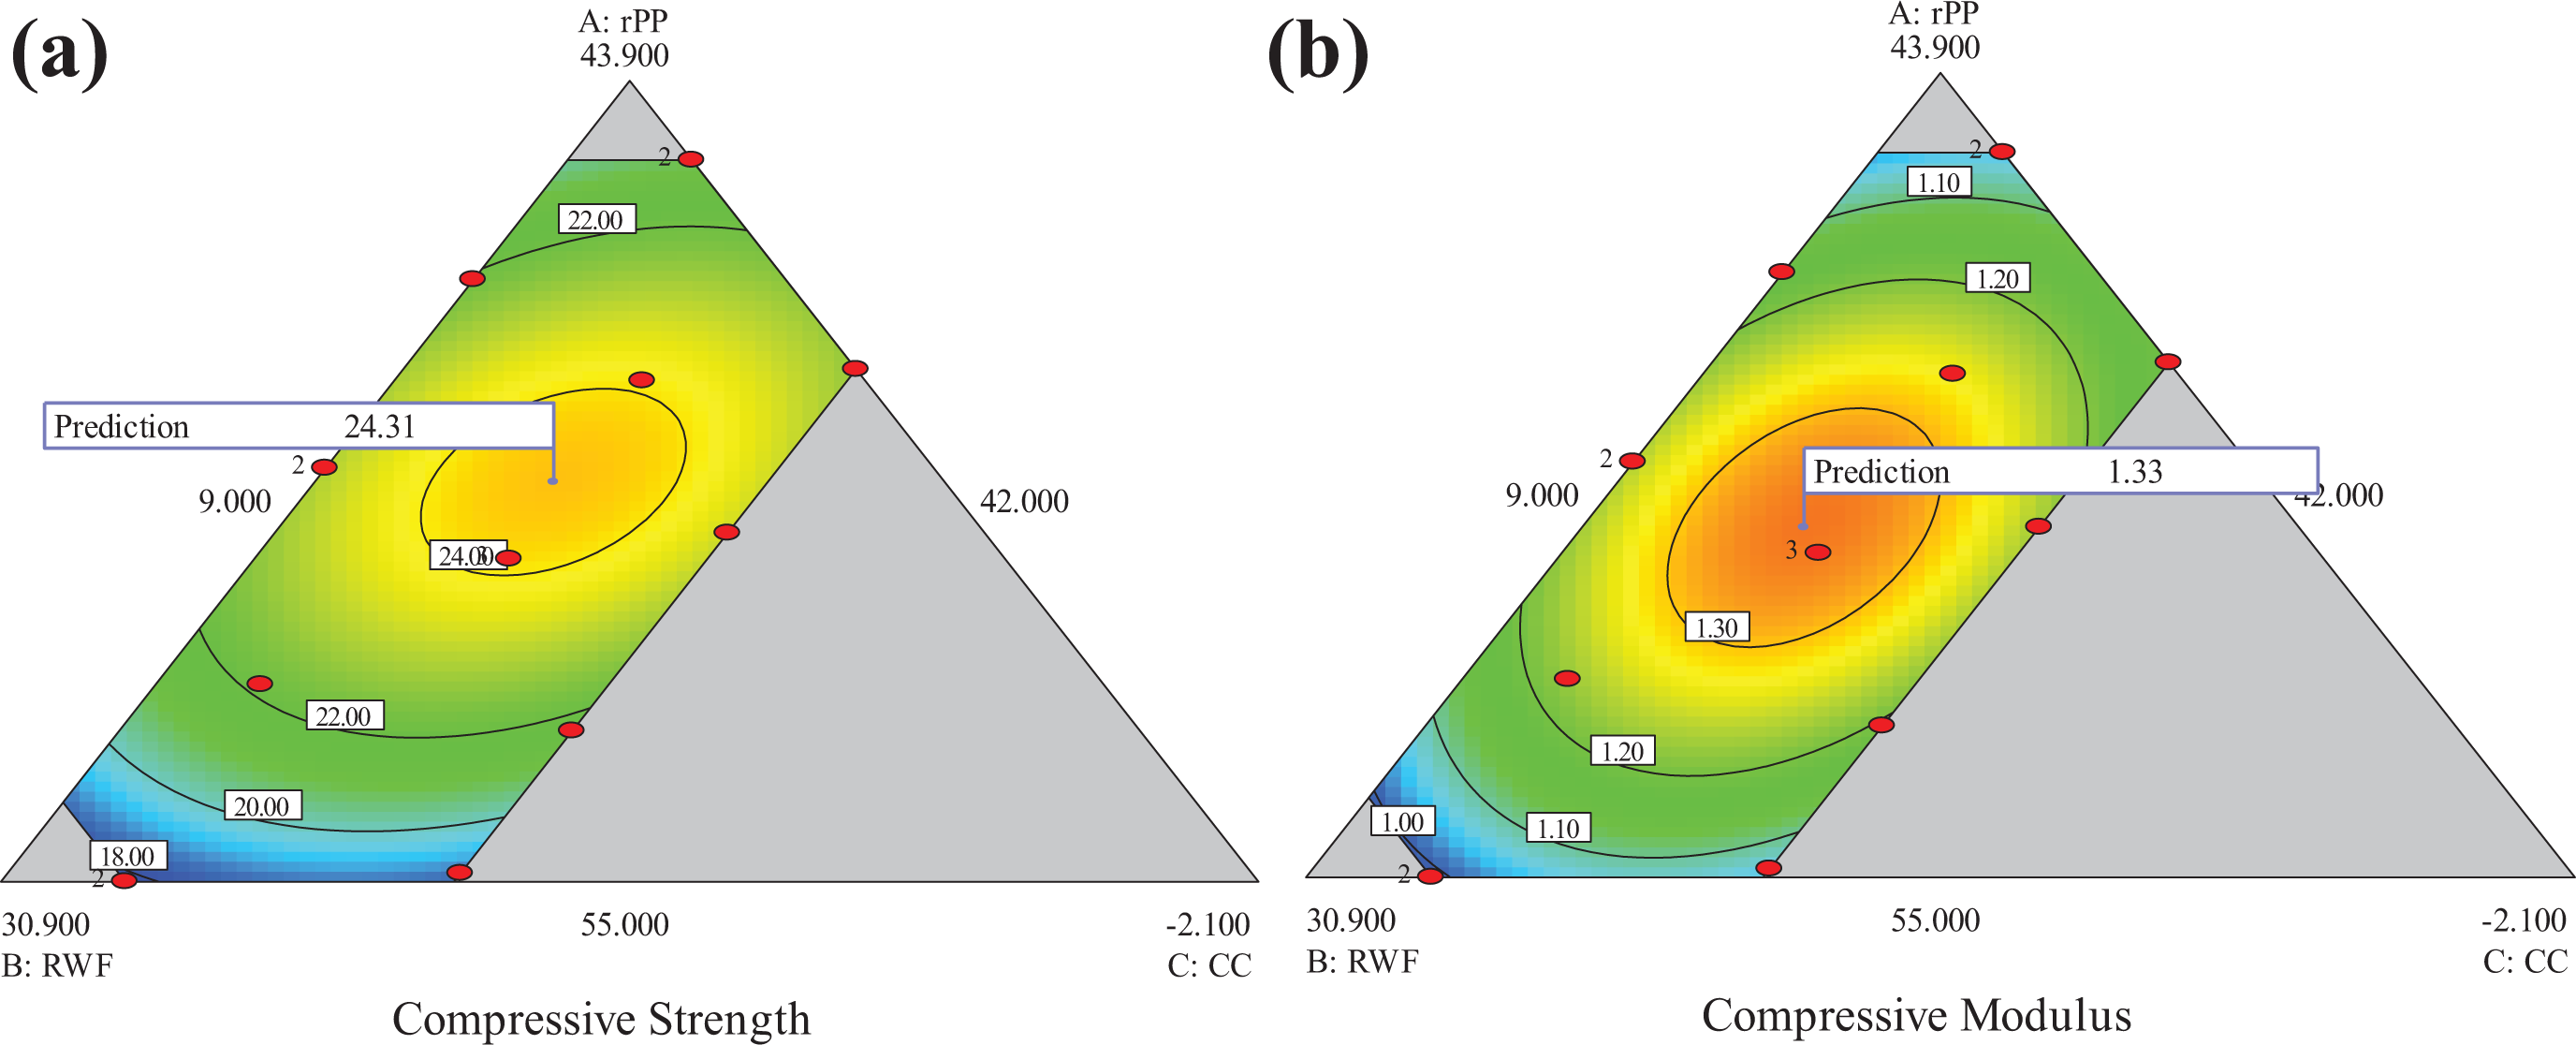
Effects of composition and response surface contour plots on compressive properties: (a) compressive strength and (b) compressive modulus.
The triangular contour plots in Figure 5 show components position for experimental results. The optimal formulation, predicted response, and desirability score based on the compressive strength and modulus are also presented in Table 5. The experimental results illustrate that an increase in WF loading slowly increased the compressive strength and modulus in WPCs. The optimal compressive strength and modulus were obtained with RWF loading of 38.6 and 37.7 wt%, respectively. Content of CC as filler from 5 wt% to 9 wt% affected the compressive strength and modulus of composites samples. The addition of CC about 7 wt% is close to optimal for compressive values based on the regression model fit. Generally, the study found that the CC contents can affect the mechanical and physical properties by improvement in interaction and modifying micro-morphology as shown in the SEM image (Figure 3). Moreover, the high desirability scores for compressive strength and modulus were 0.811 and 0.884 that indicate the agreement of the objectives. Also, the predicted responses of compressive strength and modulus were 24.31 MPa and 1.33 GPa, respectively.
Finally, the optimal formulation based on the compressive properties (both strength and modulus) is also included in Figure 6. The contour plot shows the desirability score that balances all the fitted models value of 0.843. Optimal composition for compressive properties was 49.8 wt% rPP, 38.1 wt% RWF, 7.0 wt% CC, 3.9 wt% MAPP, 0.2 wt% UV stabilizer, and 1.0 wt% Lub. In this case, the compositions for various compressive properties agreed with research work of Homkhiew, 26 leading to the optimization of several responses that depend on their prioritization.
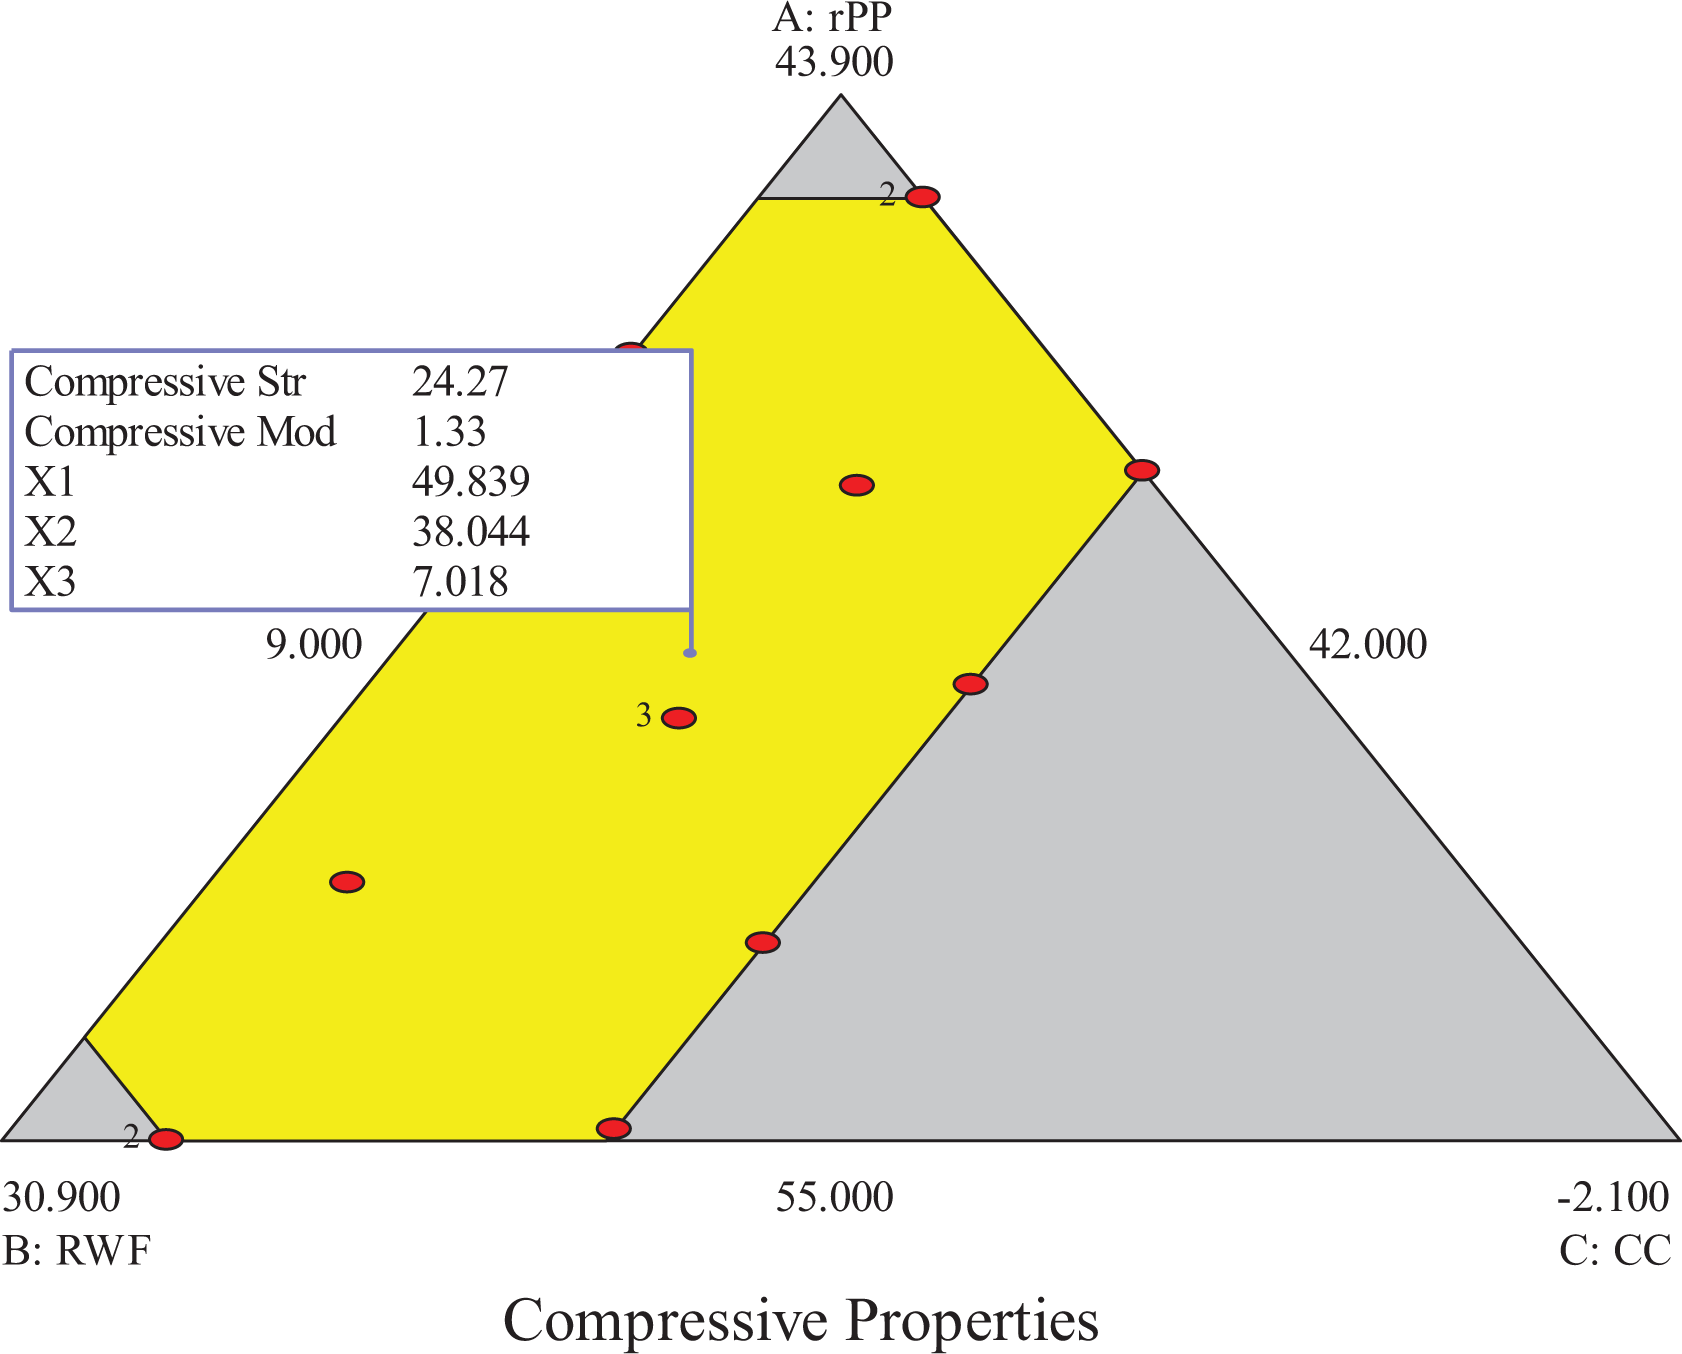
The optimal formulation of composites samples for compressive properties.
Optimization and effects of compositions on surface roughness properties
The Ra values of composites samples before and after water immersion time are summarized in Table 2. The input factors, namely rPP, RWF, and CC as filler, were analyzed to study their individual effects based on Ra and Rz. Surface roughness values (Ra and Rz) for each formulation were measured before and after immersion time using a portable surface roughness tester. After 720 h immersion time, Ra and Rz responses for all the composites samples were remeasured to evaluate the change of their roughness characteristics. The quadratic regression models for surface roughness values (Ra and Rz) after 720 h water immersion were:


The typical surface roughness (Ra and Rz) for regression equations of our WPC samples are shown in equations (7) and (8). For three main effects, the equations of Ra and Rz at all immersion times display positive coefficients for the factors of rPP and RWF and negative coefficient for the factor of CC due to the increase of Ra and Rz for surface roughness properties depending on the amount of rPP matrix and RWF content in the composite systems. Additionally, the CC contents of Ra and Rz have the largest negative coefficients values of 2.74 and 1.89 in the model fits, it means that the CC as filler had significant effects in the response models. Triangular contour plots in Figure 7(a) and (b) with three factors, namely rPP, RWF, and CC, have represented the compositions by the corners for Ra and Rz responses.
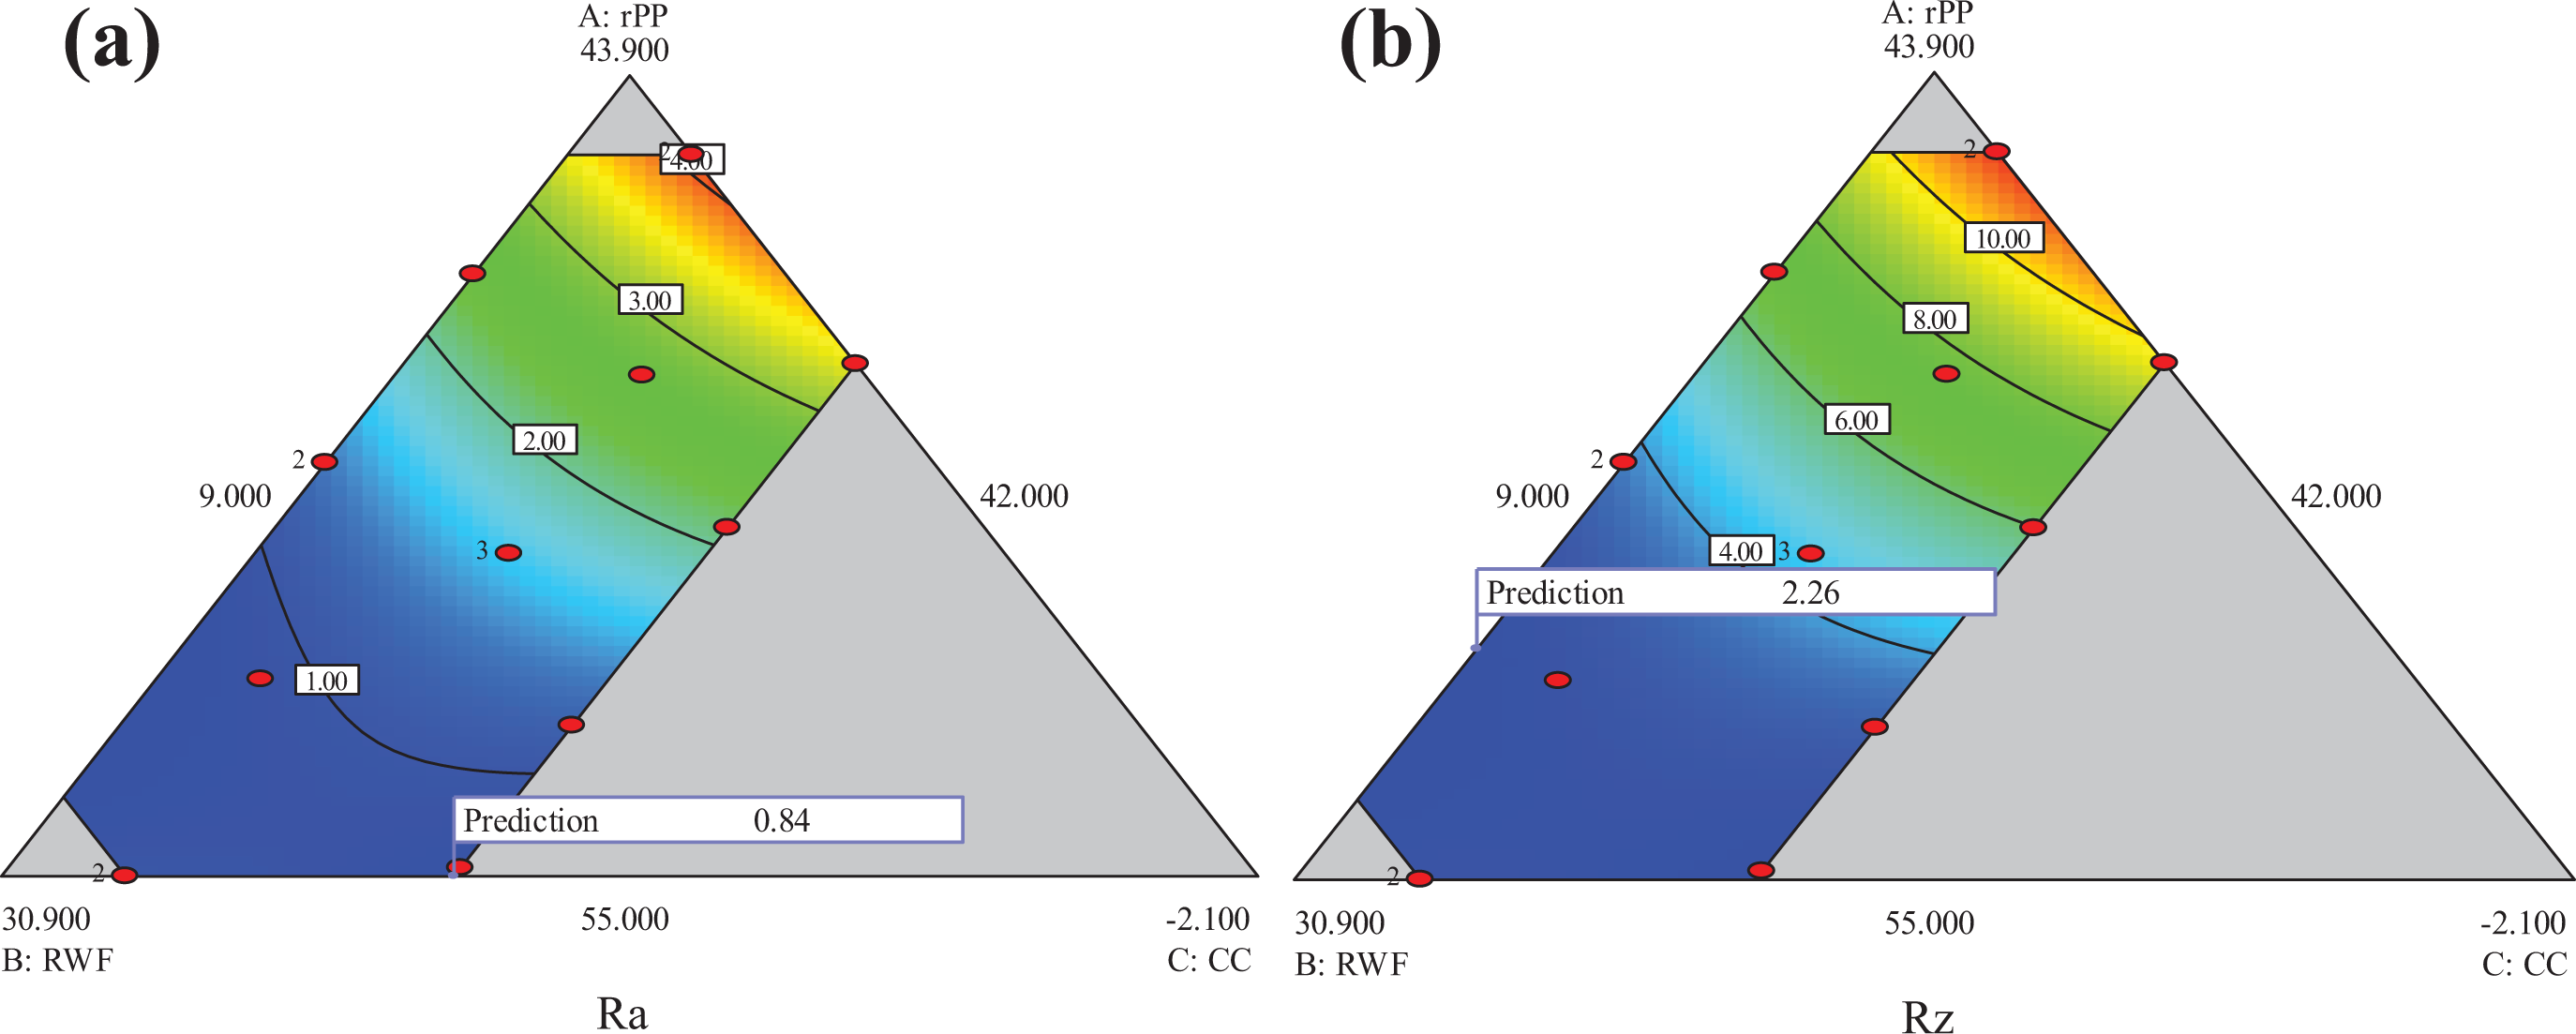
Response surface contour plots for effects of composition on (a) average roughness (Ra) and (b) mean peak-to-valley height (Rz).
The model optimal formulation and desirability score based on the quadratic regression models are also illustrated numerically in Table 5. The optimal composition for minimizing surface roughness (Ra) was 55.0 wt% rPP, 34.9 wt% RWF, 5.0 wt% CC, 3.9 wt% MAPP, 0.2 wt% UV stabilizer, and 1.0 wt% Lub with a combined high-desirability score value of 0.997. Likewise, the optimization based on these numerical models of surface roughness (Rz) was 55.0 wt% rPP, 34.8 wt% RWF, 5.1 wt% CC, 3.9 wt% MAPP, 0.2 wt% UV stabilizer, and 1.0 wt% Lub with the best desirability score value of 1.000. Ra and Rz values for the composite samples having 32–42 wt% RWF ranged from 0.65 µm to 2.88 µm and from 1.83 µm to 8.15 µm for before immersion time and ranged from 0.83 µm to 4.25 µm and from 2.35 µm to 11.89 µm for after water immersion, respectively. It appears that the Ra and Rz responses increased with the water immersion time, since the moisture could result in the swelling of the samples, making them dimensionally instable.8,31 As shown in Figure 7(a) and (b), the rPP matrix of about 55 wt% is close to the optimum value for Ra and Rz properties. Optimum content of CC as a filler of about 5 wt% slightly affects the surface roughness. Moreover, the data in Table 5 show a minimum of 0.85 µm prediction in the case of Ra value and 2.26 µm being the minimum in case of predicting Rz response.
Optimization and effects of compositions on WA and TS properties
The WA and TS are one of the most important characteristics of WPC samples exposed to environmental conditions that determine their applications. Table 2 shows the percentages of the water uptake and the thickness for the composites samples at varied compositions of immersion time, which vary depending upon the rPP, RWF, and CC as filler content. The percentages for all responses were determined to minimize the WA and TS values. It is clear that the water uptake and thickness of all composites samples increased with an increase of immersion time until reaching a certain value at a saturation point. Basically, the WA and TS properties of the samples could be concluded on several factors such as microcracks in WF, voids from mixing, and compatibility between plastic matrix and wood fiber,26,32 as shown in Figure 3. The regression model based on the WA and TS responses was most suitably described with a linear model as follows:


The equation models of WA and TS at all immersion times display positive coefficient for the factor of RWF and negative coefficients for the factors of rPP and CC, as shown in equations (9) and (10). Additionally, the RWF showed higher coefficient values than the rPP and CC due to the WA and TS of WPC samples increased with increasing WF content. This may be a result of the hydrogen bonding of the water molecules to the free OH groups showed in wood fiber cellulose component of the WPC samples and also due to the diffusion of water molecules into the WF and polymer matrix.4,8
Response model contour plots of WA and TS properties are shown in Figure 8(a) and (b). These triangular plots show the best prediction values for WA and TS responses and also the three factors compositions, namely, rPP, RWF, and CC, represent by the corner. The optimal formulation for minimum WA value was 55.0 wt% rPP, 32.0 wt% RWF, 7.9 wt% CC, 3.9 wt% MAPP, 0.2 wt% UV stabilizer, and 1.0 wt% Lub with a combined good desirability score value of 0.954. Likewise, the optimal formulation based on minimum TS value was 55.0 wt% rPP, 32.2 wt% RWF, 7.7 wt% CC, 3.9 wt% MAPP, 0.2 wt% UV stabilizer, and 1.0 wt% Lub with a high desirability score value of 1.000. Also, the best predicted values of 2.93% and 0.84% were determined in WA and TS responses, respectively. The optimal formulation, desirability score, and predicted values based on the linear regression models are presented in Table 5. Moreover, the WA and TS values of the composites samples were in the range of 2.79–5.81% and 0.96–2.33% after 720 h of the immersion. The rPP at 55.0 wt% shows the best optimum content for WA and TS responses due to the hydrophobicity of this polymer matrix.21,33 The addition of CC as filler of about 7–8 wt% gave the lowest WA and TS properties. This is because CC filler can improve the interfacial adhesion between rPP matrix and RWF reinforcement. Finally, the optimum content of the RWF was observed to be within the amount of 32.0 and 32.2 wt% after immersion and these values showed a significant effect on the WA and TS properties.
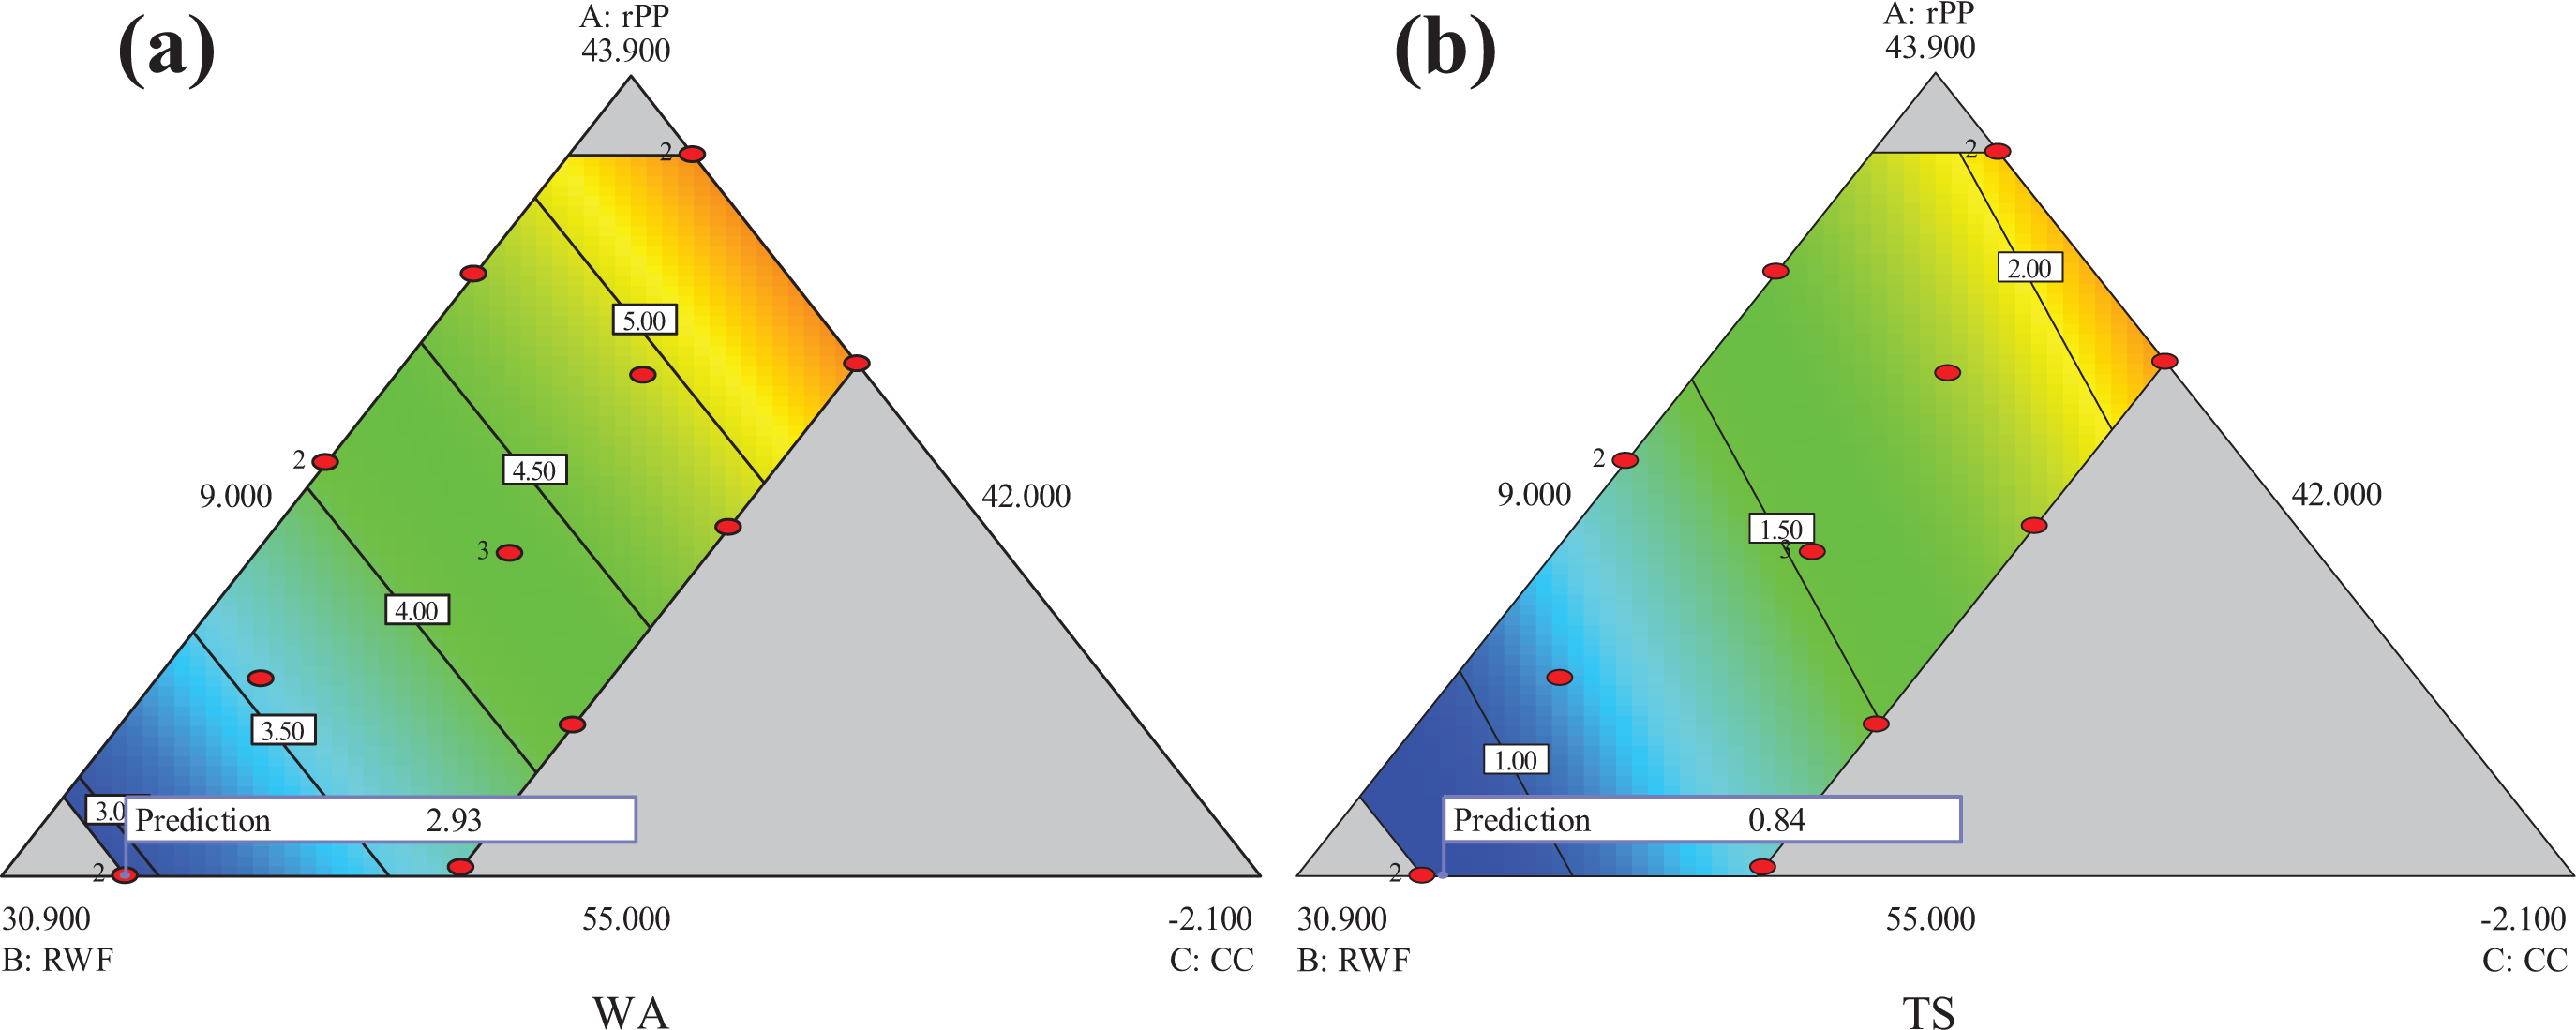
Response surface contour plots for effects of composition on (a) WA and (b) TS.
Optimization and effects of composition on TGA properties
The thermal stability of the samples was evaluated by TGA with a view to their future applications at high temperature from compression molding machine process. It is a known fact that one of the limiting factors in the use of polymer and natural fibers as reinforcement in WPC samples is their low thermal stabilities. The findings from this study also revealed that the thermal stability is gradually decreased and the degradation of polymer and WF occurs. However, the thermal properties’ degradation behavior of rPP, RWF, and CC as filler is studied using TGA weight (%) values, as presented in Table 1. Thus, it is necessary to find out the optimal conditions by the RSM method and also using ANOVA test. The linear regression model based on coefficients for TGA properties takes the following form:

The model in equation (11) shows a positive coefficient for the factor of rPP and negative coefficients for the factors of RWF and CC as filler. It is observed that the RWF factor has the highest negative coefficient in the model fits, due to the weight of TGA response depending on the content of RWF as reinforcement in the composites.
The contour plots of TGA response and predicted model are presented in Figure 9. The TGA values exhibited the thermal behavior of composites samples with different compositions. The prediction value of 11.60% was determined by the TGA properties. As can be seen from Table 5, the optimal composition for linear model based on TGA response was 55.0 wt% rPP, 32.1 wt% RWF, 7.8 wt% CC, 3.9 wt% MAPP, 0.2 wt% UV stabilizer, and 1.0 wt% Lub. Also, the high desirability score value of 0.856 was found in this model. The TGA values of the composites samples were in the range of 7.22–12.34%. As expected, the content of CC as filler from 5 wt% to 9 wt% slightly affected the TGA properties, due to the addition of filler having a positive influence on thermal properties and increases with an increase in the CC factor. 34 Furthermore, the rPP and RWF at 55.0 and 32.1 wt% showed the optimum contents for this linear model. It is observed that the RWF content of about 32 wt% was the minimum in the experimental design. This may be attributed to the RWF containing hemicelluloses, cellulose, and OH groups of the lignin, resulting in RWF content, which has a good degradation with high temperature. This is caused by the fact that the thermal stability of wood fiber mainly depends on the chemical components of wood types.35,36 These results indicated that the different factors such as rPP, RWF, and CC as filler significantly affected the thermal stability of the WPC samples.
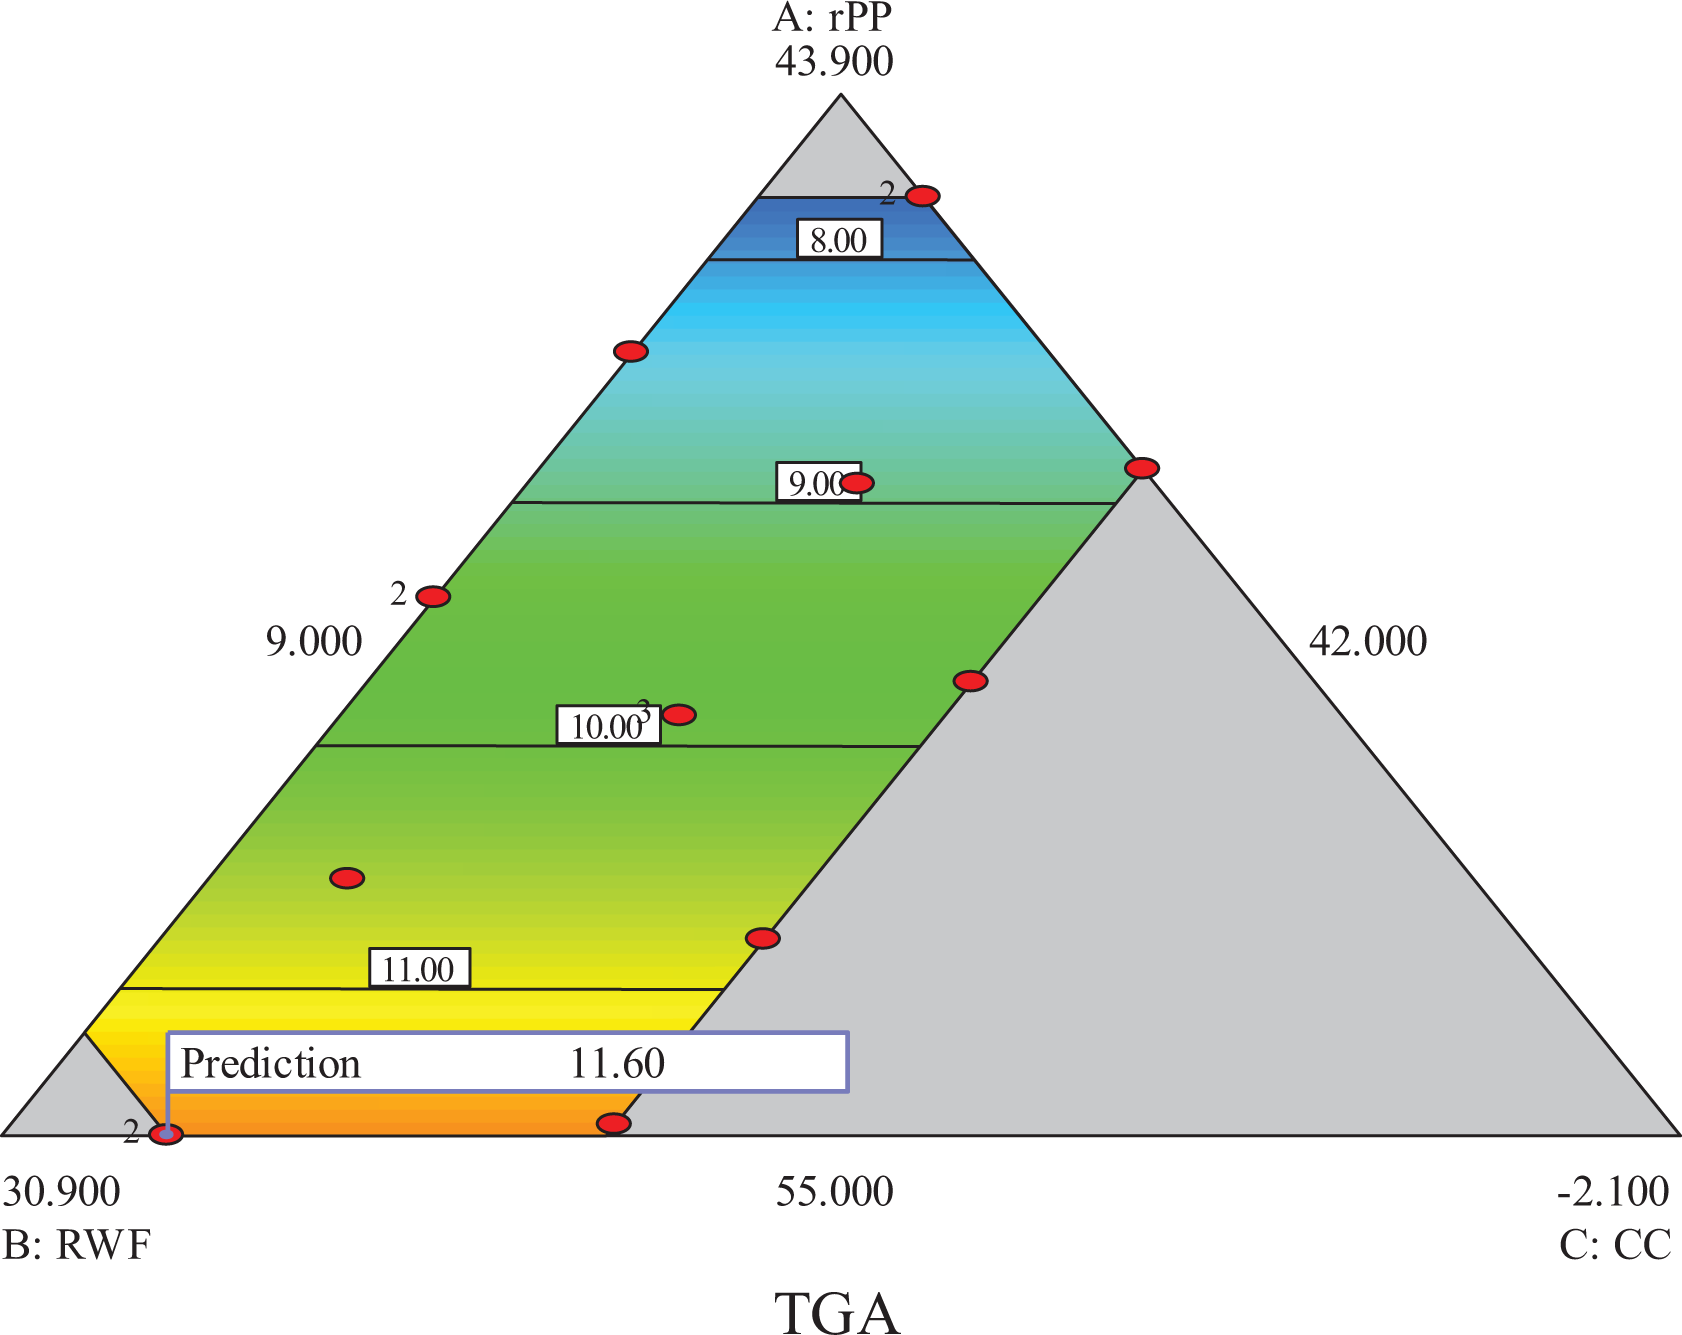
Triangular contour plots for effects of the compositions on TGA.
Optimization of the overall properties
The multiple regression models for all the responses were developed by using RSM. The optimization using all the responses was modeled which showed the compositions of composites as the most effective and important factors and using its default settings to construct a desirability score that balances all the fitted models.
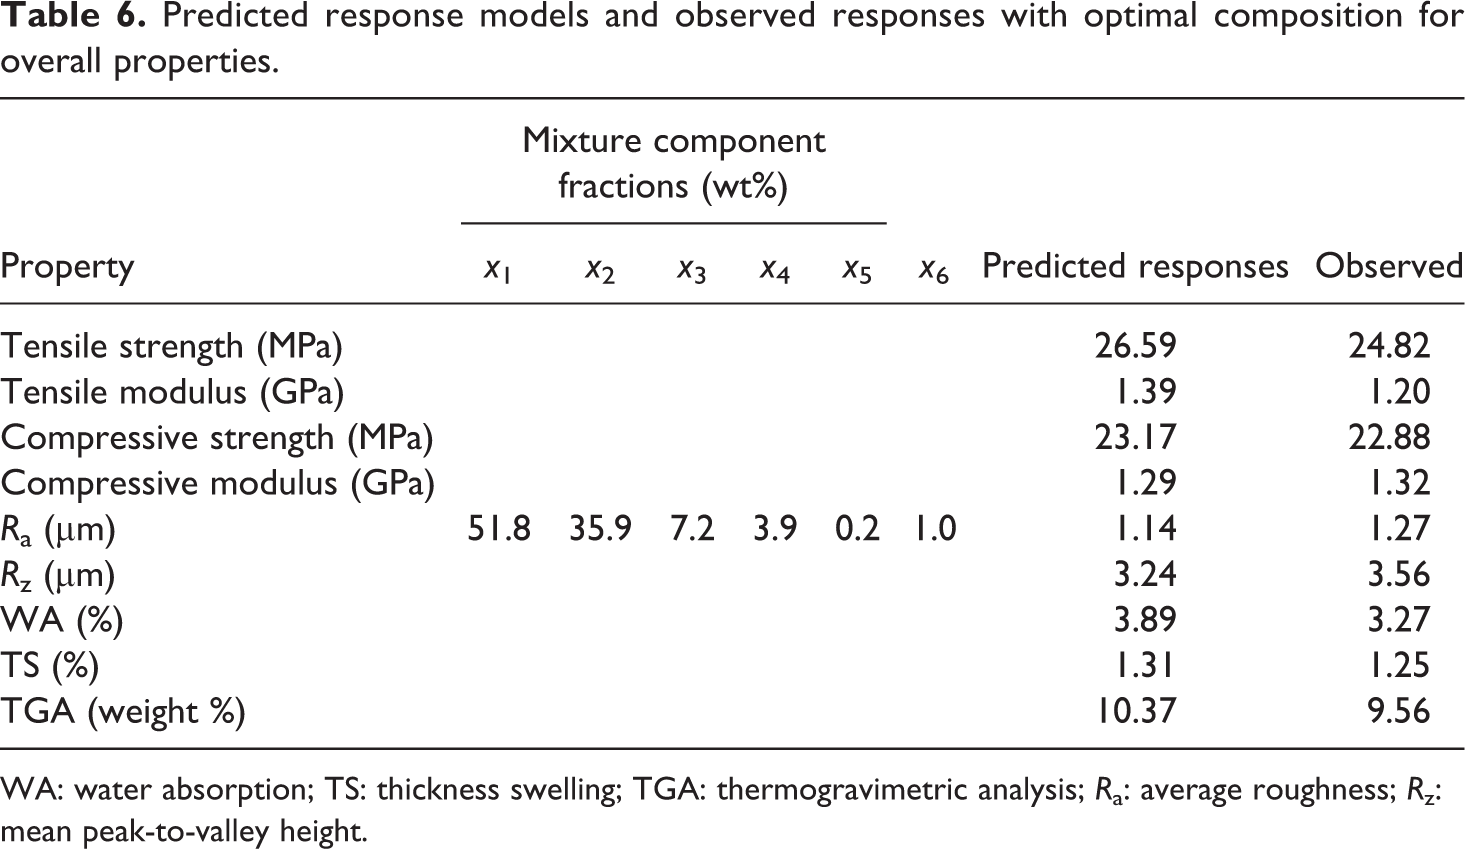
The plot in Figure10(a) and (b) displays the optimal compositions and the response surface contours of the overall desirability score. Optimal formulation for overall response models was 51.8 wt% rPP, 35.9 wt% RWF, 7.2 wt% CC, 3.9 wt% MAPP, 0.2 wt% UV stabilizer, and 1.0 wt% Lub with a desirability score value of 0.757.The regression model which generated an overall high desirability score for all the responses simultaneously was with maximum tensile strength and modulus, compressive strength and modulus, and TGA properties and minimum Ra, Rz, WA, and TS properties. The experimental results can be compared with each optimal formulation in Table 5. Additionally, the model predicted responses and observed values are also included in Table 6. The composite samples with five replicates were tested with this formulation.
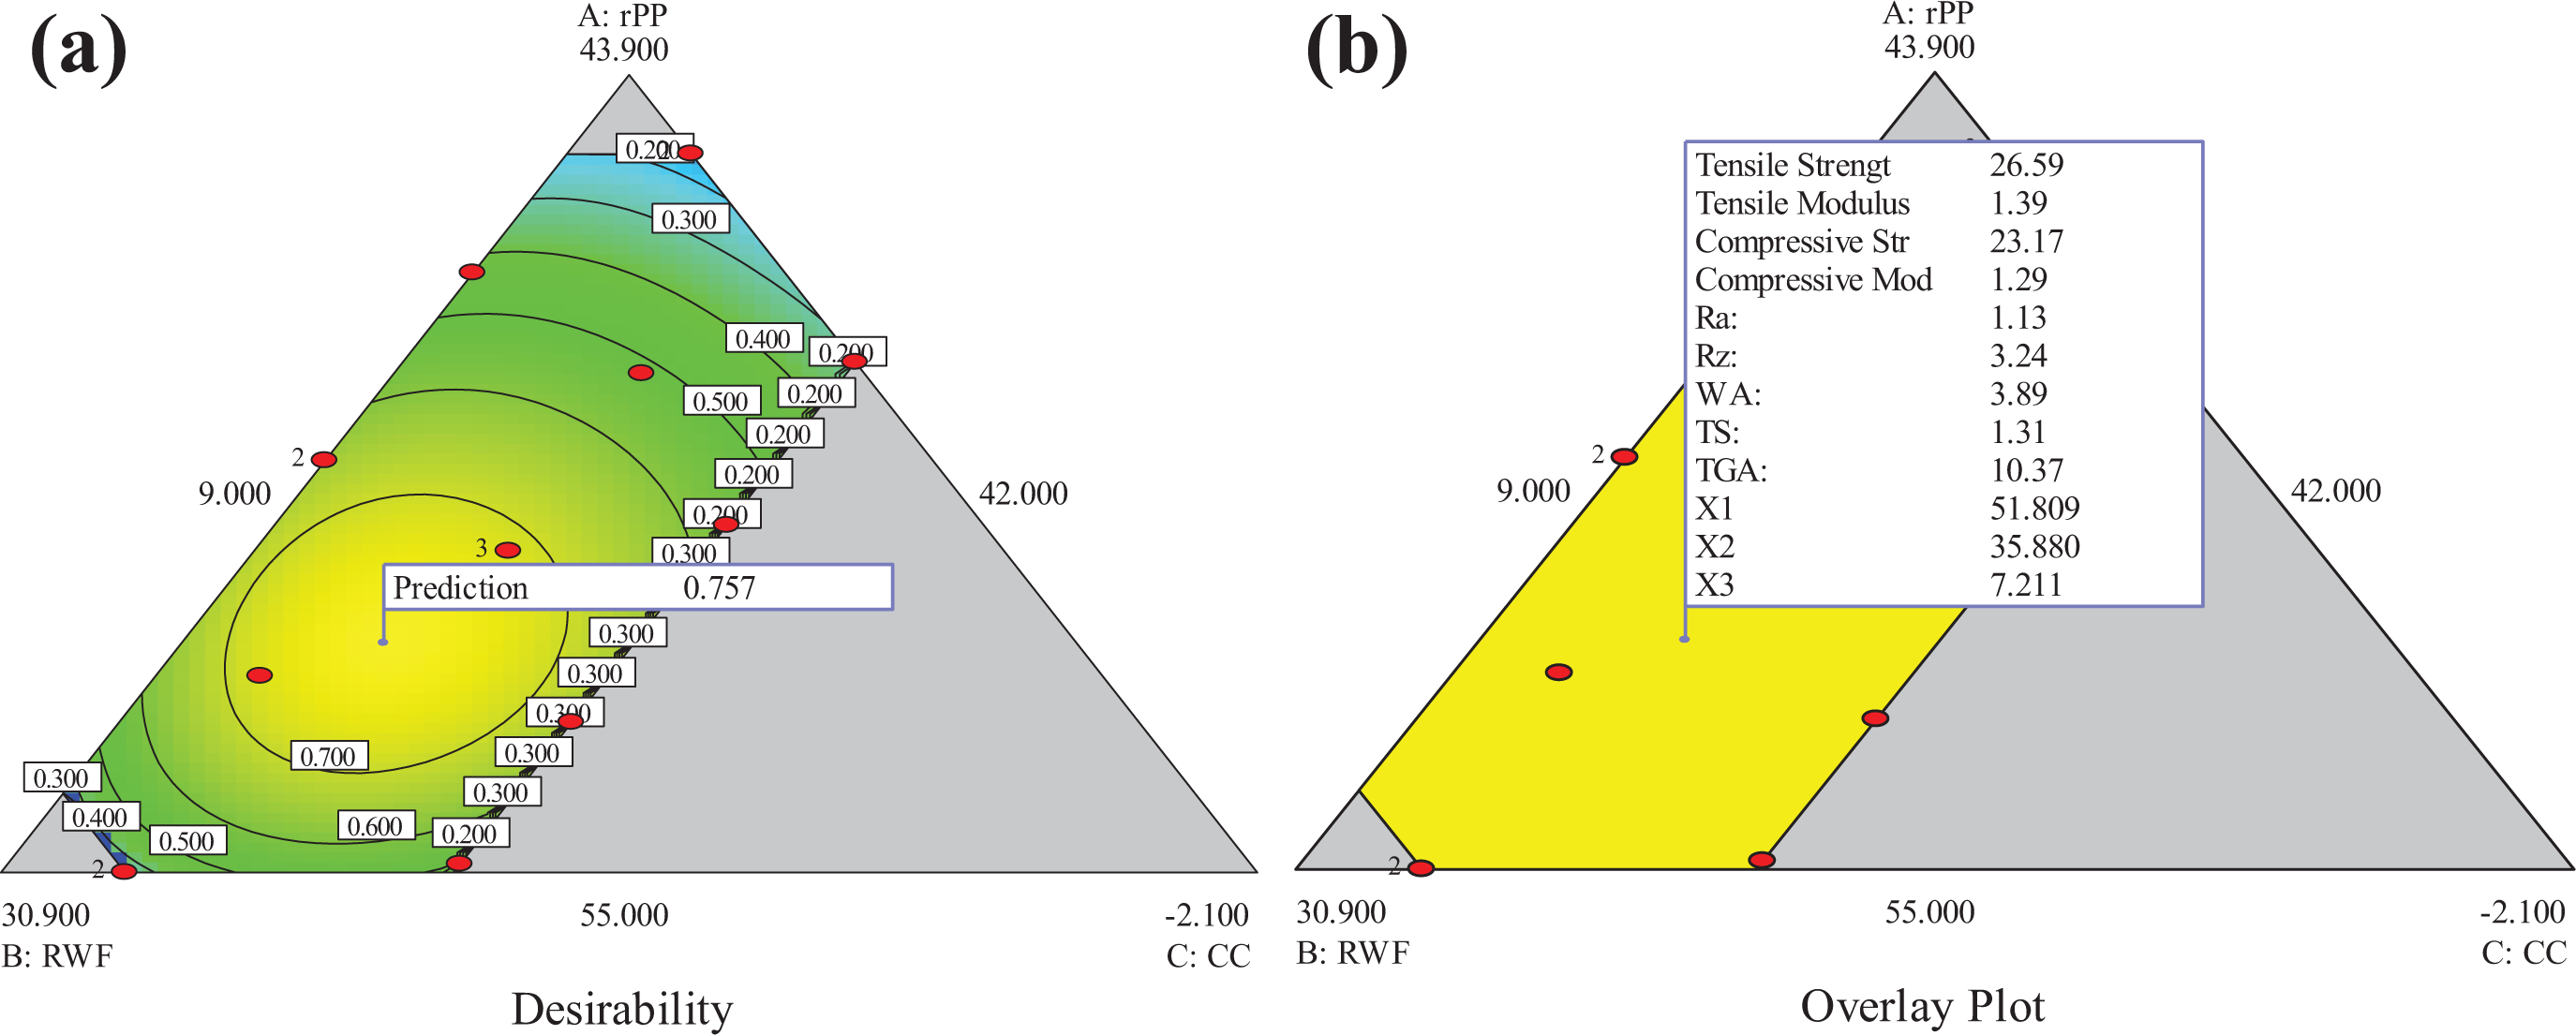
The optimization for overall properties: (a) desirability score and (b) overlay plot.
Predicted response models and observed responses with optimal composition for overall properties.
WA: water absorption; TS: thickness swelling; TGA: thermogravimetric analysis; Ra: average roughness; Rz: mean peak-to-valley height.
Moreover, the main effect plots, namely rPP (45 ≤ x1 ≤ 55), RWF (32 ≤ x2 ≤ 42), and CC (5 ≤ x3 ≤ 9), in Figure 11 show the optimum point for optimal formulation. These plots reveal the level to be chosen for optimum factors such as the area with the highest point on the response contour plots. The results reveal that the optimum content of rPP, RWF, and CC as filler was 51.8 wt%, 35.9 wt%, and 7.2 wt%, respectively.
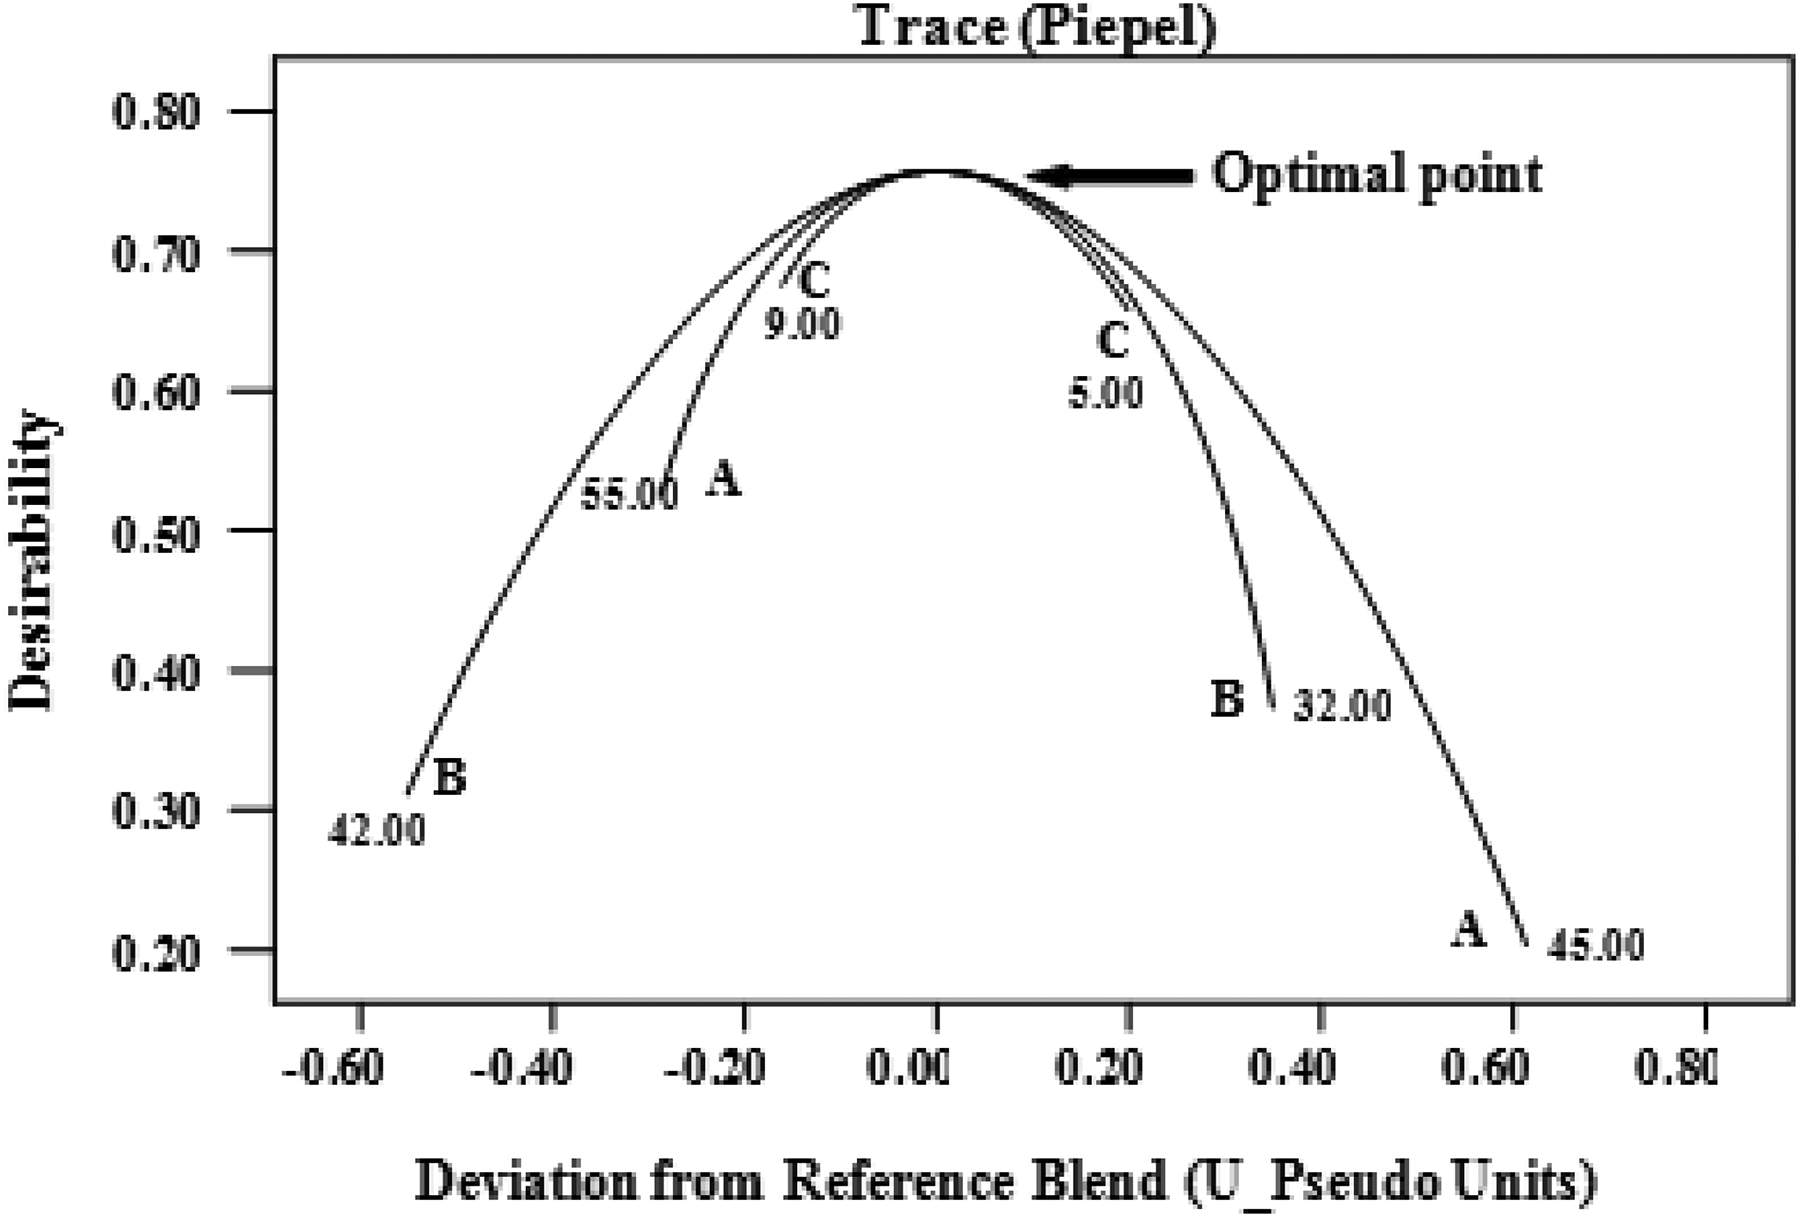
Main effects plot for optimal composition: (a) rPP (45–55 wt%), (b) RWF (32–42 wt%), and (c) CC (5–9 wt%).
Conclusions
The effects of compositions on all the regression models were performed with the D-optimal mixture design (Design-Expert software). The overall compositions for all the responses were developed for the standard 16 experimental run models by using the ANOVA analysis and also optimized by using the RSM. The different input factors, namely, rPP, RWF, and CC as filler for composite samples, significantly affected tensile strength and modulus, compressive strength and modulus, surface roughness, WA, TS, and TGA. Theoretically, both WA and TS clearly increased with an increase in the RWF content. Likewise, the surface roughness values for samples having 34–35 wt% were determined optimum values for RWF contents based on the regression fit, due to the percent in roughness values enhanced with increase wood content in composites samples. Additionally, the RWF and CC factors ranged from 32 wt% to 42 wt% and 5 wt% to 9 wt% increased the tensile and compressive properties in composite samples. Based on the findings in this work, it could be concluded that the shape, size, and content of the CC as filler could affect the mechanical and physical properties of WPCs. Finally, the TGA stability of response models was significantly affected by the rPP and RWF, due to the thermal stability decreased with a higher content of wood fiber in the polymer matrix. It is clear that such optimal formulation was therefore suggested in the overall response model for the mechanical, physical, and thermal properties in WPCs with CC filler.
Footnotes
Acknowledgements
The authors thank the Department of Natural Resource Ecology and Management, Oklahoma State University, USA.
Funding
The author(s) disclosed receipt of the following financial support for the research, authorship, and/or publication of this article: This research was financially supported by the Thailand Research Fund (TRF) through the Royal Golden Jubilee PhD Program (grant no. PHD/0121/2558), the Prince of Songkla Graduate Studies Grant, the Rubberwood Technology and Management Research Group (ENG-54-27-11-0137-S) of Faculty of Engineering, Prince of Songkla University, Thailand.