
Abstract
Sodium dithionite is the most commonly-used reducing agent for vat dyeing of cotton fabric. This research focuses on the use of orange peel extract (OPE) as a new reducing agent for vat dyeing cotton fabric to avoid the toxic chemicals released from sodium dithionite. The dyeing experiments were carried out in a batch system to optimize alkali concentration, OPE concentration, and vatting temperature via response surface methodology (RSM). The optimal color yield was achieved at 11.97 g/L of OPE, 1.18 g/L of alkali, and 44 °C vatting temperature. Fabric dyed under optimized dyeing condition using OPE was compared with a standard conventionally dyed fabric using sodium dithionite as the reducing agent. A uniformly dyed fabric with comparable color yield was obtained. Fastness properties were not affected by the use of OPE.
Introduction
Vat dyes are one of the important dye classes for the coloration of cellulosic fibers including cotton. 1 Dyeing cellulosic fibers with vat dyes gives excellent fastness properties in terms of wash, rubbing, and light. 2 However, vat dyes are water-insoluble in their original form and show zero affinity for cellulosic fibers in such a state, which makes the dyeing process complex. Before dyeing, vat dyes have to be converted into the water-soluble (i.e., leuco enolate) form, which shows substantivity towards fibers. This conversion is called the vat-ting process, which is essentially the reduction of vat dyes. 3
Sodium dithionite (commonly known as hydrose) is used predominantly as a reducing agent in the textile industry. 4 Hydrose is not recyclable, therefore disposal of dyeing baths and rinsing water containing hydrose incurs high costs and various problems with the effluent. 5 Decomposition of hydrose produces sulfur compounds (e.g., Na2S and NaHS) as by-products, which can be converted into hydrogen sulfide and thereby pollute the environment. 6
Researchers have attempted to introduce eco-friendly reducing agents or other methods for the reduction of vat dyes. Some alternative chemicals, such as enzymes, 3 acetole, 7 α-hydroxycarbonyl compounds, 8 and the combination of ferrous sulfate and zinc 9 have been proposed. Different direct and indirect electrochemical methods were also tried for reduction of vat dyes such as a redox mediator, 3 indigo radical, 4 electrocatalytic hydrogenation, and use of a cathode made with graphite granules. 5 Different physical methods were also reported for vat dyeing. For example, the ultrasound enhanced vatting degree of indigo with α-hydroxyacetone and use of a UV-stabilized sodium dithionite composition in the vatting process. 3 All methods have some environmental benefits, but no other reducing agents have replaced hydrose. 3
Many researchers have shown that food seeds and peels have antioxidant properties (e.g., apples, white grapes, and oranges). 10 Recently, banana peel extract, which contains a large quantity of antioxidants, was applied for vat dye reduction. 11 Orange peel, an important source of antioxidants, 12 can be a potential candidate for vat dye reduction. In this study, the effect of orange peel extract (OPE) as a reducing agent on vat dye uptake ability was investigated by observing color yield and fastness characteristics using C.I. Vat Red 13 for cotton fabric dyeing (Fig. 1). Response surface methodology was applied to optimize the color yield.
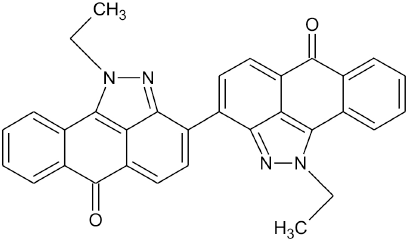
Chemical structure of C.I. Vat Red 13.
Experimental
Materials
A local textile mill (BHB, Bangladesh) provided a 100% cotton single-jersey plain knitted fabric with an areal density of 185 g/m2. The fabric was scoured and bleached in preparation for dyeing. No further preparatory processing was performed. To prepare OPE as the reducing agent, fresh oranges (Citrus reticulata) were purchased from a local market near Dhaka, Bangladesh. Techthrene Vat Red 6B (C.I. Vat Red 13) was obtained from Dysin-Chem Ltd. Reagent-grade dehydrate of sodium dithionite, methanol, sodium hydroxide, sodium carbonate, and 35% hydrogen peroxide were obtained from Merck as a reducing agent, solvent for orange peel extraction, alkali, and oxidizing agent, respectively. Huntsman supplied the dyeing auxiliary, Albatex Vat, as a dye leveling agent. For washing fastness tests, ECE detergent (James Heal), which is free from optical brightening agent, and sodium perborate (Merck) were used. For assessing the fastness rating, gray scale for color change (SDC, UK), gray scale for staining (SDC), and multifiber fabric (diacetate and wool) containing wool and acetate were used.
Methods
Orange Peel Extraction
OPE was prepared according to the method of Park et al. 12 First, the oranges were washed with tap water and peeled. The orange peels were cut into small pieces and dried in the sun. Then the dried peels were ground with a high-speed hand blender into a finely powdered form. The dried peel powder was then extracted with methanol at a mixing ratio of 1:8 (w/v) in a Soxhlet extractor for 4 h at 80 °C. Finally, the OPE was prepared for use by drying in an oven drier at 55 °C for 30 min.
Response Surface Methodology
Two different strategies can be used for optimization of a production process, namely simplex optimization and response surface methodology (RSM). The simplex method can only approximate the optimum, whereas RSM is capable of determining the exact optimum. Moreover, it can graphically illustrate the relationship between different experimental variables and the responses.
RSM is a collection of statistical and mathematical techniques. It is mainly used for developing, improving, and optimizing processes. RSM consists of three parts. First, experimentally investigated independent variables are selected (i.e., the space of the process). Secondly, an appropriate mathematical relationship between process variables and response are statistically established. Thirdly, optimal process conditions for obtaining desirable values of the response are determined. 13 The Box-Behnken design (BBD) is one of the experimental design tools based on RSM, which utilizes only three levels to develop a quadratic model. 14 The main advantage of BBD over other designs, such as full factorial design and central composite design, is that BBD allows the calculation of a response surface using a minimum number of experiments.
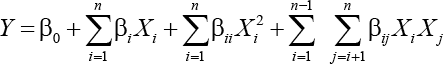
BBD was used for modeling the optimal conditions for vat dyeing of cotton using OPE as a reducing agent. The performance of process (dyeing) was evaluated by analyzing the response (color yield, k/s) as a function of the experimental independent variables (dyeing parameters). This BBD used the following three dyeing parameter variables: alkali concentration (X1:10, 30, and 50%), vatting temperature (X2:12, 15, and 18 kV), and OPE concentration (X3: 0.1, 0.3, and 0.5 mL/h), for a model to describe the response pattern of the dependent variable. Three factors each at three levels gave 15 experimental runs including three replicates at the center point. A pure error sum of squares was estimated from those three replicates at the center of the design. The full quadratic equation used for this model is shown in Eq. 1.
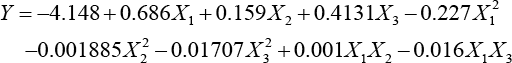
Y is the predicted response, β0 is the intercept, βi are linear coefficients, βii are quadratic coefficients, and βij are the coefficients of interaction. The independent variables are coded as Xi and Xj, while n is the number of design variables.
Minitab 17.0 statistical software was used to perform the regression analysis, p-values were used to determine the significance of each coefficient. Coefficients were considered as statistically significant when their p-values were less than 0.05. The coefficients of determination (R 2 ) and the analysis of variance (ANOVA) were used to assess the accuracy of the model. Predictions were made for the response (k/s values) using this model. Experimental and predicted values were then compared to validate the model, which also demonstrated the speculation ability of the model for anticipating new conditions inside the design space. 3-D surface plots and 2-D contour plots were generated to show the connections between the response and the dyeing parameters. The optimal dyeing parameters were determined by solving and analyzing the regression equation and the contour plots, respectively.
Dyeing
All dyeing experiments (Table I) were carried out batch-wise using a laboratory dyeing machine (Ahiba IR, Datacolor). The machine has 15 pots, each with a capacity of 300 mL, set on a circular revolving disk. Three infrared lights fixed in the machine chamber were used for heating dye liquors. All vattings for 20 min were completed prior to the start of the dyeing, started by the addition of the fabric, at varying alkali concentrations, temperatures, and OPE concentrations (Table I). Each dyeing pot was prepared with 200 mL dye liquor containing 1 g/L levelling agent, at a material to liquor ratio (LR) of 1:20 for a 2% dyeing shade (owf). Dyeing was started after adding 10 g of fabric sample to each pot and completed according to the dye manufacturer recommended time-temperature profile shown in Fig. 2. In brief, the rotational speed of the revolving disk was set to 65 rpm and temperature was increased to 30 °C from room temperature (RT) at a rate of 5 °C/min. The temperature was kept constant for 30 min for the complete exhaustion of dyes and chemicals onto fabric surface. Afterwards, the temperature was increased at a much slower rate of 1 °C/min to 70 °C to avoid any sudden rush of dye diffusion into the fiber. Dyeing was continued for 1 h, as it was found from preliminary tests (not reported) that the dyebath had reached equilibrium within an hour. Subsequently, dyed fabric was collected from the pot. Fabric was then padded using a laboratory padder (HF horizontal padder, Mathis) to remove excess dye liquor containing unfixed dyes and chemicals. The fabric samples were oxidized in a solution of 35% hydrogen peroxide at RT for 20 min to convert the dyes into their original insoluble form. At last, the fabrics were rinsed with cold water followed by drying in a dryer for 90 min at 60 °C.
Experimental Design of Independent Variables using BBD for Fabric Dyed with OPE Method
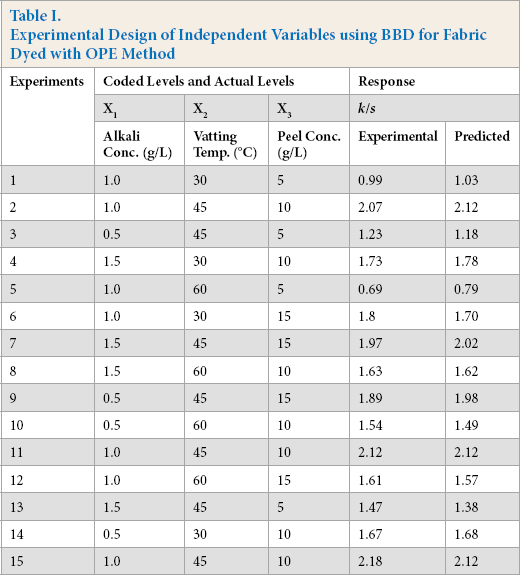
Time-temperature diagram of vat dyeing.
A fabric sample was also dyed for 1 h at 70 °C as a control using the conventional reducing agent. Hydrose was used as a reducing agent with the following recipe: hydrose (3 g/L), alkali (5 g/L), vatting temperature (70 °C), and vatting time (20 min), at a LR of 1:20 and pH = 12.5. The control dyed fabric was given similar oxidation and after wash treatments.
Color Yield
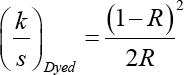
The reflectance curve between 400 and 700 nm wavelengths was obtained for the dyed specimen with a Datacolor 650 spectrophotometer (Datacolor) equipped with a pulsed xenon lamp filtered to approximate D65 diffuse illumination and an 8° viewing geometry to evaluate the color yield. The reflectance value (R) was obtained from the peak value of the curve and the ratio of light absorption k and scatter s was then determined using the Kubelka–Munk equation (Eq. 2).
Levelness
Levelness or uniformness of the dyed sample can be expressed by the relative unlevelness index (RUI). RUI was checked using the spectrophotometer and samples were graded according to the formula proposed by Chong et al. 15 The reflectance value (R) of the dyed fabrics was evaluated at 20 randomly selected spots over the visible wavelength band or 400-700 nm at 10 nm intervals for calculating the RUI.
Color Fastness
The ISO 105-C06 (C2S):2010 standard was used to evaluate washing fastness of the dyed samples. 16 The ISO 105-X12:2001 standard was used to evaluate rubbing fastness (dry and wet). 17
Fabric Strength
The bursting strength of the dyed and undyed fabrics was determined according to ASTM D3786 using a hydraulic bursting strength tester (Mesdan Lab). 18
Results and Discussion
Development of the RSM Model
The Box-Behnken design (BBD) was used to identify the effect of dyeing parameters on k/s values of the dyed fabric using OPE as the reducing agent. Table I shows the predicted values and corresponding experimental measurements for the k/s values at each design point.
Table II shows the result of the ANOVA. Factors with p-values ≤ 0.5 were considered significant. p-values also determine the statistical significance of the model. Table II shows that the one linear coefficient, OPE concentration (X3) had a significant effect (p < 0.05) on the mean color yield. Two of the quadratic coefficients (X2 2 and X3 2 ) also exhibited a significant effect on the mean color yield at p < 0.05.
ANOVA and Estimated Regression Coefficients for the k/s Response Surface Quadratic Model
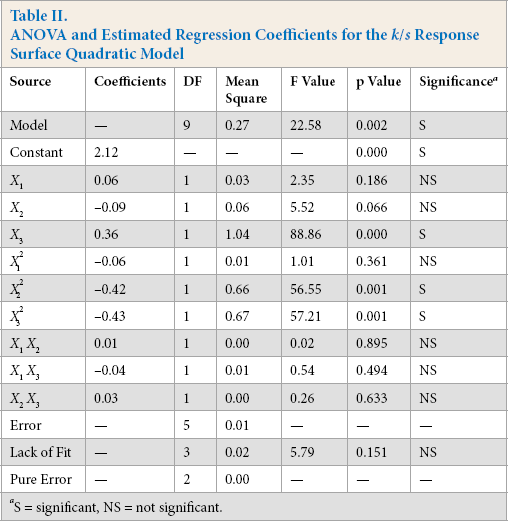
S = significant, NS = not significant.
The adequacy of the fitted model was confirmed using the coefficient of determination (R 2 ), which indicates the percentage of the variability of the response that the regression model generated. Higher values of R 2 and Adj-R 2 indicate the extent to which the model matches experimental values. The predictive model for k/s value had a coefficient of determination (R 2 ) of 97.60 and adj-R 2 of 93.28. This showed that the model used was highly effective in describing the measured response. Thus, changes in k/s values were explained reasonably well by the BBD model based on RSM.
Moreover, S was used to assess how well the model describes the response. S of a model represents the standard deviation of the distance between the experimental data and the fitted data. It shows how far the experimental data lies from the fitted data. A lower S-value shows that the model describes the response better. The S value for the k/s model values was calculated as 0.1. This value of S indicated that the standard deviation of the k/s values around the fitted values was as low as 0.1.
Lack of ft or model associated errors was computed by comparing the residual error (difference between observed value and fitted value) to the pure error (from triplicates at the center). If the lack of fit is significant (p ≤ 0.5), it confirms that the model does not properly ft the experimental data. The lack of ft was computed and reported in Table II. The lack of ft was large (0.151, p > 0.05), which confirmed that the model fit satisfactorily.
For obtaining a simple model with less parameters, negligible terms were removed from the model. By eliminating negligible terms (very small) from the full quadratic model, a mathematical expression was determined which includes linear, quadratic, and interaction terms for an actual value of each parameter, as shown in Eq. 3.
Adequacy of the Model
To confirm the ability of this sufficient approximation of the fitted model to the actual values, its adequacy was checked. The optimization of the fitted response surface is not reliable until the model demonstrates a satisfactory ft. 19 The diagnostic plot of predicted vs. experimental values was used to confirm that the model performed satisfactorily. The plot can also be used to understand the relationship between predicted and experimental values. Fig. 3 shows the diagnostic plot of the response (i.e., k/s values) for the dyed fabrics. The data points on the plot lie fairly close to the straight line, which indicates that the experimental data and model data were in close agreement. Thus, the diagnostic plot confirmed that the model used successfully identified ideal operating conditions.
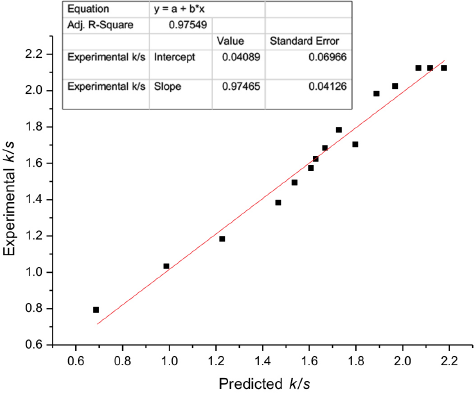
Plot of the model predicted response versus the experimentally obtained response.
Verification Test
The normal probability plot of the residual is a tool for verifying the assumption that the residuals are normally distributed. The residuals are obtained from the difference between the estimated value of the response that is fitted under the theoretical model and the experimental value. To meet the assumption requirement, the normal probability plot of the residuals should approximately give a straight line. The normal probability plot (Fig. 4) shows that the residuals formed a straight line, suggesting that the errors were normally distributed.
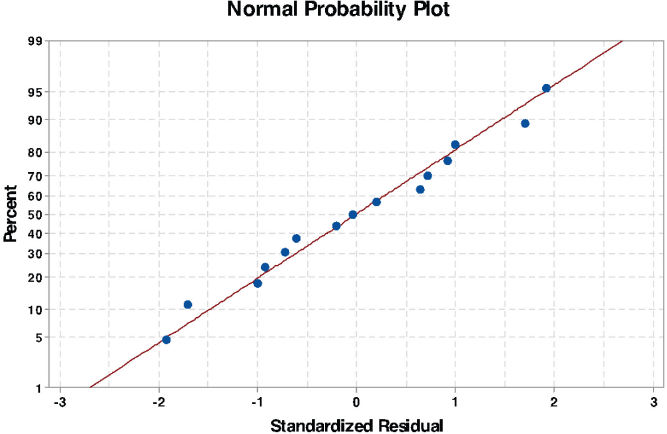
Normal probability plot of standardized residual for testing the normality assumption.
Determination of Optimal Conditions
The goal for mean k/s determinations was set to maximize the k/s values at the experimental boundaries of the dyeing parameters. The optimal condition with a composite desirability value of 1 that yielded a maximum mean k/s value was 1.18 g/L alkali, 44 °C temperature, and 11.97 g/L OPE. Since the model predicted this optimal condition, it was necessary to verify the correctness of the prediction. Therefore, one dyeing experiment using the optimized conditions, along with a number of further dyeings (which remain in the design space, but were not tested before), was carried out and the agreement between predicted and observed responses was verified.
Influence of Processing Variables on Mean k/s Values
Effect of Alkali Concentration
To investigate the effect of alkali concentration on k/s values (color yield) of the dyed fabric, dyeing was carried out with different alkali concentrations ranging between 0.5 and 1.5 g/L. The main effect plot for the mean k/s values of the dyed fabric is shown in Fig. 5. This single factor plot suggested that there was a steady increasing trend in k/s values with increased content of alkali up to 0.5 g/L followed by a slowly increasing trend up to 1.19 g/L where the k/s value was at the maximum. The k/s values then started to decrease slowly with further increases in NaOH concentration. Adeel et al. 20 reported the similar behavior of alkali in vat dyeing. The influence of alkali on the initial increase in k/s values can be attributed to the solubility of the vat dye. An alkaline medium is required for the solubilization and stabilization of reduced vat dye in an aqueous medium. Alkali less than a minimum amount will fail to solubilize and stabilize reduced dyes adequately in the dye bath, leading to lower dye exhaustion. 21 The effect of alkali on the final decrease in k/s values can be explained by the dye bath not being at equilibrium. 20 An excess amount of NaOH may disturb the equilibrium and favor the desorption process, resulting in a poor color yield.
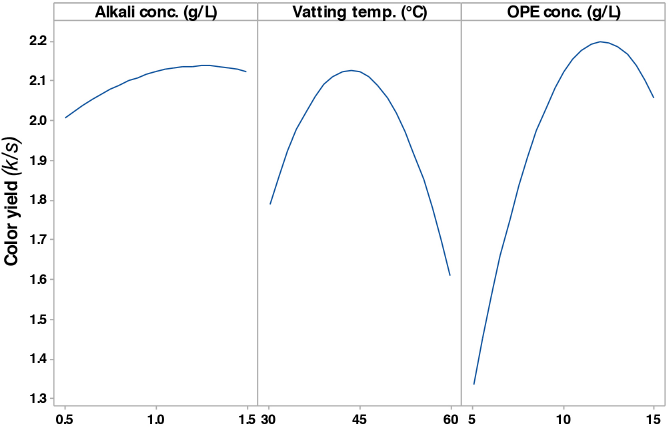
The main effect plot for the mean color yield (k/s) of the OPE vat dyed fabric.
Effect of Vatting Temperature
Fig. 5 shows the changes of k/s values (color yield) in response to the vatting temperature change from 30 to 60 °C. The k/s values increased rapidly from about 1.8 to 2.1 with an increase in temperature from 30 to 44 °C, followed by a strong downward trend with further temperature increases. The initially poor k/s value may be due to insufficient reduction of the vat dyes. Dye molecules have low kinetic energy at low temperature. A gradual rise in temperature during vatting increased the kinetic energy of dye molecules and accelerated dye reduction. Therefore, the k/s values of the dyed fabric at low vatting temperatures were low. A maximum k/s value was achieved when the vatting temperature was about 44 °C. However, vatting above 44 °C resulted into lower k/s values, probably due to dye over-reduction. Over-reduced dyes tend to remain in the dye bath, giving rise to lower dye exhaustion, greater dye wastage, and finally, lower k/s values. 22
Effect of OPE
The influence of OPE (between 5 and 15 g/L) on k/s values is shown in Fig. 5. Like vatting temperature, k/s values increased rapidly with increased OPE concentrations up to a certain limit. Above this 12 g/L OPE limit, lower k/s values were obtained. This may be explained by the subsequent over-reduction of dye by OPE. OPE caused the rapid conversion of keto substituted colorant (water-insoluble) into water-soluble enolate compound (leuco form) by reduction, the leuco form being more substantive as well as absorbable onto cellulose, resulting in higher k/s values (Fig. 6). However, over-reduction due to the excessive use of OPE might be the reason for the lower k/s values obtained when the concentration of OPE exceeded 12 g/L. 23
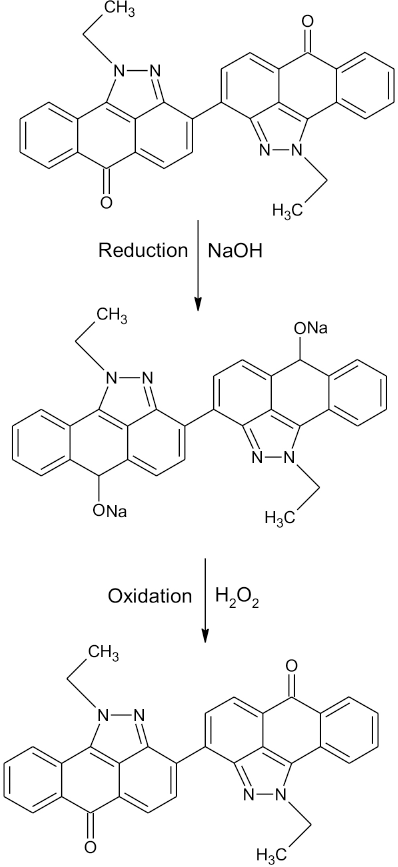
Reduction and oxidation of Vat Red 13.
Interaction among Operational Variables
3-D surface and 2-D contour plots are useful for understanding the interaction between independent variables, since plots can display the changes of the response as a function of two independent variables simultaneously. Therefore, surface and contour plots were used to evaluate the effect of the dyeing parameters on mean k/s values and to identify the optimal conditions required to maximize the k/s value.
Fig. 7 shows the estimated surface plots for k/s value as a function of the independent parameters. In the figures, two of the three independent variables were plotted on the x- and y-axes, and the other independent variable was set constant at the center point. Plots showed the presence of a curvilinear pattern in the experimental area, which implies that the optimal point was located inside the experimental design space.
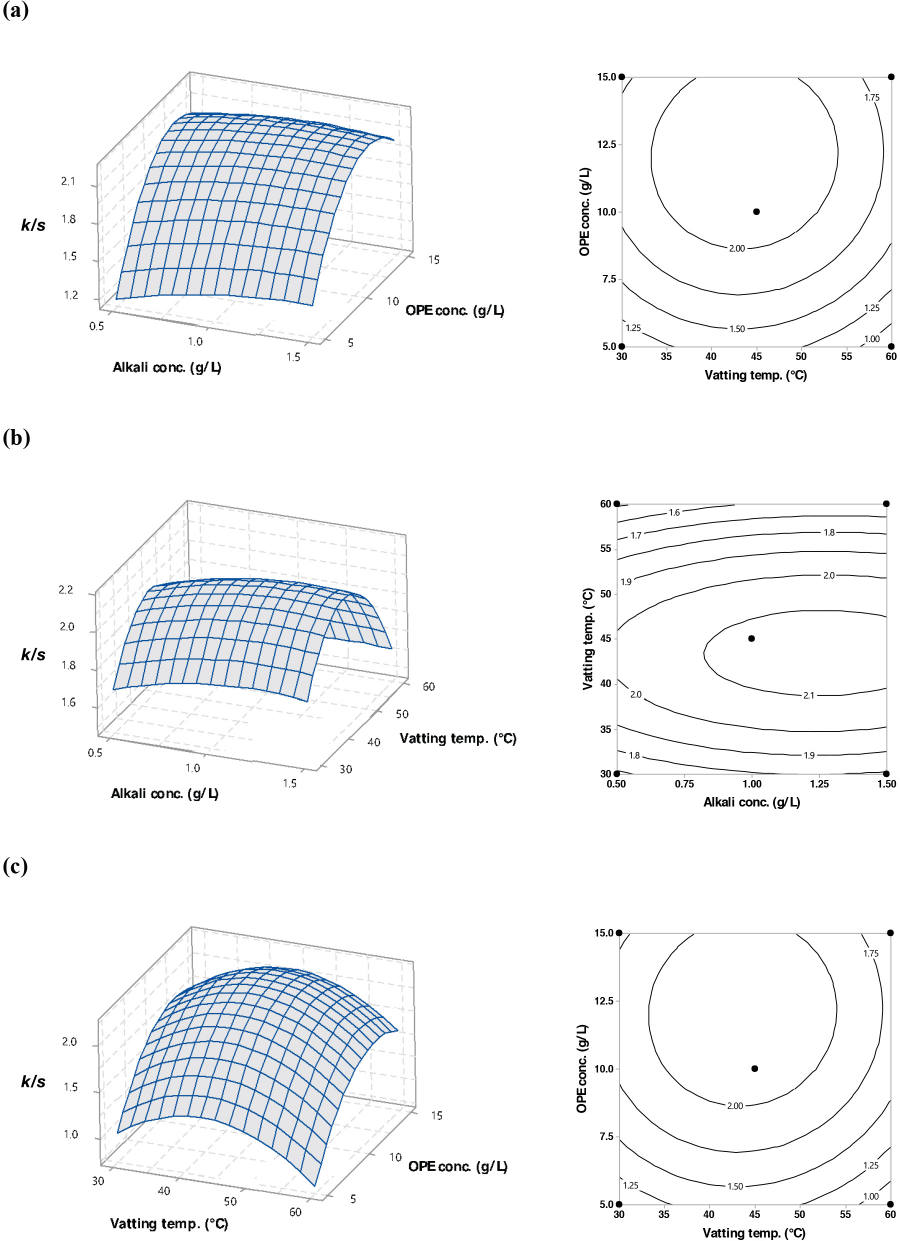
Surface plots (left) and contour plots (right) of k/s as a function of: (a) alkali concentration and OPE concentration, (b) alkali concentration and vatting temperature, and (c) vatting temperature and OPE concentration. Constants: alkali concentration (1.5 g/L), OPE concentration (10 g/L), and vatting temperature (45 °C).
The effect of alkali and OPE concentrations, and alkali concentration and vatting temperature on k/s values are shown in Figs. 7a and b, respectively. k/s values increased slightly and in a linear fashion with increased alkali concentrations for all levels of OPE concentrations and vatting temperatures. However, slight decreases in k/s values were observed when alkali concentrations were greater than 1.2 g/L. Figs. 7a and c captured the interactions of OPE concentration with alkali concentration and vatting temperature, respectively, on color yield. The curvilinear shape of the plots suggested that k/s values increased with increased OPE concentration to a threshold limit; above that limit, k/s values decreased. A similar effect on color yield was observed for the interaction of vatting temperature and alkali concentration (Fig. 7b) or OPE concentration (Fig. 7c). Moreover, the curves were more prominent in this case. However, according to Table II, the interaction terms (X1X2, X1X3, and X2X3) were not statistically significant.
Confirmation Test
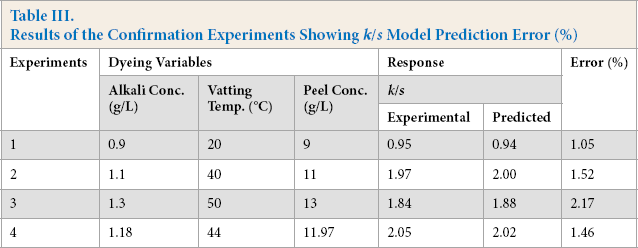
Once the model was established, it was necessary to verify that the created model was able to describe the color yield (k/s) in the entire design space. Four additional experiments were conducted including optimized conditions to verify the adequacy of the predicted model. The test conditions were selected in such a way that they stayed inside the design space, but were not used in the model generation. Table III showed that the predicted k/s values were close to the experimental k/s values, confirming the validity and the adequacy of the developed model. The percent error ranged from 1.05 to 2.17% (<5%), and was considered acceptable.
Results of the Confirmation Experiments Showing k/s Model Prediction Error (%)
Conventional Vat Dyeing versus OPE Vat Dyeing
Various dyeing characteristics, along with fastness and bursting strength values, resulting from both dyeing methods are listed in Table IV. The conventional and OPE vat dyed fabrics gave similar color yield (k/s values) of 2.53 and 2.02, respectively. The slightly greater k/s value with hydrose may be explained by the high oxidation-reduction potential (ORP) of the conventional dyeing bath, which ensured full dye reduction. The color coordinate values, CIE L*, a*, and b*, for OPE dyed fabrics (L* = 57.32, a* = 17.71, and b* = 0.25) and conventionally dyed fabric (L* = 65.16, a* = 19.58, and b* = 0.88) fell in the same chromaticity zone. Therefore, it can be said that the tone of the fabric was not altered by the substitution of OPE for hydrose as reducing agent. To ascertain the uniformity of dyeing, the RUI was measured. The RUI values of 0.06 and 0.09 for hydrose and OPE dyed fabric, respectively. suggest that uniform dyeing occurred. Both conventional and OPE vat dyeing produced excellent wash fast dyed fabrics. Bursting strength of the conventionally dyed fabric was 50 kPa less than OEP dyed fabric. The pH of the conventional dye bath was much higher, which may be harsh on the fabric, thereby reducing the bursting strength of the knitted fabric.
Comparison of OPE Vat Dyeing and Conventional Vat Dyeing
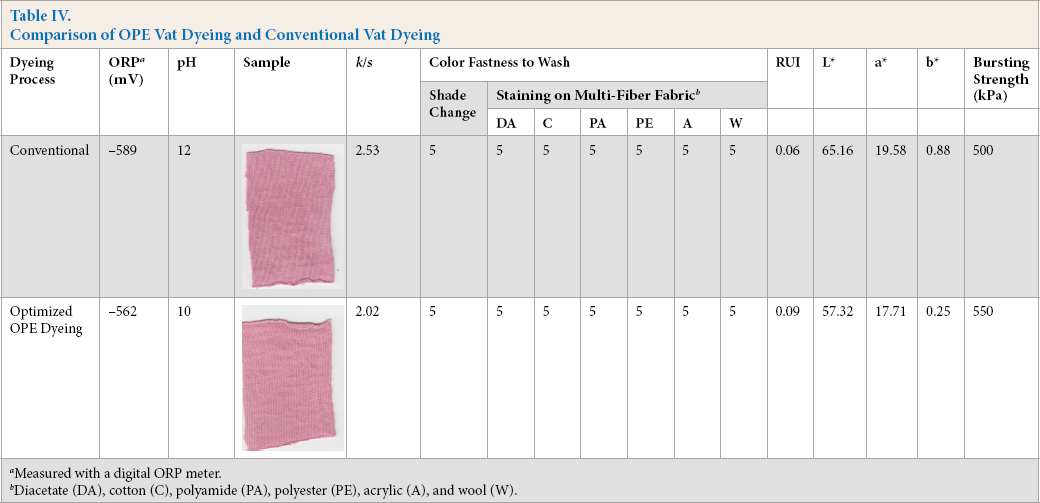
Measured with a digital ORP meter.
Diacetate (DA), cotton (C), polyamide (PA), polyester (PE), acrylic (A), and wool (W).
Conclusion
Orange peel extract (OPE) was successfully used as a new reducing agent for vat dyeing of cotton fabric. To optimize dyeing conditions with OPE, the Box-Behnken design (BBD) was used. A total of 15 dyeing experiments were carried out by varying OPE concentration, alkali concentration, and vatting temperature. A quadratic model was established to show the relationship between dyeing variables and color yield. An optimal condition for the maximum color yield was calculated and found inside the design space. When compared with the sample dyed with the hydrose conventional reducing agent, the sample dyed with the optimized new recipe showed similar (excellent) wash fastness and better bursting strength, with a slightly lower color yield. Therefore, OPE may be a new alternative reducing agent for vat dyeing of cotton fabric. Moreover, since sulfur dyes also require reduction before applying to cotton fabric, it may be possible to use OPE in sulfur dyeing as well.