
Abstract
AATCC TM100 is one of a number of standard test methods commonly used for quantitative assessment of antimicrobial textiles performance. However, as currently written, the method allows for a number of steps to be conducted with several options, with reproducibility between testing laboratories being problematic. Options for the number of swatches and inoculum carrier (nutritive vs non-nutritive) were hypothesized to be primary drivers for variability. The present study attempted to identify sources of inter-laboratory variability. It was shown that specifying the number of swatches and inoculum carrier did not eliminate variability, as these parameters were not alone responsible for the outcome. Many other parameters were assumed to not affect the outcome. Additional systematic examination of these parameters was needed to determine their role in causing inter-laboratory variability.
Introduction
The inherent ability of textiles to serve as a growth reservoir for microorganisms such as fungi and bacteria has long been known. 1 For this reason, fabrics with antimicrobial finishes have become an area of focus in the textile industry. Antimicrobial agents can typically inhibit or kill microorganisms by disruption of membrane transport, impairing membrane permeability, and interfering with normal metabolic processes. 2 Among the applications of these finishes is odor prevention, protection against disruptions in color, and protection against disruptions in fabric integrity, 3 all caused by microbial growth. For military purposes, the steady increase in skin and soft tissue infections (SSTI) among soldiers has motivated the investigation into establishing a requirement for antimicrobial textiles in soldier uniforms to prevent against such afflictions. 4 Antimicrobial textiles are also used with the goal of reducing soldier hygiene issues such as odor, skin irritation, and athlete's foot; these can occur during deployment due to austere operational environments that lack access to laundry and showering facilities. 5
As with any technology, a reliable test method is required to determine material performance. The American Association of Textile Chemists and Colorists AATCC TM100-2012 is a quantitative test method used to evaluate the activity of antibacterial textile finishes by calculating the reduction of microbes after 24 h contact time. 6 This test is used for evaluating textiles where bactericidal activity is intended or implied and is generally accepted as an industry standard. One of the test organisms used is the Gram-positive bacteria Staphylococcus aureus, representative of the species commonly associated with SSTI and odor.7,8
AATCC TM100 has been compared in previous studies to other quantitative standard test methods such (JIS) L 1902 and ISO 20645.9-12 Torlak sought to quantitate measurement uncertainty in AATCC TM100 and ASTM E2149, by focusing on the microbiological enumeration. 13 No studies aimed at identifying procedural steps within AATCC TM100 that contribute to test variability have been conducted to date. As written, AATCC TM100 has numerous steps that are subject to interpretation and is historically not reproducible. Variables such as inoculum preparation, incubation container, cell recovery, and others are not specified in AATCC TM100-2012, allowing the specifics of these parameters to be at the discretion of the testing laboratory. As such, differences were observed in results between labs that are outside the precision and bias values stated in the method.
Two steps are hypothesized as primary drivers of variability: 1) number of swatches tested, and 2) inoculum carrier used. The number of swatches needed to test 1 mL of inoculum can vary dramatically, which in turn will have differing levels of antimicrobial treatment and may result in varied antimicrobial activity. The number of swatches is determined empirically, and if an insufficient quantity is used, it may result in cells not in contact with the antimicrobial textile, reducing the log reduction results. Inoculum carrier can range from high nutrient (concentrated growth media) to non-nutrient (buffer or saline) conditions. Choice of carrier will impact the metabolic state of the test bacteria (active growth vs static conditions) and would be expected to affect activity. Additionally, there is no guidance about how to handle the inoculated swatches, including incubation conditions for the 24 h contact time, cell recovery, and other parameters.
The goal of this study was to determine to what degree the variation exists under the AATCC TM100-2012 testing procedure and to identify the steps most likely to significantly contribute to the variability. The study was comprised of two parts: testing labs using 1) their inhouse AATCC TM100-2012 method and 2) a stricter version of AATCC TM100-2012 that specifies inoculum carrier and number of swatches based on a single swatch adaptation of the method. 14 For each part, parameters for various steps in the method were tracked to identify the step or steps contributing to variability.
Materials and Methods
Identification of Procedural Steps
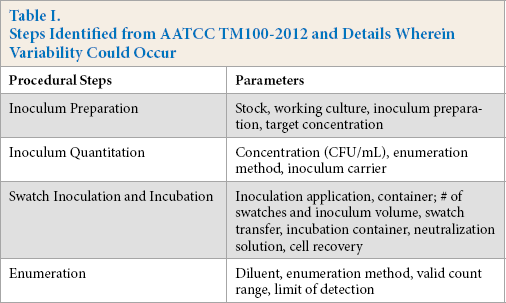
The procedural steps and specific parameters in AATCC TM100-2012 where variability could potentially occur are summarized in Table I. These steps were compiled into a single call-out sheet and distributed to each testing laboratory with each shipment of swatches. Laboratories were instructed to fill out the sheet at the conclusion of each round of testing and it was to be returned to Natick Soldier Research, Development & Engineering Center (NSRDEC) with the final report.
Steps Identified from AATCC TM100-2012 and Details Wherein Variability Could Occur
Textile Samples
Tree fabric materials were tested in this study, designated here as “Charlie,” “Mike,” and “PC.” Charlie was an untreated, cotton fabric with a camouflage print that served as the test method control. Mike was a silver-treated, nylon-cotton (NyCo) blend fabric that was gray in color. PC was a silver-treated, NyCo blend fabric that was brown in color. Swatches of each test fabric were cut at NSRDEC using a steel die and a Freeman-Schwabe hydraulic press into circles 4.8 cm in diameter as dictated by AATCC TM100-2012. Fabrics were handled with latex gloves in an effort to reduce contamination by preventing skin-to-textile contact.
Test Organism
aureus (ATCC 6538, American Type Culture Collection) was selected for this study, as per AATCC TM100-2012. Long term storage and inoculum preparation were determined by each testing laboratory.
Study Design
Four commercial laboratories that offer AATCC TM100 testing participated in this study. Testing laboratories were informed if fabrics were treated or not prior to testing, though specific expected activity levels were not disclosed. Labs performed two tests using three replicate swatches of each textile material at 0 and 24 h contact time using their inhouse AATCC TM100 method, followed by two tests using a single swatch variation of AATCC TM100, also with three replicates of each textile as above (Fig. 1). The single swatch method specified 1) inoculum concentration, 2) each replicate consisted of a single swatch, and 3) inoculum carrier (Table II).
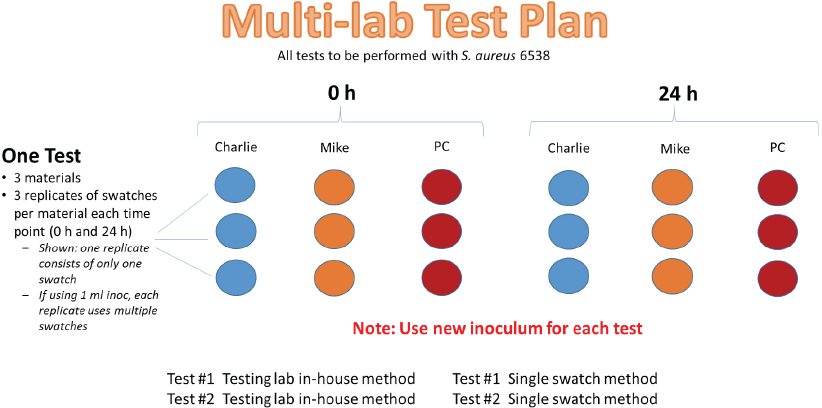
Study design for testing three materials using the testing lab inhouse method and single swatch modification.
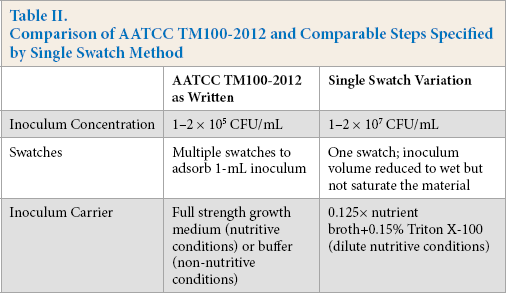
Comparison of AATCC TM100-2012 and Comparable Steps Specified by Single Swatch Method
Testing Laboratory Reports
Reports provided for each test consisted of details of parameters used, raw data plate counts, and log reduction calculations. For samples yielding plate counts = 0 CFU (colony forming units), a value of 1 was assigned to the lowest dilution to calculate CFU/swatch and log reduction.
Bacterial Growth Studies
Nutrient broth (NB), Trypticase Soy Broth (TSB), and Brain Heart Infusion Broth (BHI) were purchased from BD Diagnostics. S. aureus 6538 cultures (3 mL) inoculated from frozen stocks were grown in triplicate to mid-log at 37 °C to OD600 = 0.5-1 (∼1 × 10⁸ CFU/mL), then diluted to 1 × 10⁵ CFU/mL in fresh growth media to examine growth characteristics. Cells (200 μL) were added in triplicate to a 96-well microplate; growth medium without cells were run as controls. Microplates were incubated overnight at 37 °C and OD595 was determined every 30 min on a GENios microplate reader (TECAN Austria GmbH). For each culture medium, OD readings from the three cultures were averaged to plot the growth curves.
To assess bacterial viability at various times during growth, S. aureus culture (5 mL) was grown for 24 h at 37 °C with 200 rpm agitation; 1-mL aliquots were removed for qualitative assessment using the Live/Dead staining kit (Life Technologies) according to the manufacturer's protocol. Briefly, equal volumes of SYTO 9 and propidium stains were combined, 3 μL of the mixture added to 1 mL of cells in water, and then incubated for 15 min in the dark. Cells were imaged using a Nikon Eclipse E200 fluorescence microscope (Nikon USA) equipped with a Micropublisher Model MP5.0-RTV-CLR-10 digital camera (QImaging). Images were acquired under fluorescent settings using a C-SHG1 mercury lamp (Nikon USA) with B-2E/C (excitation = 465-495 nm, emission = 515-555 nm) and G-2E/C (excitation = 540 nm, emission = 605 nm) filters.
Statistical Analysis
Least square means statistical analysis with Tukey-Kramer adjustment for multiple comparisons was performed on 0 h CFU counts from the four testing laboratories using both their inhouse and single swatch methods on three different textile samples (Charlie, Mike, and PC). Pairwise comparisons of mean CFU counts were done as follows: testing labs using inhouse methods for all textiles combined and each textile material individually, and labs using the single swatch method for all textiles combined and each textile material individually. Comparisons were made at α = 0.0500 to determine if results were statistically significant.
Results and Discussion
Methodology and Log Reductions
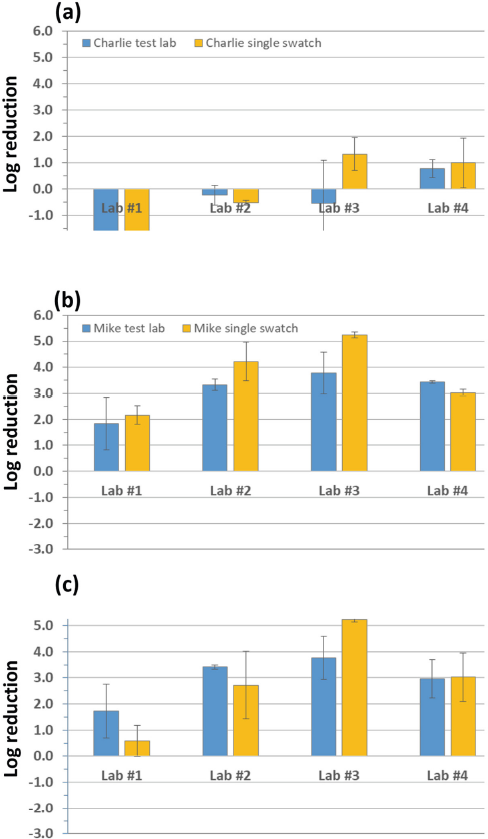
For the testing of lab inhouse methods, comparison of parameter details demonstrated that numerous steps were done differently throughout the method (Table III) that resulted in variable log reduction activity (Fig. 2). The untreated control showed minimal reduction or growth of bacteria, indicating that the assay was working (a large log reduction would indicate an invalid test). Treated fabrics Mike and PC all showed log reduction; Labs #2 and #4 were very similar, with the means differing by ∼0.5-log or less. Lab #3 showed the most reduction, greater by an additional 0.5-log. However, all reported values for Mike and PC were at the limit of detection, so the actual log reductions could not be determined. Only Lab #1 results did not reach limit of detection, and its results were at ∼1 or 2-log less than the others.
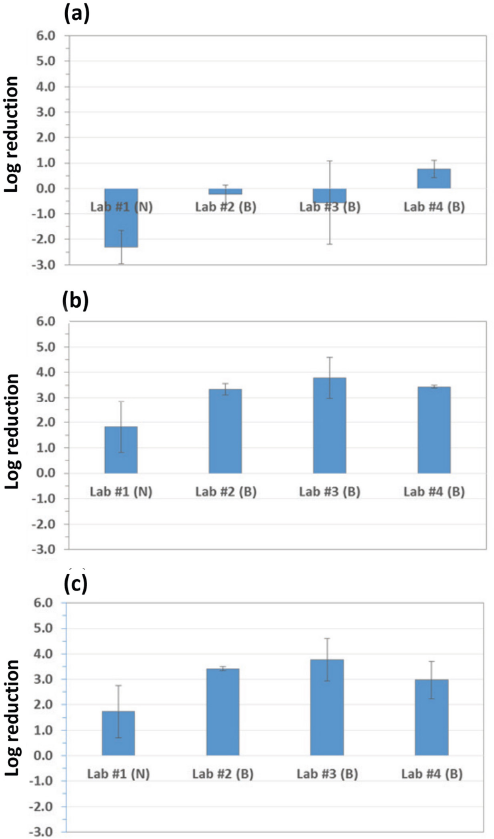
Log reductions for each swatch material from testing lab inhouse methods for: (a) Charlie, (b) Mike, and (c) PC. Log reductions were variable between testing lab methods. N = nutritive conditions and B = buffer (non-nutritive conditions). All Mike and PC log reductions were equal to or greater than the reported value; limit of detection was reached for 24 h contact time for at least one of the tests.
Lab-Specific AATCC TM100-2012 Procedural Steps for Testing Lab Inhouse Protocols a
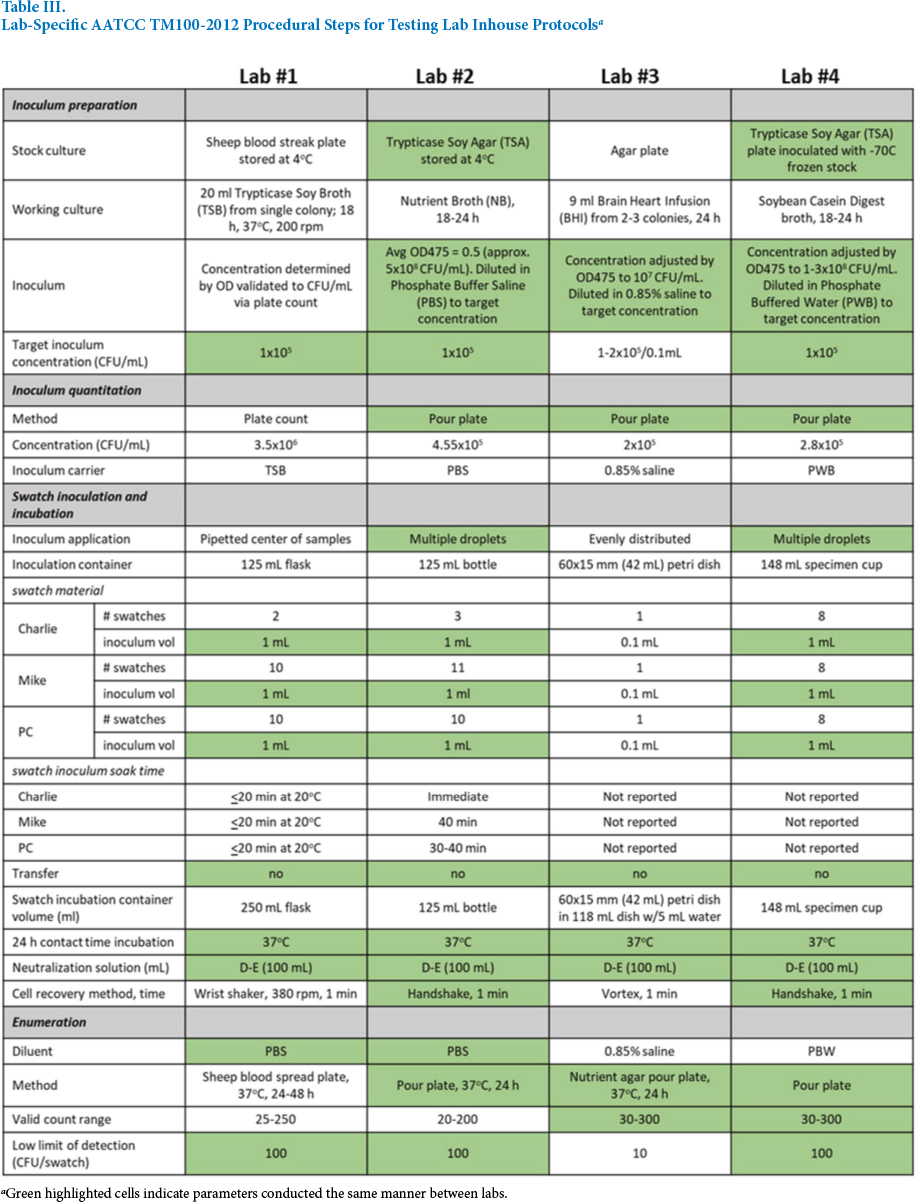
Green highlighted cells indicate parameters conducted the same manner between labs.
Sources of Variability
As mentioned previously, the inoculum carrier was considered to be a primary driver in variability. It would be expected that testing under nutritive conditions would result in reduced log reduction compared to non-nutritive, static growth conditions found in buffer solutions such as phosphate buffered saline (PBS) or phosphate water buffer (PWB).
Cells in a fully nutritive carrier would be metabolically active, with cell growth competing against the activity from the antimicrobial technology. Trypticase soy broth (TSB), as a nutritive carrier (Lab #1), showed the least log reduction, while non-nutritive carriers PBS (Lab #2), 0.85% saline (Lab #3), and PWB (Lab #4), had increased log reduction, as expected. This effect of nutritive vs. non-nutritive conditions has been observed when testing immobilized antimicrobial peptides (AMPs), in which AMP activity was overtaken by cell growth; activity was restored under non-nutritive conditions. 15 The number of swatches also did not appear to contribute to variability; Labs #1, #2, and #4 used similar numbers (with the exception of Lab #4 with Charlie); Lab #3 differed by using single swatches for each material.
The single swatch method sought to determine if specifying the number of swatches and inoculum carrier would reduce or eliminate variability. Single swatches were used to represent “real world” conditions that would not use multiple layers of textile material. Tat did, however introduce inoculum volume as a new variable, with the volume determined empirically by the testing labs. Based on the inhouse vendor method results, it was expected that use of a specified inoculum carrier would confirm that it was a prime cause of inter-lab variability. A dilute nutrient solution (0.125× nutrient broth) was defined as the inoculum carrier to avoid full nutritive (1× concentration growth medium) or non-nutritive (buffer) conditions that were less than realistic growth environments. Triton X-100 (0.15%) was also added as a wetting agent to help synthetic materials better absorb the inoculum (this has been determined not to affect cell viability or growth).
Comparison of test lab protocols using the single swatch method also showed that numerous parameters were done differently throughout the method (Table IV), and gave similar log reduction outcomes to the testing lab inhouse methods (Fig. 3); it was clear that the steps specified did not eliminate or significantly reduce the reproducibility issues. Interestingly, the resulting log reduction activity profile looked very similar to those of the testing lab inhouse methods. This suggests that there were inherent differences beyond inoculum carrier and number of swatches in how the various labs conducted the test, and that the differences were due, at least in part, to parameters either not being specified or not being tracked.
Log reductions from testing labs using single swatch method was variable in spite of specifying number of swatches and inoculum carrier for: (a) Charlie, (b) Mike, and (c) PC. This outcome showed a similar profile to test lab method results from Fig. 2, included here for ease of comparison. All Mike and PC log reductions were equal to or greater than the reported value; limit of detection was reached for 24 h contact time for at least one of the tests.
Parameters from the Single Swatch Method a
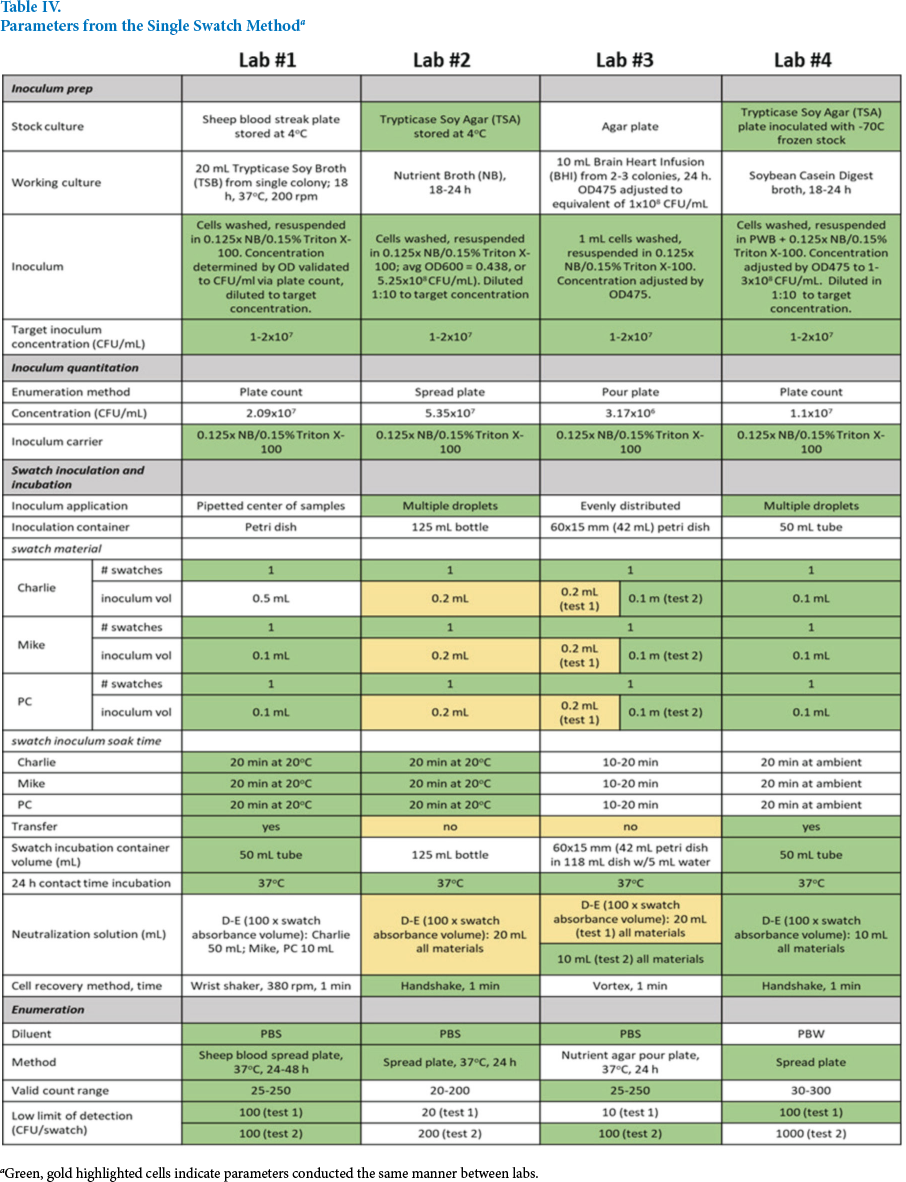
Green, gold highlighted cells indicate parameters conducted the same manner between labs.
To investigate variability in the log reduction results, 0 h counts were examined to determine the impact on textile activity. Labs were compared in a pair wise fashion to determine if the results were statistically different to one another. When comparing results for all textile materials, the data demonstrated numerous statistical differences between labs comparing the testing lab inhouse method results (Fig. 4a). This is indicated by the solid line segments, shown in blue, that do not intersect the dotted diagonal reference line. The single swatch data showed no statistically significant differences, as all line segments, shown in red, crossed the reference diagonal (Fig. 4b). However, the variance of counts were greater for the single swatch method, represented by the longer line segments for the pair wise comparisons. Further detail for pair wise comparisons based on each textile materials can be found in Fig. 4c. Although the 0 h counts were found to differ statistically between labs, it appears that this was not causing the reported log reduction results. For each textile material, there was no correlation evident when plotting log 0 h CFU/swatch vs log reduction (Fig. 5); the result was a wide range of log reductions for 0 h counts that all fall within <1-log range. While this was expected for the untreated material Charlie, it was also evident for the treated textiles Mike and PC. As noted previously, many of the log reduction values could not accurately be calculated due to reaching the limit of detection for many of the Mike and PC results; this may have had a confounding effect on determining what if any effect the 0 h counts had on log reduction.
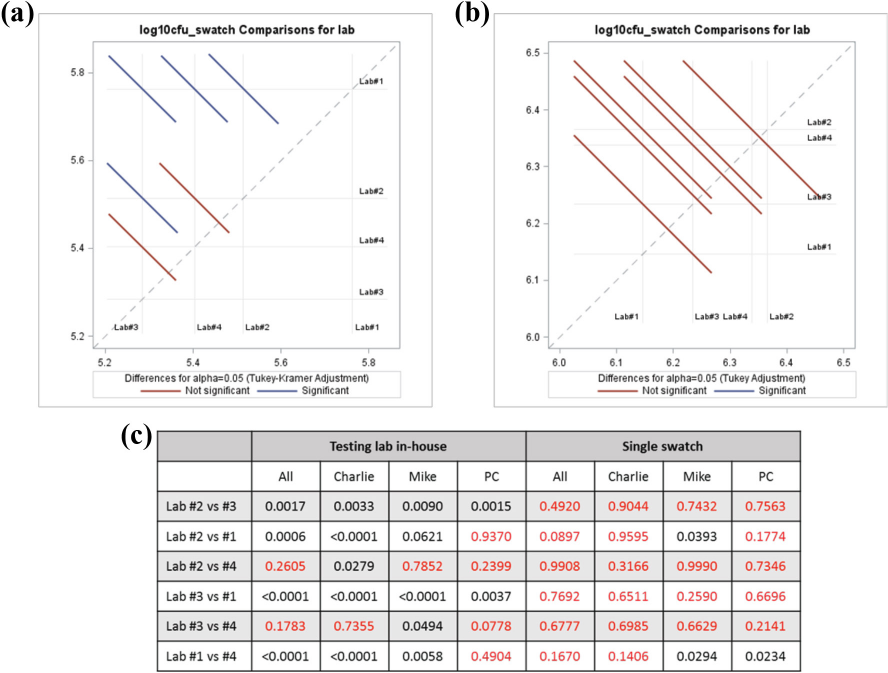
Pairwise testing lab comparison of 0 h counts (CFU/swatch) to determine variability: (a) all textile data from the testing lab inhouse method, (b) all textile data from the single swatch method, and (c) pairwise comparisons by textile material. When line segments crossed the dotted diagonal reference line, they were considered to have no statistical difference. Inhouse comparison showed significant statistical differences between numerous labs, indicated by the blue line segments that did not cross the reference line. No statistical difference was seen for the single swatch data; this result was likely do to the greater variance of counts, represented by the longer line segments compared to the in-house method. For (c), values in red indicated no statistically significant difference between labs; black showed significant differences. p-values ≤0.05 were considered statistically significant.
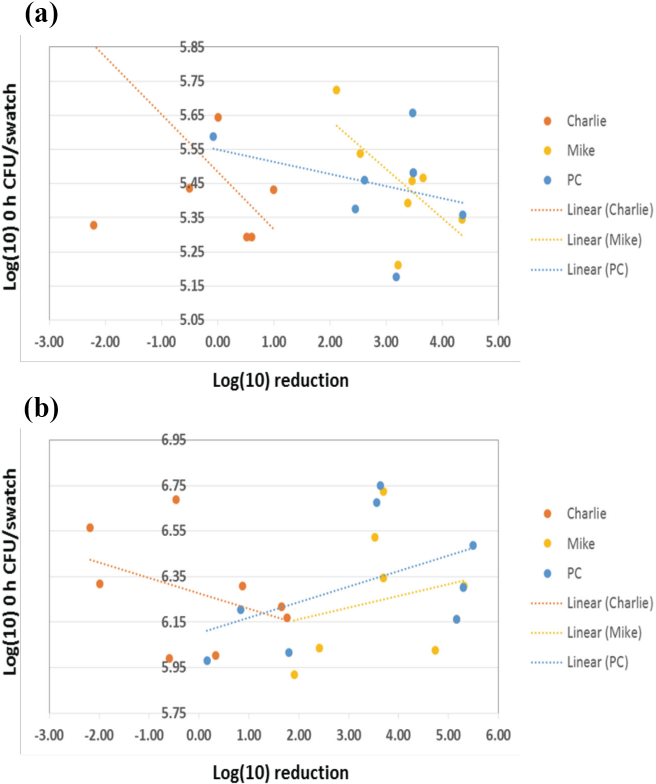
Comparison 0 h count (CFU/swatch) on log reduction activity of: (a) testing lab inhouse method and (b) single swatch method. No correlation was evident of the impact of the variability of 0 h counts on log reduction activity for any of the textiles, as a wide range of log reductions resulted from a narrow range of log CFU/swatch results
It appeared that parameters associated with the 24 h incubation were responsible for the differences in log reduction results. 0 h counts were similar, while a greater variation was seen after 24 h contact time, a result previously reported in literature. 13 Numerous parameters come into play during the 24 h contact time incubation that may impact test results. Inoculum preparation, for example, could impact the metabolic state of the test organisms. A kinetic microplate study of the culture media used by the testing labs resulted in different S. aureus growth profiles. While brain heart\ infusion (BHI) and TSB showed typical growth characteristics, growth rate in nutrient broth (NB) was reduced and the culture appeared to only reach stationary phase after 24 h (Fig. 6). A separate kinetic study using three cultures was conducted to further investigate growth on NB by increasing incubation to 48 h; it was found that the stationary phase was indeed reached after ∼40 h (data not shown). Kinetic microplate assays were a convenient method for determining the growth profiles of numerous samples; they were not, however, expected to duplicate AATCC TM100 inocula preparation that grow cells in culture tubes in a shaking incubator. Cultures grown for AATCC TM100 would still be expected have differing growth profiles based on the culture medium used. In this study, testing labs grew cultures 18-24 h, and it is possible that choice of culture medium may have resulted in the cells being at different points of growth when used. It is possible these cultures had reached stationary phase; the time at which stationary phase was achieved depends on the growth media and method of inoculation.
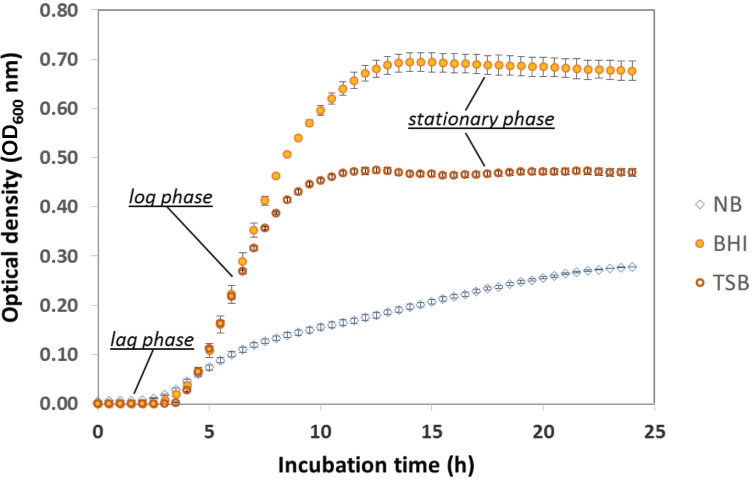
Kinetic microplate growth curves of S. aureus 6538 in various culture media inoculated from 15% glycerol frozen stocks (n = 3 cultures in each medium). BHI and TSB exhibited typical growth curves consisting of a lag phase (metabolic adjustment to new media, but no cell division), a log phase (rapid exponential growth), and a saturation phase (cells cease active growth). NB growth was much slower and appeared to approach, but not reach, stationary phase. Growth profiles for these media were very different, which may affect the cell susceptibility and behavior in AATCC TM100-2012.
The bacterial metabolic state varies depending on the growth phase. Live-Dead staining of S. aureus cultures grown under similar conditions and used by the testing labs showed the impact on cell viability by length of time in the stationary phase (Fig. 7). This may be an important yet untracked parameter, as the length of inoculum incubation during the study ranged from 18 to 24 h. Based on enumeration of the 0 h samples, there appeared to be little impact of the metabolic state at 0 h contact time; however, these effects may come into play for 24 h contact times, especially when incubated under non-nutritive conditions. Choice of inoculum carrier was also shown to effect silver dissolution;16,17 ionic strength, chloride concentration, and pH all effected the release of Ag ions and the resulting antimicrobial activity.18,19
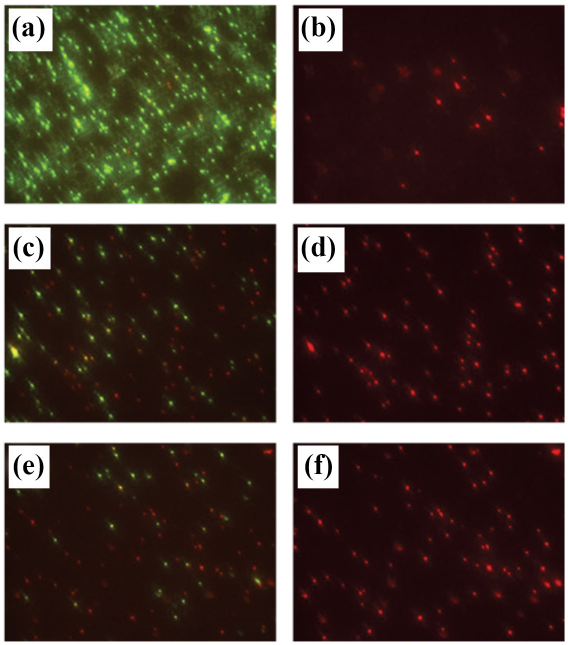
Growth of S. aureus 6538 in nutrient broth medium from frozen stocks stained with Syto9 (Live, green cells) and propidium iodide (Dead, red cells). Cell viability depended on length of incubation; mid-log cultures predominantly consisted of viable cells (green), while in saturated cultures, there were increased amounts of dead (red) or injured (yellow-orange) cells with longer incubation. Four hour mid-log cultures, Live (a) and Dead (b); 18 h incubation, Live (c) and Dead (d); 24 h incubation, Live (e) and Dead (f).
Other parameters were conducted differently without consideration of the possible effects on the log reduction outcome. One such step is the volume of the container used for swatch incubation during the 24 h contact time, as larger container volumes can potentially result in increased swatch drying. Our experience has shown that certain incubation conditions (e.g., using an unsealed container) allowed swatches to dry out, causing cell death and a reduction other than that from the antimicrobial technology. Inclusion of an inoculated untreated control swatch (e.g., untreated “Charlie” material), can serve to determine if incubation conditions other than the presence of the antimicrobial treatment were responsible for any log reduction activity observed. A similar unanticipated effect may occur during the cell recovery step after 24 h incubation where some methods may be more efficient than others. Some studies report that choice of method, such as vortexing or sonication, impacted microbe recovery efficiency.20,21
A limitation and challenge of analyzing this multi-lab study is that the method only provides a single output (log reduction), which occurs only at the end of the test. This reduces the ability to investigate the effect of intermediate steps on the activity output. Other contact times (e.g., 4 or 8 h), although not specified by AATCC TM100, may improve the interpretation of results. This would also address situations of reaching the limit of detection at 24 h contact time and not being able to determine true log reduction values. Numerical outputs from intermediate steps may aid in identifying sources of variability. Additionally, it is possible that a combination of parameters are responsible, making this problem more difficult to analyze. It was hoped that tracking in-house method parameters would suggest the cause of the problem, but due to a small sample size (only four labs) and the fact that they all use different methods, the study did not yield the desired result. It is clear that additional study is needed to identify the causes of inter-laboratory variability. While this study focused on AATCC TM100-2012, the same factors are likely to impact other antimicrobial test methods.
Conclusions
Comparison of the inhouse methods used by the four testing laboratories demonstrated the extensive inconsistency in how AATCC TM100-2012 was conducted, which resulted in the log reduction results also exhibiting variability. Specifying the inoculum carrier and number of swatches in the single swatch method, parameters thought to be primary drivers of variability, also yielded variable results. This suggests that there were parameters not specified or not being tracked that were implicitly different in the manner the labs conducted the test.
Additional work is needed to systematically examine parameters currently conducted differently, but assumed not to impact the outcome, to determine what role they may have in affecting the results. Lack of quantitative measurements as the test is conducted is a limitation that needs to be addressed to better examine the method. The interaction of numerous factors can influence the outcome and made it difficult to identify problematic steps. Detailed reporting of how the test was performed would help interpret the different results obtained between labs. Due to the number of parameters potentially affecting antimicrobial activity and the variability inherent in biological systems, standardizing the test method to the greatest extent possible should help mitigate the current issues.
Footnotes
Acknowledgements
The authors would like to thank the AATCC Antimicrobial Activity Committee (RA31) for useful discussions in designing the tests for this effort and the testing labs that participated in the study. We would also like to thank the following Natick Soldier Research, Development and Engineering Center colleagues for useful and interesting discussions: Dr. Paola D'Angelo, Dr. Ida Gisela Pantoja-Feli-ciano, and Mr. Robert Stote.